the Creative Commons Attribution 4.0 License.
the Creative Commons Attribution 4.0 License.
 | 19 Apr 2024
Projection of climate change effects on flood inundation in the Gin River basin, Sri Lanka
Jayapadma Mudalige Miyuru Uthpala Jayapadma
Kazuyoshi Souma
Hiroshi Ishidaira
Jun Magome
Thushara Navodani Wickramaarachchi
Human-induced climate change has altered the frequency and severity of heavy precipitation, droughts, and floods worldwide. Sri Lanka, a developing country in the Indian Ocean, has suffered frequent floods, affecting over 64 % of the population in the past decade. The Gin River, the primary drinking water source of the densely populated Galle district with over 1 million residents, faces recurrent flood disasters. Therefore, this study employed a multi-model ensemble to simultaneously simulate the impact of climate change on both river flow and inundation extent in the frequently flooded Gin River basin located in humid tropical monsoon region. Bias-corrected climate projections of an ensemble of five General Circulation Models (GCMs) from the Coupled Model Inter-comparison Project Phase 5 (CMIP5) under Representative Concentration Pathway (RCP) 4.5 emission scenario were used to project future river flow and flood inundation in the Gin River basin, Sri Lanka. The validated Rainfall–Runoff–Inundation (RRI) model projected a 5 % increase in high flows (flows exceeding a 5 % probability of exceedance (<Q5)) at the downstream (Baddegama) gauging station and a 16 % increase at the upstream (Thawalma) gauging station in the future (2040–2060) in comparison to the past (1980–2000), which can be attributed to the elevated rainfall projected during the two monsoon seasons (southwest monsoon (May–September) and northeast monsoon (December–February)) by the GCM ensemble. In addition to the projected changes in high flows revealed by the RRI simulations, the model also yielded critical information about the expansion of annual maximum inundated extent in the basin by 3.5 % that will aid flood risk projection and sustainable management in the basin.
- Article
(2358 KB) - Full-text XML
- BibTeX
- EndNote


Human-induced climate change is predicted to intensify average and heavy precipitation over Asia with high to medium confidence, which will pose severe threats to human livelihoods in the region in terms of disaster preparedness under all emission scenarios until at least the middle of the 21st century (IPCC, 2023). Damage due to floods is expected to increase with further economic growth, urbanization, and climate change, emphasizing the importance of understanding the driving factors of flood risk required for effective adaptation (Winsemius et al., 2016; Kreibich et al., 2017).
General Circulation Models (GCMs) are crucial tools for projecting future climate variables at regional to continental scales in climate-impact assessments. However, predicting future streamflow at a basin-scale under a changing climate comprises multiple stages, including the selection of emission scenarios, GCM selection, spatial disaggregation, bias correction, and hydrological modeling. The different combinations of scenarios, models, and methods at each stage yield varying projections, contributing to total uncertainty. Extensive research has consistently identified GCM selection as the major source of this uncertainty, recommending the use of a multi-model ensemble to minimize the uncertainty stemming from GCMs (Nijssen et al., 2001; Zhang et al., 2011; Bastola et al., 2011; Lee et al., 2021).
Sri Lanka is a developing country located in the Bay of Bengal, where more than 64 % of the island's population has suffered from flooding of major river basins in the past decade, including the Gin River basin. The Gin River is the main water source of drinking water in the Galle district and the district is home to more than 1 million people. Recurrence of flood disasters will significantly affect their livelihoods as well as the economic development of the area. Therefore, elucidation of the driving factors of floods in this river basin is urgently needed to develop effective flood mitigation plans. To address this need, this study assesses the impact of climate change on both future river flow and inundation using a multi-GCM ensemble, which is a key aspect of this study, as the initial step of an integrated flood risk assessment for the study area.
This study evaluated the impact of climate change on future flooding in the Gin River basin, Sri Lanka, using an ensemble of general circulation models (GCMs) obtained from the Coupled Model Inter-comparison Project Phase 5 (CMIP5). The precipitation projected under the Representative Concentration Pathway 4.5 (RCP4.5) emission scenario using GCMs (2040–2060) was input to the flood model developed using the Rainfall–Runoff–Inundation (RRI) model to project river flow and inundated area. The changes were assessed by comparing the river flow and inundated area for the future to those simulated using historical precipitation (1980–2000) generated by the GCMs.
Study area
The Gin River basin is one of the most frequently flooded river basins in Sri Lanka. It has a length of 113 km and a catchment area of 932 km2, with annual average rainfall of over 2500 mm. The Galle district includes around 83 % of the catchment area of the Gin River. The catchment is located around 80°08′′ to 80°40′′ E and 6°04′′ to 6°30′′ N. The Gin River basin is the major water resource supporting the Galle district's water supply system. Figure 1 shows the location and the topography of the basin based on a digital elevation model (DEM). The upstream, midstream, and downstream sub-catchments were delineated based on the location of river gauging stations.
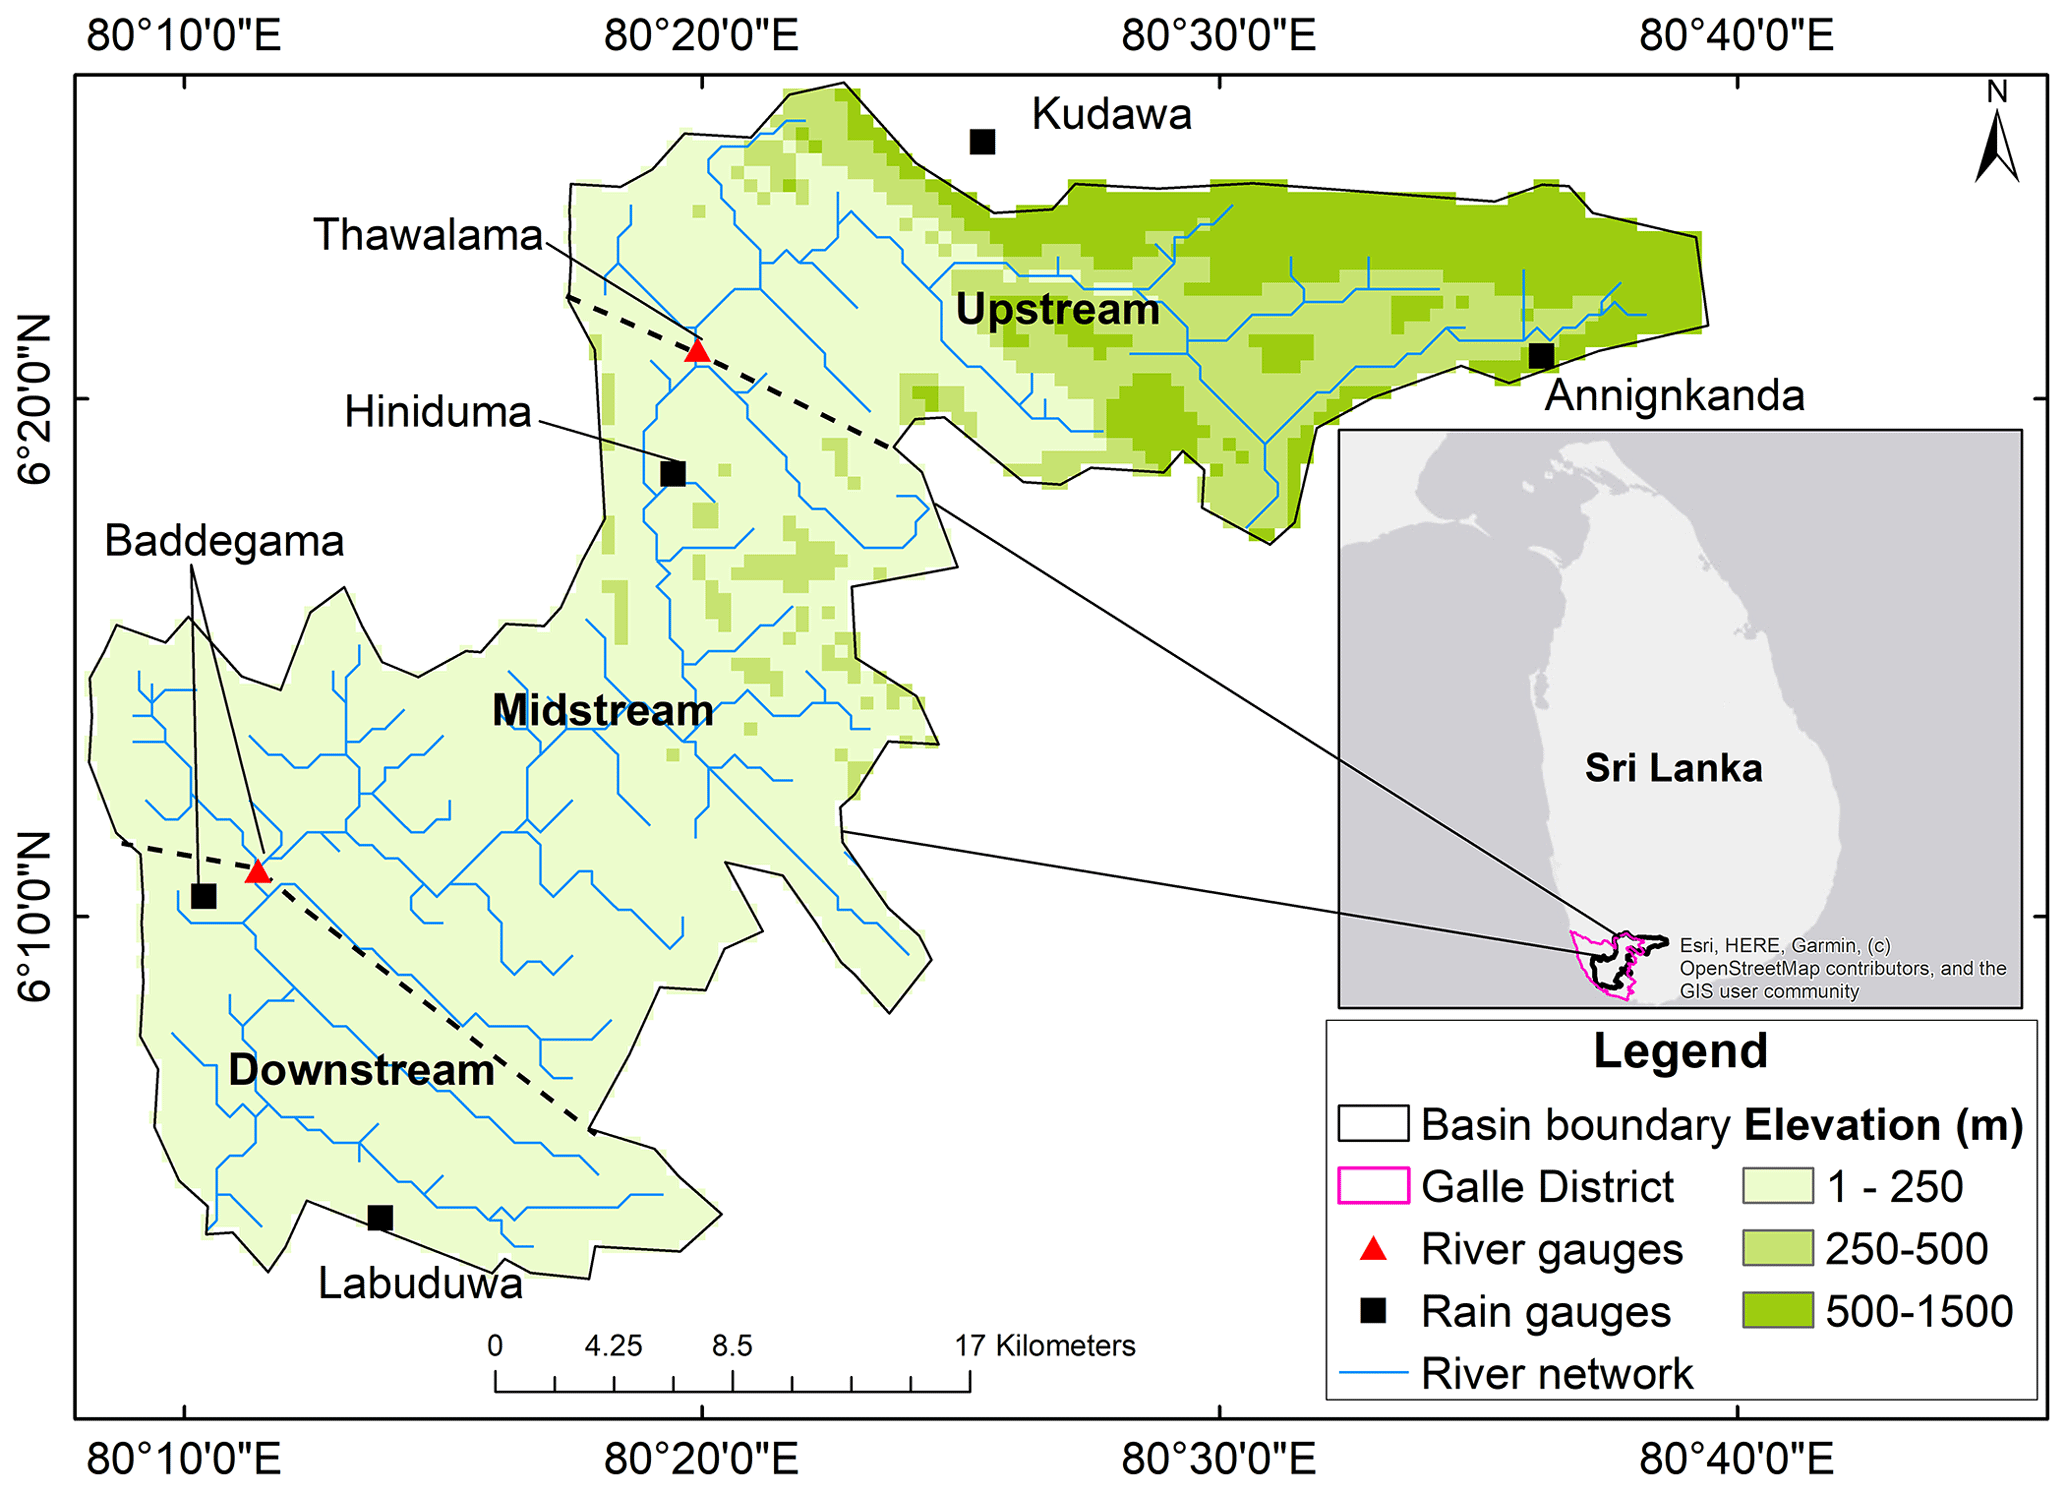
Figure 1Location of the Gin River basin and topography of the basin based on the DEM. Dotted lines denote the sub-catchments delineated based on the location of river gauging stations.
2.1 Climate change projection data
CMIP5 provides a framework for the execution of climate change experiments in accordance with emission scenarios driven by the RCPs defined in the Fifth Assessment Report of the Intergovernmental Panel for Climate Change (Taylor et al., 2012). Five GCMs based on the CMIP5 datasets were obtained from the Data Integration and Analysis System (DIAS) developed by the Japan Agency for Marine-Earth Science and Technology and partner universities (Kawasaki et al., 2017) to generate the inputs required by the hydrological model for simulation of future hydrological processes in the basin corresponding to the RCP4.5 emission scenario. RCP 4.5 emission scenario was selected in this study as it is considered a “stabilization” scenario in which greenhouse gas emissions peak and then decrease in the second half of the 21st century (IPCC, 2014; Taylor et al., 2012; Rogelj et al., 2016).
These GCMs were selected based on a scoring system that evaluates model performance at simulating major regional-scale climate variables through comparison with a reference dataset for the period of 1981–2000 in the study area. The precipitation and outgoing longwave radiation (OLR) at the ground surface, sea level pressure, sea surface temperature (SST), air temperature, specific humidity, and zonal and meridional winds at 850 hPa were selected as key variables. The reference datasets for precipitation, SST, and OLR were from the Global Precipitation Climatology Project (GPCP) (Adler et al., 2003), Hadley Centre (Rayner et al., 2003) and National Oceanic and Atmospheric Administration (NOAA) (Liebmann and Smith, 1996), respectively, while Japanese 25-year ReAnalysis (JRA-25) data (Onogi et al., 2007) were used as reference datasets for other climate variables. The monthly averaged spatial correlation and root mean square error (RMSE) of key variables were calculated using the tools available in DIAS. The model selection procedure is detailed in Nyunt et al. (2016).
Compared with observed rainfall from the Asian Precipitation–Highly Resolved Observational Data Integration Towards Evaluation of Water Resources (APHRODITE) project (Yatagai et al., 2012), the GCM rainfall projections exhibit underestimation of extreme values, poor seasonal simulation, and a high frequency of wet day errors. APHRODITE precipitation data was chosen due to the unavailability of continuous ground-gauged data for the period from 1980 to 2000. The biases inherent in GCM projections were corrected using the three-step bias correction method adopted by Nyunt et al. (2016).
2.2 Model and data used
The two-dimensional RRI model, which can simultaneously simulate rainfall-runoff and inundation (Sayama et al., 2012), was applied to the Gin River basin in this study. The governing equations of the RRI model are derived from the mass balance equation, Eq. (1), and momentum equation for gradually varied unsteady flow, Eqs. (2), and (3) with diffusive wave approximation where inertia terms of Eqs. (2) and (3) will be neglected, which would yield Eqs. (4) and (5). Further details about the model structure were reported by Sayama et al. (2012).
The variable h indicates the water surface height from the ground surface; qx and qy indicate the unit width discharges in the directions of the x and y axes, respectively; r denotes rainfall intensity; f indicates the infiltration rate; H indicates the water surface height from the datum; ρw represents the density of water; sgn indicates the signum function; and g is gravitational acceleration. The terms τx and τy indicate the shear stresses in the directions of the x and y axes, respectively.
The Shuttle Elevation Derivatives at multiple Scales (HydroSHEDS) data of 15 arcsec resolution (around 500 m) provided by the U.S. Geological Survey (Lehner et al., 2008), was used for DEM, flow accumulation, and flow direction data. The Global Land Data Assimilation System (GLDAS) (Rodell et al., 2004) at 0.25° resolution was used to estimate daily evapotranspiration. The CMIP5 monthly evaporation projections from the Copernicus Climate Data Store were used for the future flood simulations (Copernicus Climate Change Service (CDS), 2018). Land-use maps were obtained from the land cover project of the European Space Agency's Climate Change Initiative (Copernicus Climate Change Service (CDS), 2019). The spatial resolution of the model matched that of the DEM data (500 m). Simulations were conducted with a 600 s initial time step for slope-river interaction and a 60 s initial time step for the river, given that river calculations typically necessitate smaller time steps. The fifth-order Runge-Kutta method with adaptive time-step control, employed in RRI, shortens the time steps if necessary. The discharge simulated by RRI using daily rainfall was then compared against the observed daily discharge. The Nash–Sutcliffe Efficiency (NSE) was used to evaluate the accuracy of simulated discharge. NSE varies from −∞ to 1, where a value of 1 indicates that the simulated hydrographs agree perfectly with the observed hydrographs.
3.1 Setup of the RRI model
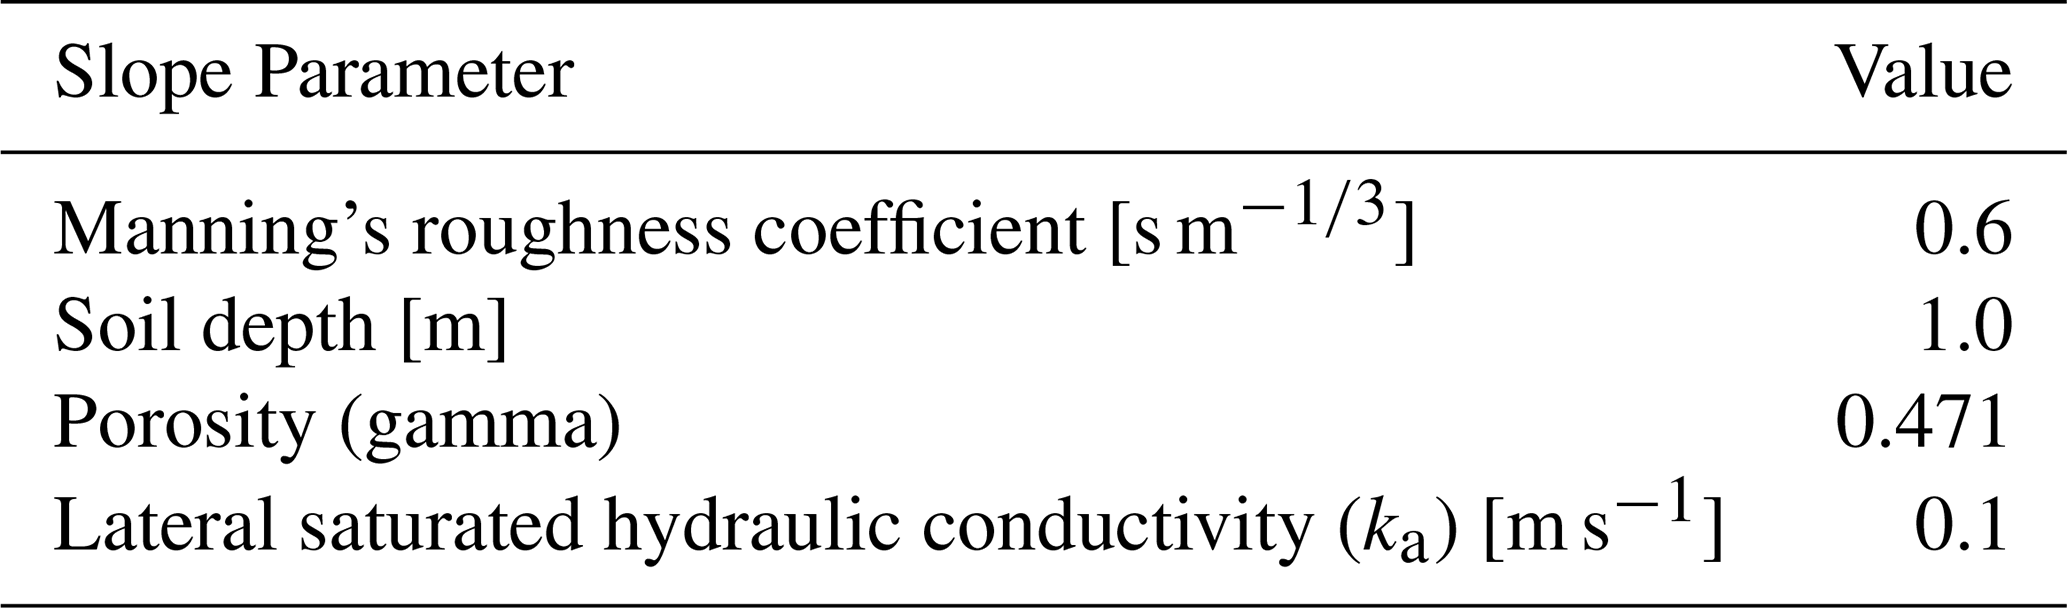
The RRI model was first calibrated for a significant flood event in May 2003 and was validated for flood events in May 2016 and May 2017, using observed precipitation data from rain gauges, through comparison with observed river discharge and inundation extent data (Jayapadma et al., 2022). The same model validated by Jayapadma et al. (2022), was verified for continuous long-term simulations incorporating observed evaporation data for the period of 1981–2000 and precipitation data from APHRODITE. Through comparison of the simulated discharge with observed discharge, the model parameters were optimized via trial and error. Observed river discharge records at upstream and downstream gauging stations (Thawalama and Baddegama, respectively) were provided by the Department of Irrigation of Sri Lanka. The optimized parameters of river and slope obtained from previous RRI model applications (Sayama et al., 2012; Jayapadma et al., 2022) are summarized in Tables 1 and 2.
A comparison of simulated and observed hydrographs based on daily APHRODITE rainfall, daily evaporation from GLDAS and the 1992 land-use map at the two gauging stations is shown in Figure 2 for the historical period of 1980–2000. All other model settings matched those used for the event-based validation described by Jayapadma et al. (2022). The index values for simulated river discharge at the downstream station (Baddegama; NSE = 0.72, RMSE = 46.32 m3 s−1; Fig. 2a) indicated a reasonable agreement with the observed river discharge for the period of 1980–2000, especially based on the NSE values. However, the peak flows were underestimated. This discrepancy can be attributed to the average approximation of soil parameters and rainfall (intensity and amount) in the catchment, because the peak flow in the catchment is primarily generated by the dominant saturated subsurface and saturated excess overland flows, as elaborated by Jayapadma et al. (2022).

Contrasting model performance was found at the Thawalama gauging station, where both peak flows and low flows were underestimated, perhaps due to the coarser resolution of the input rainfall and evaporation data (NSE = 0.41, RMSE = 30.58 m3 s−1; Fig. 2b). In addition, the coarser-resolution of topographic data can lead to the loss of fine-scale topographic details and misinterpretation of the steep, meandering river network in the upstream area of the basin. This, in turn, may result in the model underestimating peak flows, as it might not accurately capture the complex flow paths and localized flood-prone areas within the steep mountainous upstream sub-catchment. Furthermore, the coarse resolution of topography data can impact the estimation of low flows by misrepresenting the contribution of groundwater and small streams. However, the model performance was sufficient for its application in climate impact assessment within the basin, particularly in heavily flooded downstream areas of the basin (NSE = 0.72).
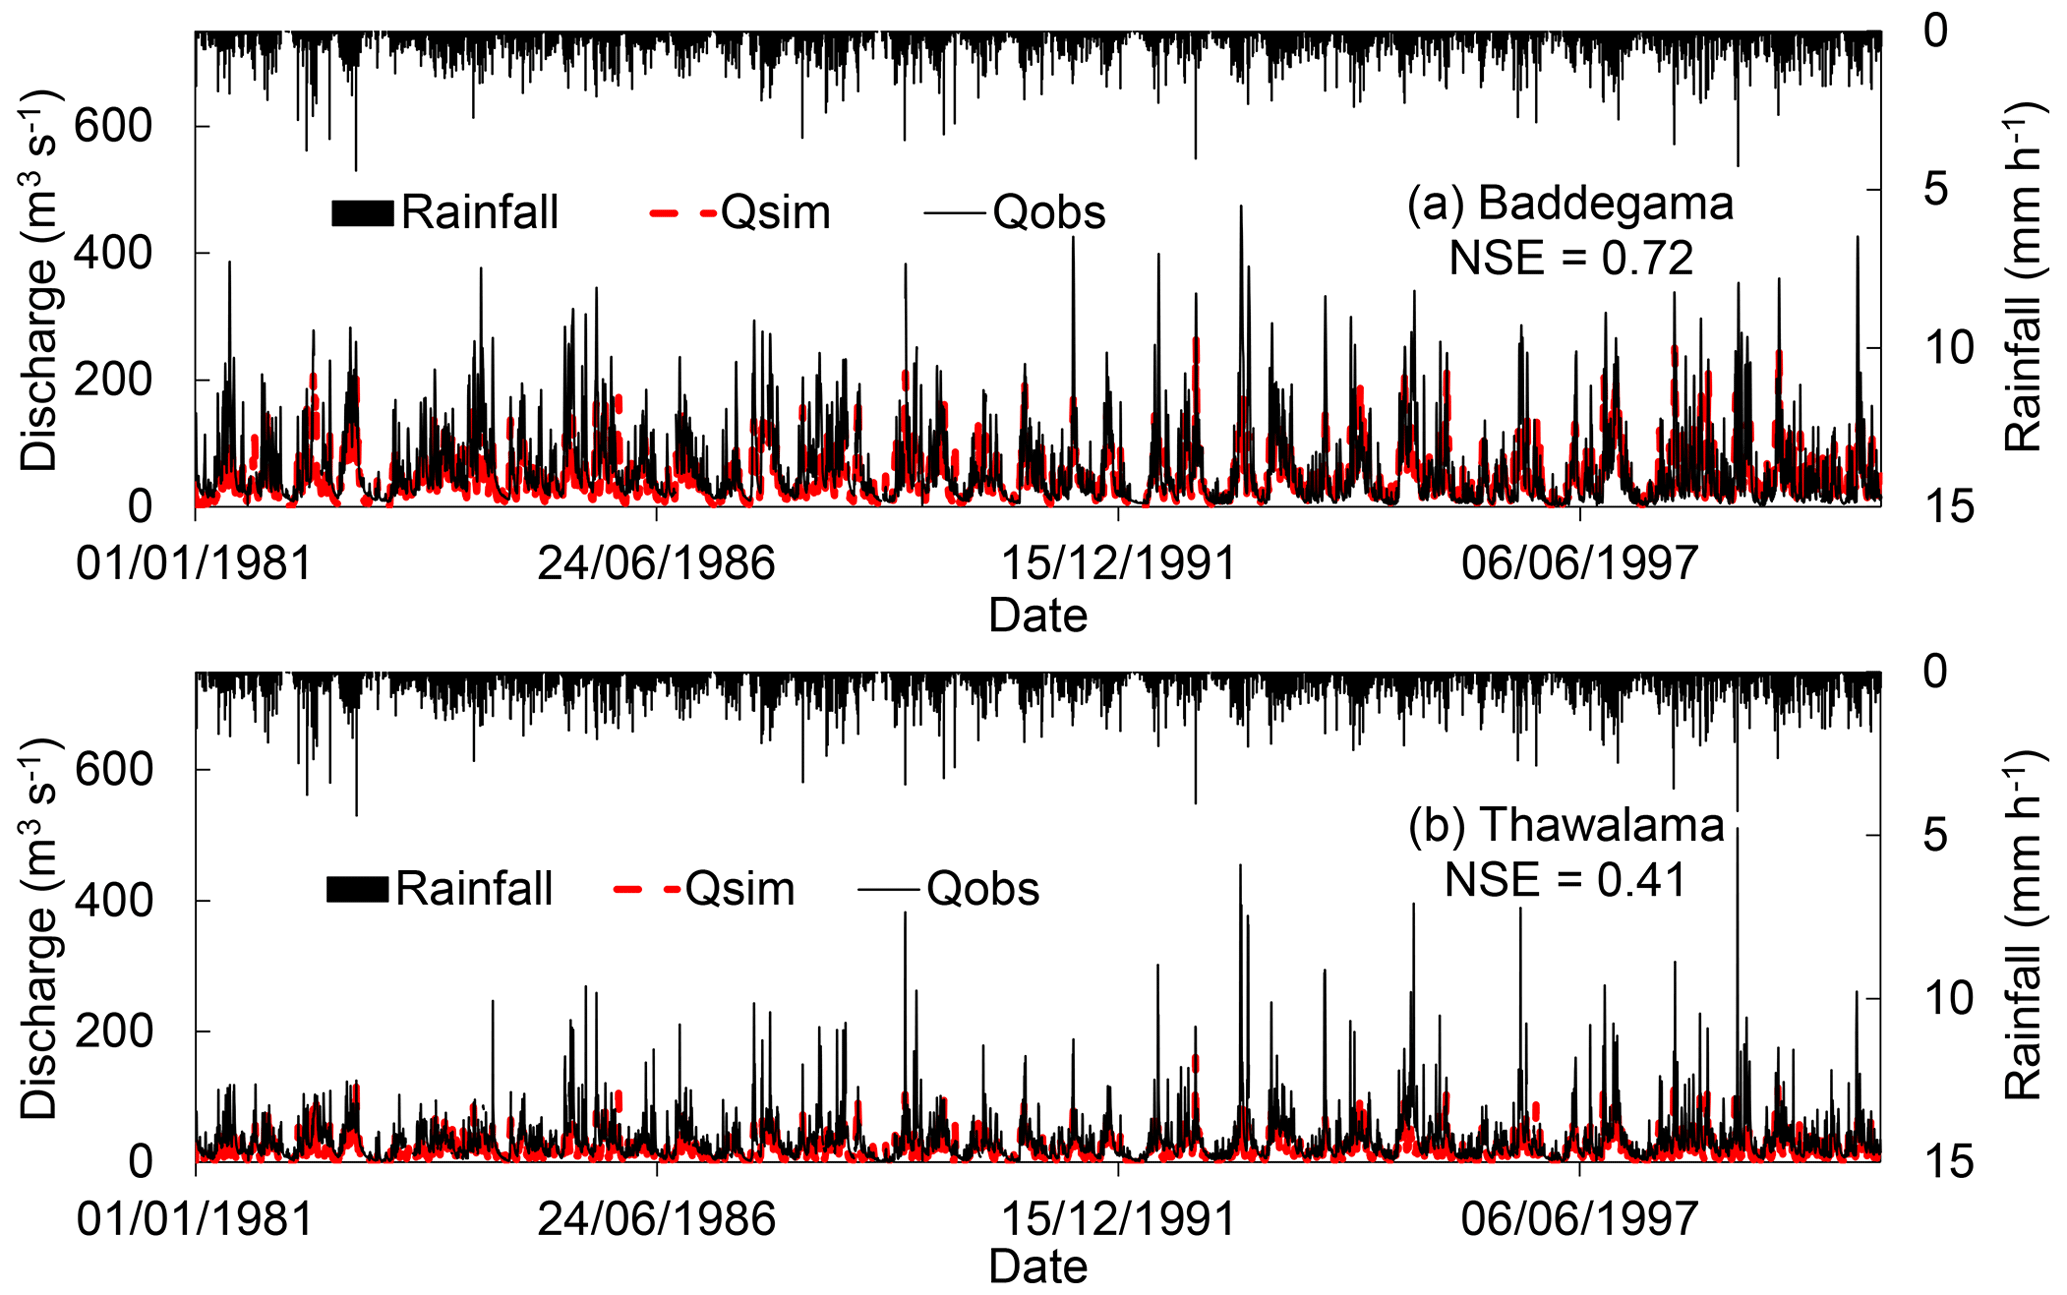
Figure 2Comparison of simulated (Qsim) and observed (Qobs) hydrographs corresponding to the historical climate. (a) Downstream gauging station. (b) Upstream gauging station.
3.2 GCM selection and bias correction
The five GCMs selected for this study based on the scoring system were ACCESS1.0 (Bi et al., 2013), CESM.CAM5 (Neale et al., 2012), CMCC.CMS (Scoccimarro et al., 2011), CNRM-CM5 (Voldoire et al., 2013), and MPI.ESM.LR (Giorgetta et al., 2013). The three-step bias correction method employed in this study effectively removed the biases present in monthly rainfall projections relative to APHRODITE rainfall data.
3.3 Impact of climate change on monthly rainfall
The basin will receive increased rainfall with greater variability in the months from August to November in the future under the RCP4.5 emission scenario, as projected by the GCM ensemble (Fig. 3). In addition, rainfall during the southwest monsoon season (May–September), when the basin historically received the heaviest rainfall, will intensify by 9.7 %. In contrast, the northeast monsoon (December–February) season showed no significant change (0.85 % increase) in rainfall under the RCP4.5 emission scenario. The projected intensification of rainfall during monsoons may affect water availability and the occurrence of extreme events in the basin.
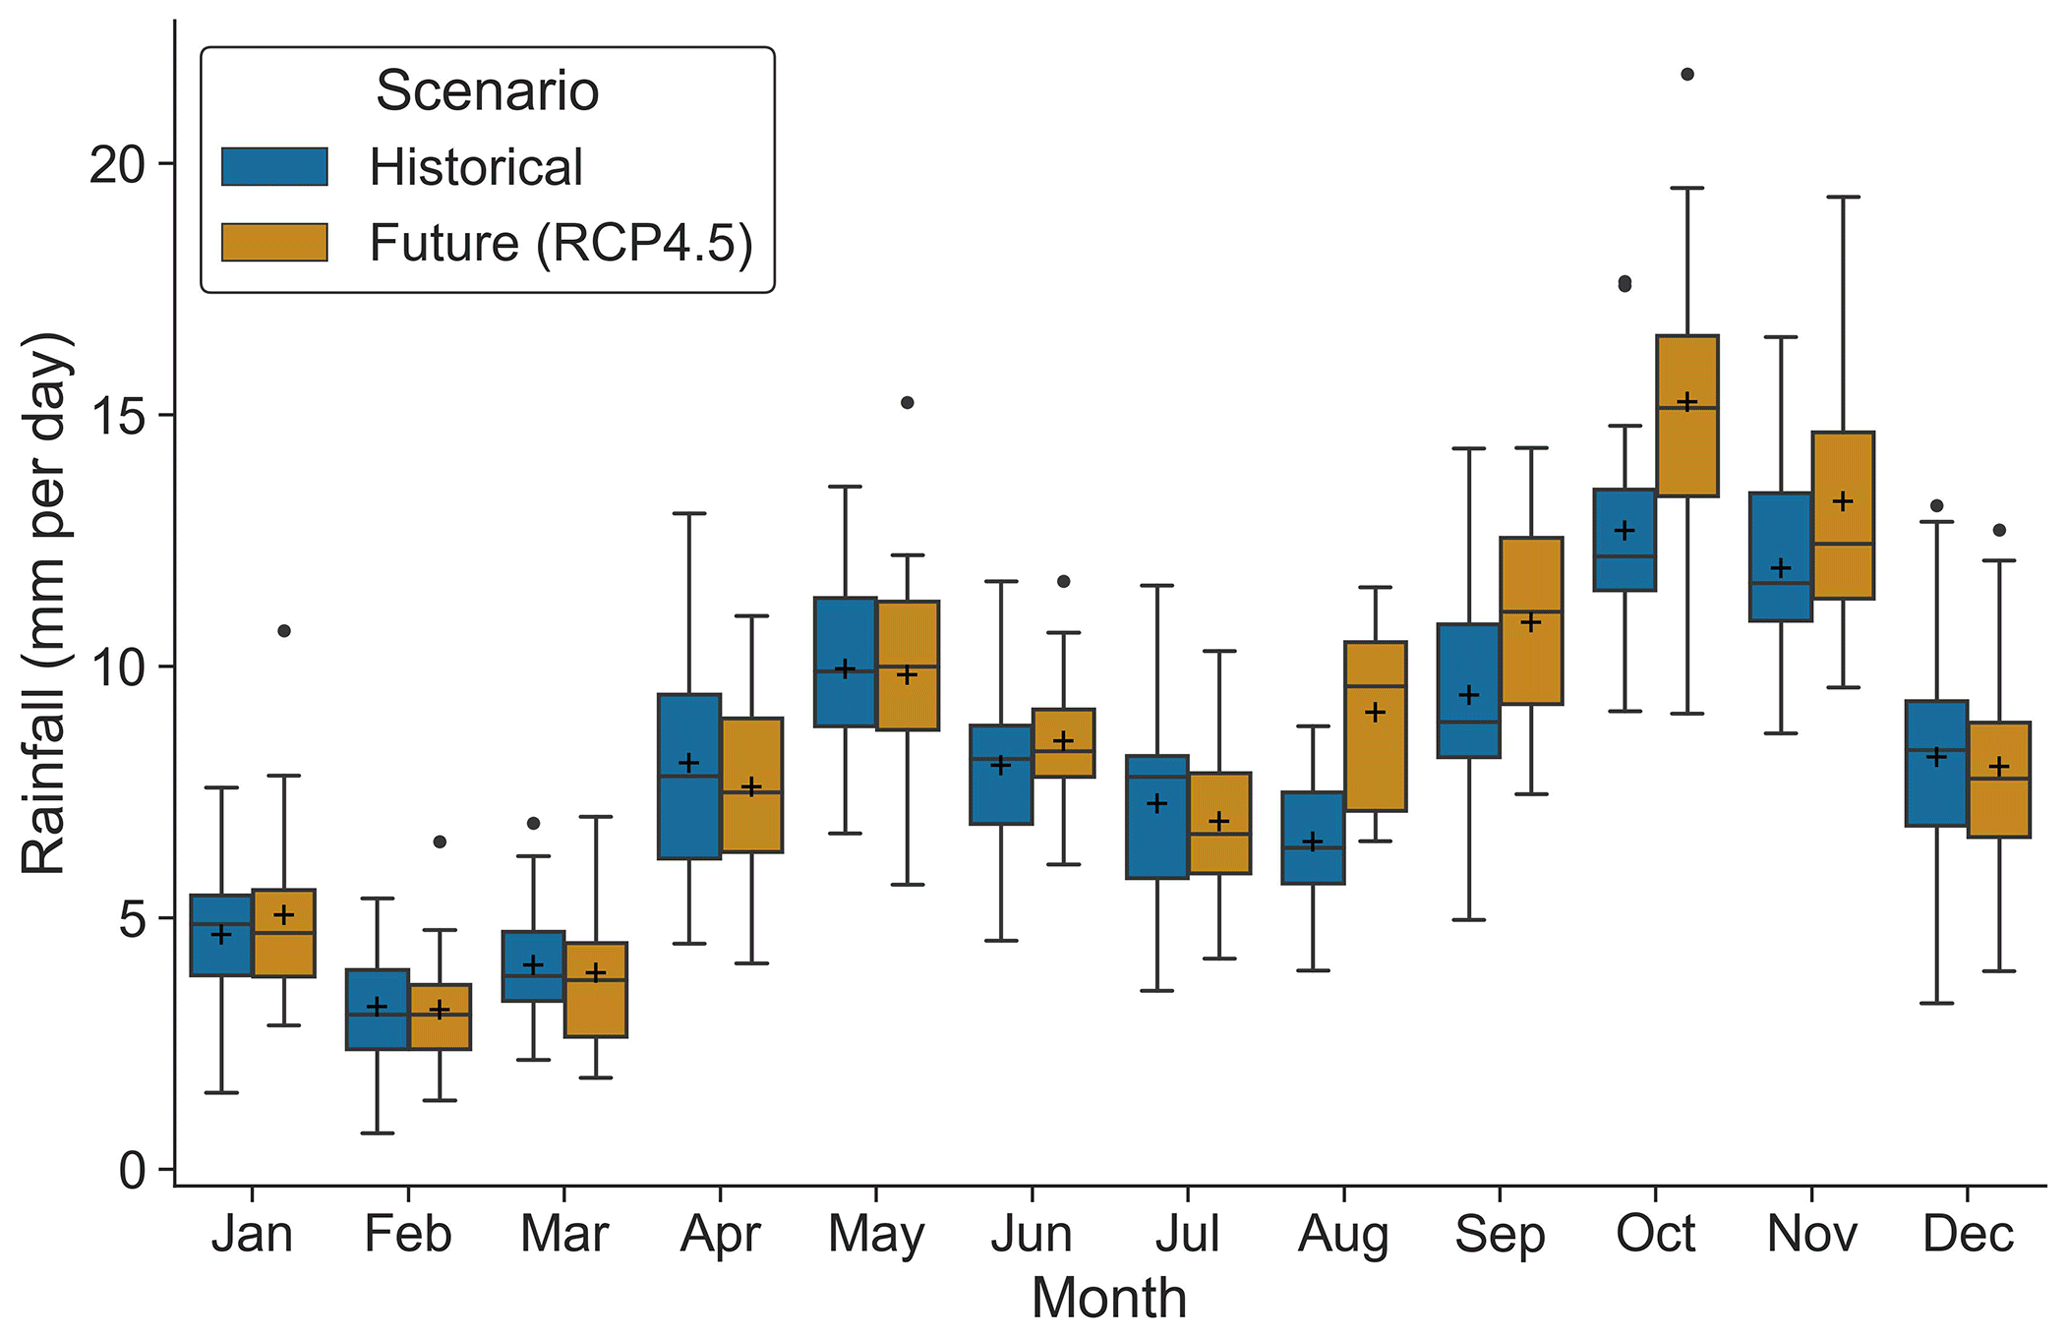
Figure 3Comparison of basin-averaged monthly rainfall projected by the GCM ensemble with historical data. The bottom and top of the box show the first and third quartiles, the “+” indicates the mean, and the flat line inside the box is the median. The whiskers represent the minimum and maximum values. Black dots denote outliers.
3.4 Impacts of climate change on future floods
3.4.1 Impact of climate change on river flow
The intensification of rainfall projected by the GCM ensemble (average of five GCM outputs) will increase high flows (5 % probability of exceedance; Q5) by 16 % at the upstream gauging station and by 5 % at the downstream gauging station, which may exacerbate flooding. Meanwhile, mean annual discharge of the river is projected to decrease by 34 % and 25 % at the downstream and upstream gauging stations, respectively (Fig. 4), which may influence water availability in the basin.

Figure 4Comparison of projected flow duration curves with historical data at the two gauging stations.
3.4.2 Impact of climate change on inundation
The 20-year average of the annual maximum inundated area projected by the GCM ensemble (average of five GCM outputs) for the future was 185.71 km2, representing an increment of 3.5 % compared to the historical average of 180.16 km2. All GCMs except the CESM and CNRM models predicted expansion of the inundated area throughout the basin, whereas the CESM and CNRM models predicted no future expansion of inundated area in the downstream region under the RCP4.5 emission scenario (Fig. 5). Similarly, the 20-year average of the annual maximum inundated area simulated using the rainfall projections from the GCM ensemble for the future was compared with the values simulated under historical climate in the upstream, midstream, and downstream sub-catchments of the basin. The inundated area in the middle and downstream regions is predicted to increase by 2 % and 1 %, respectively, compared to a predicted increase of 14 % in the upstream sub-catchment relative to the past. The difference in the upper sub-catchment may be attributed to the elevated river discharge projected at the upstream gauging station, as well as the steeper slope and narrower river channel (Jayapadma et al., 2022), which could facilitate higher flow velocities and result in greater inundated areas in the upstream sub-catchment.
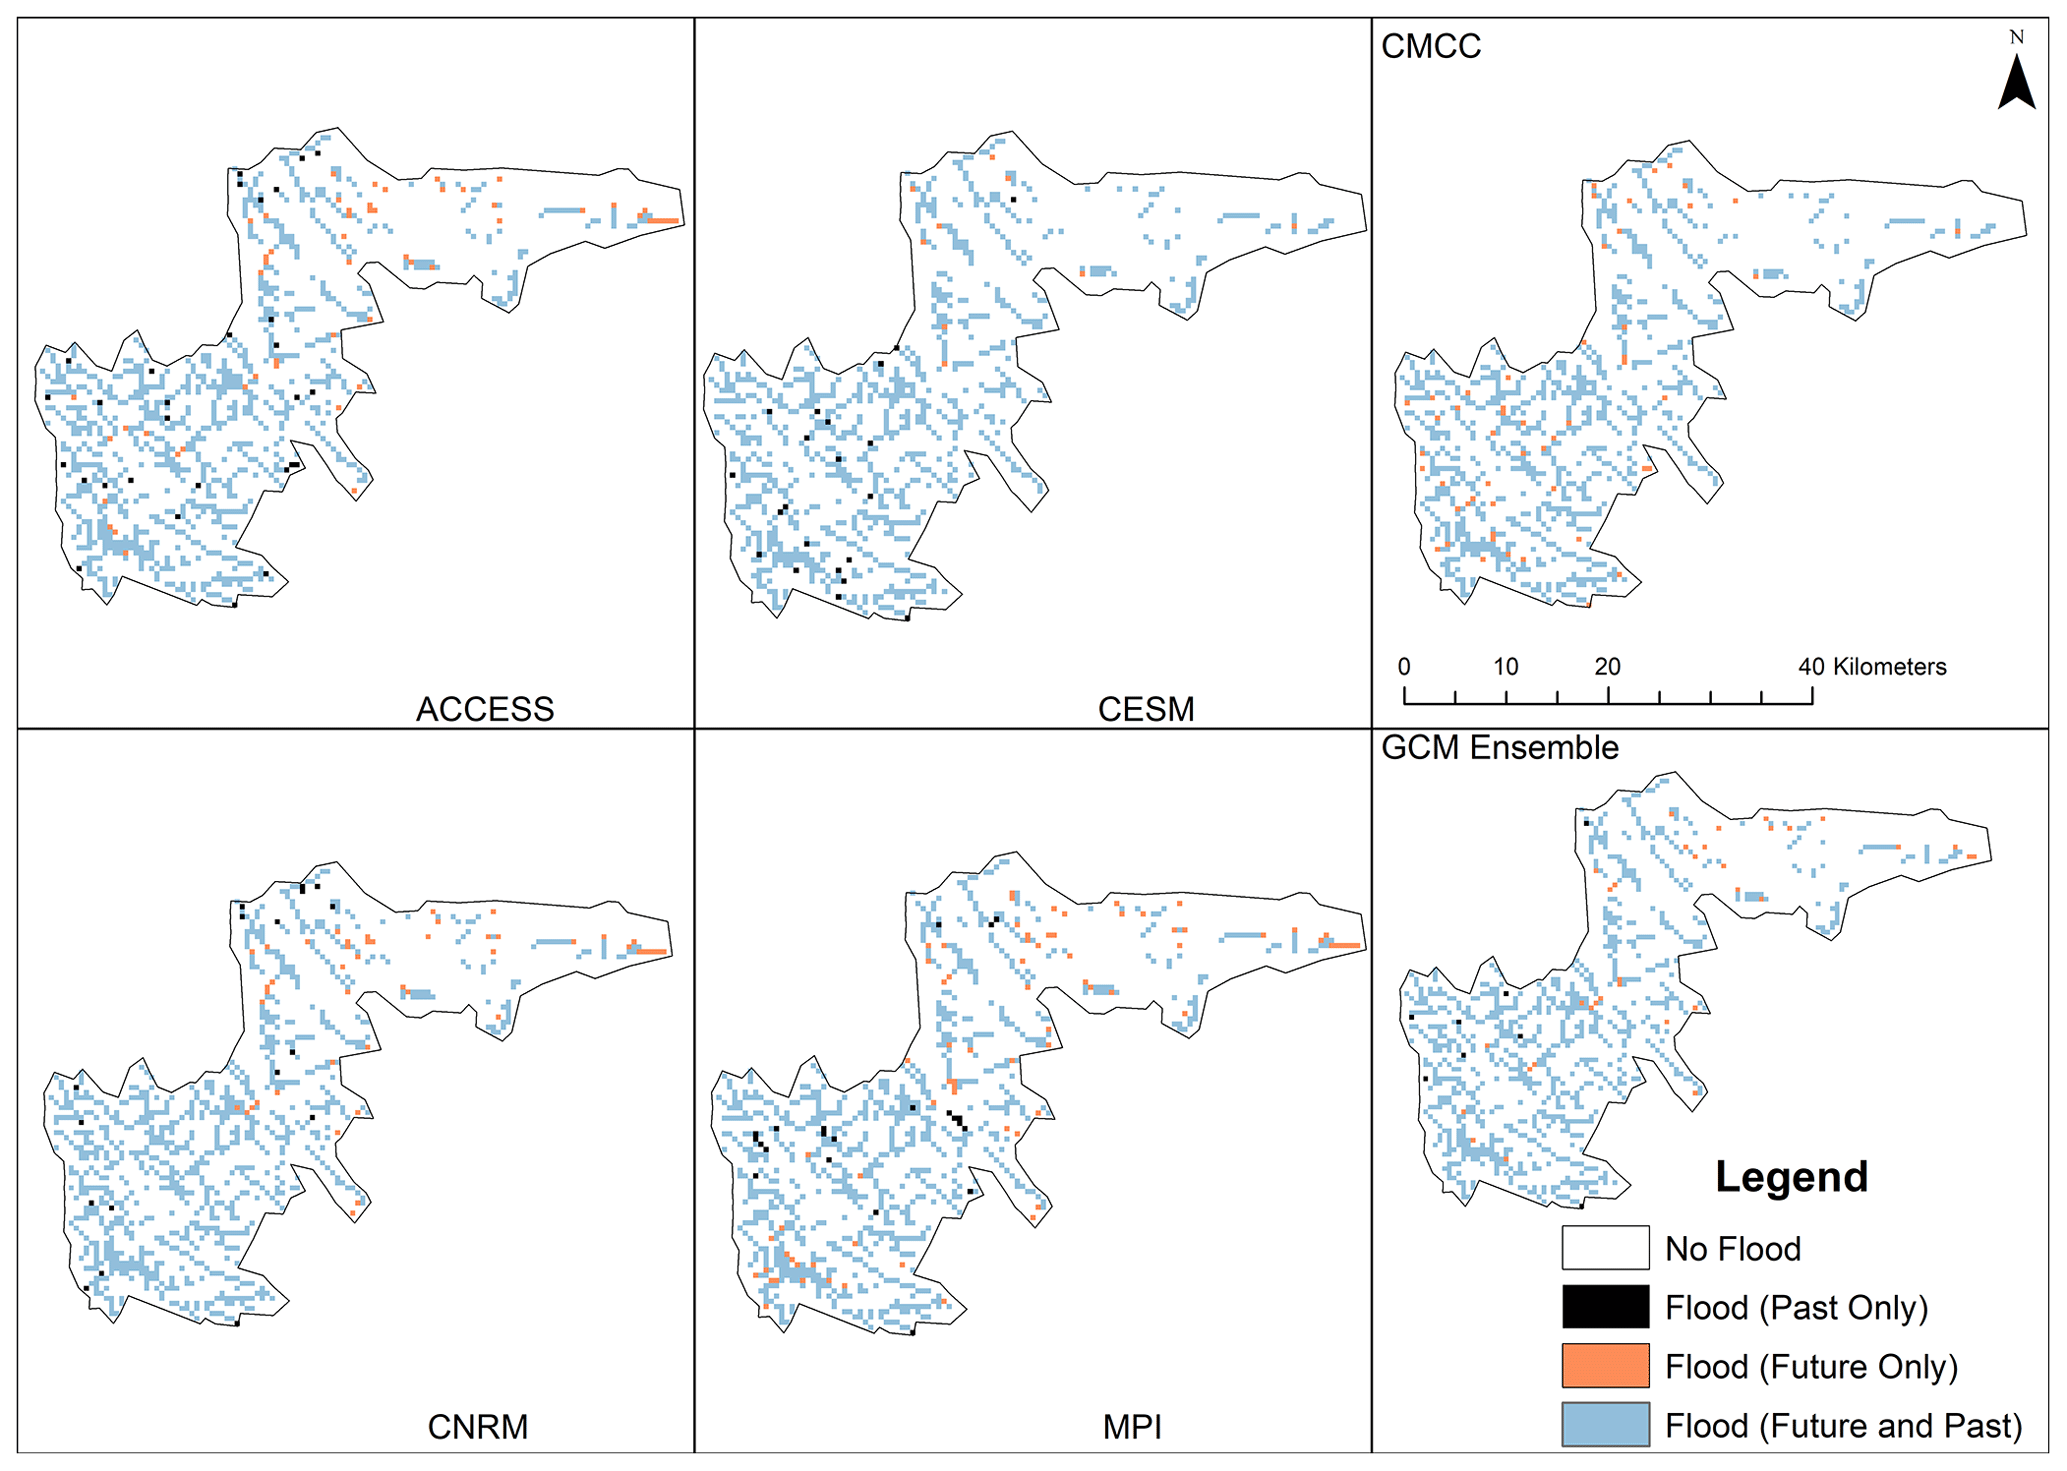
Figure 5Comparison of 20-year average values of annual maximum inundated area. “Flood Past (only)” represents the inundated area simulated exclusively during the period of 1980–2000. The “Flood Future (only)” represents the areas that are projected to flood in the future (2040–2060) but were not in the past. The “Flood (Future and Past)” represents the intersection of flooded areas projected in both the past and the future.
The performance of the calibrated RRI model in the Gin River basin was adequate for continuous long-term simulation and application to climate-change projection. This study revealed that the basin is to receive increased rainfall with greater variability in the months from August to November in the future under the RCP4.5 emission scenario. Additionally, rainfall during the southwest monsoon season (May–September), when the basin historically received the heaviest rainfall, is to intensify further by 9.7 %. The intensified monsoon rainfall projected under the RCP4.5 emission scenario will significantly increase future high flows (16 % upstream, 5 % downstream) as well as the peak inundation extent in the basin by 3.5 %, which requires the attention of stakeholder institutions for effective disaster preparedness. Furthermore, the modeling framework employed in this study can be applied to modeling the impact of climate change in similar river basins.
The study specifically focused on assessing the impact of climate change on floods in the study area. Uncertainties in climate-impact assessments can arise at various stages, including GCM uncertainty, bias correction, and hydrological modeling. A multi-model ensemble was employed to minimize GCM and bias correction uncertainties. Even though this study focused on assessing the impact of climate change on floods, it's crucial to acknowledge that uncertainties in low-flow estimation may have arisen during hydrological modeling, due to factors such as the coarser resolution of topography, rainfall data, and the average approximation of catchment parameters. In addition, evapotranspiration processes were not incorporated directly in our hydrological simulations (RRI) to assess low-flow variations in a warmer climate. Addressing these limitations could enhance the accuracy of low-flow estimations.
Therefore, we recommend that future research directions focus on investigating low-flow impacts, considering evapotranspiration processes directly. In addition, this study could be extended to assess the possible impacts of projected land-use and climate changes under various emission scenarios to generate useful information that will support effective flood risk management.
All raw data can be provided by the corresponding authors upon request.
JMMUJ, KS, HI, JM planned the study. JMMUJ performed simulations and analyzed the data under the supervision of all co-authors. JMMUJ wrote the manuscript draft with contributions from all authors. KS, HI, JM, and TNW reviewed and edited the manuscript.
The contact author has declared that none of the authors has any competing interests.
Publisher’s note: Copernicus Publications remains neutral with regard to jurisdictional claims made in the text, published maps, institutional affiliations, or any other geographical representation in this paper. While Copernicus Publications makes every effort to include appropriate place names, the final responsibility lies with the authors.
This article is part of the special issue “ICFM9 – River Basin Disaster Resilience and Sustainability by All”. It is a result of The 9th International Conference on Flood Management, Tsukuba, Japan, 18–22 February 2023.
This research has been supported by the Japan Society for the Promotion of Science (grant nos. JP19H02246 and JP19H01378), the Nagoya University (High Performance Computing Research Project for Joint Computational Science), and the Ministry of Education, Culture, Sports, Science and Technology (HPCI System Research Project (Project ID: hp210291)).
This paper was edited by Tomoki Ushiyama and reviewed by two anonymous referees.
Adler, R. F., Huffman, G. J., Chang, A., Ferraro, R., Xie, P. P., Janowiak, J., Rudolf, B., Schneider, U., Curtis, S., Bolvin, D., Gruber, A., Susskind, J., Arkin, P., and Nelkin, E.: The version-2 global precipitation climatology project (GPCP) monthly precipitation analysis (1979–present), J. Hydrometeorol., 4, 1147–1167, https://doi.org/10.1175/1525-7541(2003)004<1147:TVGPCP>2.0.CO;2, 2003.
Bastola, S., Murphy, C., and Sweeney, J.: The role of hydrological modelling uncertainties in climate change impact assessments of Irish river catchments, Adv. Water Resour., 34, 562–576, https://doi.org/10.1016/j.advwatres.2011.01.008, 2011.
Bi, D., Dix, M., Marsland, S. J., O'Farrell, S., Rashid, H. A., Uotila, P., Hirst, A. C., Kowalczyk, E., Golebiewski, M., Sullivan, A., Yan, H., Hannah, N., Franklin, C., Sun, Z., Vohralik, P., Watterson, I., Zhou, X., Fiedler, R., Collier, M., Ma, Y., Noonan, J., Stevens, L., Uhe, P., Zhu, H., Griffies, S. M., Hill, R., Harris, C., and Puri, K.: The ACCESS coupled model: Description, control climate and evaluation, Aust. Meteorol. Oceanogr. J., 63, 41–64, https://doi.org/10.22499/2.6301.004, 2013.
Copernicus Climate Change Service (CDS): CMIP5 monthly data on single levels, Copernicus Climate Change Service (CDS) [data set], https://doi.org/10.24381/cds.9d44a987, 2018.
Copernicus Climate Change Service (CDS): Land cover classification gridded maps from 1992 to present derived from satellite observation. Copernicus Climate Change Service (C3S) Climate Data Store (CDS) [data set], https://doi.org/10.24381/cds.006f2c9a, 2019.
Giorgetta, M. A., Jungclaus, J., Reick, C. H., Legutke, S., Bader, J., Böttinger, M., Brovkin, V., Crueger, T., Esch, M., Fieg, K., Glushak, K., Gayler, V., Haak, H., Hollweg, H.-D., Ilyina, T., Kinne, S., Kornblueh, L., Matei, D., Mauritsen, T., Mikolajewicz, U., Mueller, W., Notz, D., Pithan, F., Raddatz, T., Rast, S., Redler, R., Roeckner, E., Schmidt, H., Schnur, R., Segschneider, J., Six, K. D., Stockhause, M., Timmreck, C., Wegner, J., Widmann, H., Wieners, K.-H., Claussen, M., Marotzke, J., and Stevens, B.: Climate and carbon cycle changes from 1850 to 2100 in MPI-ESM simulations for the Coupled Model Intercomparison Project phase 5, J. Adv. Model. Earth Syst., 5, 572–597, https://doi.org/10.1002/jame.20038, 2013.
IPCC: Climate Change 2013 – The Physical Science Basis, Cambridge University Press, Cambridge, 1535 pp., https://doi.org/10.1017/CBO9781107415324, 2014.
IPCC: Summary for Policymakers, in: Climate Change 2021 – The Physical Science Basis, Cambridge University Press, 3–32, https://doi.org/10.1017/9781009157896.001, 2023.
Jayapadma, J. M. M. U., Souma, K., Ishidaira, H., Magome, J., and Wickramaarachchi, T. N.: The Effect of Incorporation of Embankment Information for Flood Simulation of the Gin River, Sri Lanka, J. Disaster Res., 17, 475–486, https://doi.org/10.20965/jdr.2022.p0475, 2022.
Kawasaki, A., Yamamoto, A., Koudelova, P., Acierto, R., Nemoto, T., Kitsuregawa, M., and Koike, T.: Data Integration and Analysis System (DIAS) Contributing to Climate Change Analysis and Disaster Risk Reduction, Data Sci. J., 16, 41, https://doi.org/10.5334/dsj-2017-041, 2017.
Kreibich, H., Di Baldassarre, G., Vorogushyn, S., Aerts, J. C. J. H., Apel, H., Aronica, G. T., Arnbjerg-Nielsen, K., Bouwer, L. M., Bubeck, P., Caloiero, T., Chinh, D. T., Cortès, M., Gain, A. K., Giampá, V., Kuhlicke, C., Kundzewicz, Z. W., Llasat, M. C., Mård, J., Matczak, P., Mazzoleni, M., Molinari, D., Dung, N. V., Petrucci, O., Schröter, K., Slager, K., Thieken, A. H., Ward, P. J., and Merz, B.: Adaptation to flood risk: Results of international paired flood event studies, Earth's Future, 5, 953–965, https://doi.org/10.1002/2017EF000606, 2017.
Lee, S., Qi, J., McCarty, G. W., Yeo, I. Y., Zhang, X., Moglen, G. E., and Du, L.: Uncertainty assessment of multi-parameter, multi-GCM, and multi-RCP simulations for streamflow and non-floodplain wetland (NFW) water storage, J. Hydrol., 600, 126564, https://doi.org/10.1016/j.jhydrol.2021.126564, 2021.
Lehner, B., Verdin, K., and Jarvis, A.: New global hydrography derived from spaceborne elevation data, Eos, Trans. AGU, 89, 93–94, https://doi.org/10.1029/2008EO100001, 2008.
Liebmann, B. and Smith, C. A.: A description of a complete (interpoled) outgoing longwave radiation dataset., B. Am. Meteorol. Soc., 77, 1275–1277, 1996.
Neale, R. B., Chen, C.-C., Gettelman, A., Lauritzen, P. H., Park, S., Williamson, D. L., Conley, A. J., Garcia, R., Kinnison, D., Lamarque, J.-F., Marsh, D., Mills, M., Smith, A. K., Tilmes, S., Vitt, F., Morrison, H., Cameron-Smith, P., Collins, W. D., Iacono, M. J., Easter, R. C., Ghan, S. J., Liu, X., Rasch, P. J., and Taylor, M. A.: Community Atmosphere Model 5.0 (CAM5) – Scientific Description, https://ncar.github.io/CAM/doc/build/html/cam5_scientific_guide/index.html (last access: 9 June 2022), 2012.
Nijssen, B., O'donnell, G. M., Hamlet, A. F., and Lettenmaier, D. P.: Hydrologic sensitivity of global rivers to climate change, Climatic Change, 50, 143–175, https://doi.org/10.1023/A:1010616428763, 2001.
Nyunt, C. T., Koike, T., and Yamamoto, A.: Statistical bias correction for climate change impact on the basin scale precipitation in Sri Lanka, Philippines, Japan and Tunisia, Hydrol. Earth Syst. Sci. Discuss. [preprint], https://doi.org/10.5194/hess-2016-14, 2016.
Onogi, K., Tsutsui, J., Koide, H., Sakamoto, M., Kobayashi, S., Hatsushika, H., Matsumoto, T., Yamazaki, N., Kamahori, H., Takahashi, K., Kadokura, S., Wada, K., Kato, K., Oyama, R., Ose, T., Mannoji, N., and Taira, R.: The JRA-25 reanalysis, J. Meteorol. Soc. Japan, 85, 369–432, https://doi.org/10.2151/jmsj.85.369, 2007.
Rayner, N. A., Parker, D. E., Horton, E. B., Folland, C. K., Alexander, L. V., Rowell, D. P., Kent, E. C., and Kaplan, A.: Global analyses of sea surface temperature, sea ice, and night marine air temperature since the late nineteenth century, J. Geophys. Res. Atmos., 108, 4407, https://doi.org/10.1029/2002jd002670, 2003.
Rodell, M., Houser, P. R., Jambor, U., Gottschalck, J., Mitchell, K., Meng, C.-J., Arsenault, K., Cosgrove, B., Radakovich, J., Bosilovich, M., Entin, J. K., Walker, J. P., Lohmann, D., and Toll, D.: The Global Land Data Assimilation System, B. Am. Meteorol. Soc., 85, 381–394, https://doi.org/10.1175/BAMS-85-3-381, 2004.
Rogelj, J., den Elzen, M., Höhne, N., Fransen, T., Fekete, H., Winkler, H., Schaeffer, R., Sha, F., Riahi, K., and Meinshausen, M.: Paris Agreement climate proposals need a boost to keep warming well below 2 °C, Nature, 534, 631–639, https://doi.org/10.1038/nature18307, 2016.
Sayama, T., Ozawa, G., Kawakami, T., Nabesaka, S., and Fukami, K.: Analyse pluie-débit-inondation de la crue de 2010 au Pakistan dans le bassin de la rivière Kaboul, Hydrol. Sci. J., 57, 298–312, https://doi.org/10.1080/02626667.2011.644245, 2012.
Scoccimarro, E., Gualdi, S., Bellucci, A., Sanna, A., Fogli, P. G., Manzini, E., Vichi, M., Oddo, P., and Navarra, A.: Effects of tropical cyclones on ocean heat transport in a high-resolution coupled general circulation model, J. Climate, 24, 4368–4384, https://doi.org/10.1175/2011JCLI4104.1, 2011.
Taylor, K. E., Stouffer, R. J., and Meehl, G. A.: An overview of CMIP5 and the experiment design, B. Am. Meteorol. Soc., 93, 485–498, https://doi.org/10.1175/BAMS-D-11-00094.1, 2012.
Voldoire, A., Sanchez-Gomez, E., Salas y Mélia, D., Decharme, B., Cassou, C., Sénési, S., Valcke, S., Beau, I., Alias, A., Chevallier, M., Déqué, M., Deshayes, J., Douville, H., Fernandez, E., Madec, G., Maisonnave, E., Moine, M. P., Planton, S., Saint-Martin, D., Szopa, S., Tyteca, S., Alkama, R., Belamari, S., Braun, A., Coquart, L., and Chauvin, F.: The CNRM-CM5.1 global climate model: Description and basic evaluation, Clim. Dynam., 40, 2091–2121, https://doi.org/10.1007/s00382-011-1259-y, 2013.
Winsemius, H. C., Aerts, J. C. J. H., van Beek, L. P. H., Bierkens, M. F. P., Bouwman, A., Jongman, B., Kwadijk, J. C. J., Ligtvoet, W., Lucas, P. L., van Vuuren, D. P., and Ward, P. J.: Global drivers of future river flood risk, Nat. Clim. Change, 6, 381–385, https://doi.org/10.1038/nclimate2893, 2016.
Yatagai, A., Kamiguchi, K., Arakawa, O., Hamada, A., Yasutomi, N., and Kitoh, A.: APHRODITE: Constructing a Long-Term Daily Gridded Precipitation Dataset for Asia Based on a Dense Network of Rain Gauges, B. Am. Meteorol. Soc., 93, 1401–1415, https://doi.org/10.1175/BAMS-D-11-00122.1, 2012.
Zhang, H., Huang, G. H., Wang, D., and Zhang, X.: Uncertainty assessment of climate change impacts on the hydrology of small prairie wetlands, J. Hydrol., 396, 94–103, https://doi.org/10.1016/j.jhydrol.2010.10.037, 2011.