the Creative Commons Attribution 4.0 License.
the Creative Commons Attribution 4.0 License.
 | 15 Jul 2024
Assessment of flood risk in a coastal city considering multiple socio-economic vulnerability scenarios
Mousumi Ghosh
Subimal Ghosh
Subhankar Karmakar
The Intergovernmental Panel on Climate Change stresses the importance of vulnerability and exposure along with hazard in defining flood risk. Therefore, a novel approach for flood risk quantification is proposed that evaluates the impact of various realistic socio-economic scenarios on risk reduction. The flood hazard is derived from a hydrodynamic flood modelling framework over Mumbai, India's highly flood-prone coastal megacity. The socio-economic vulnerability is assessed by a multivariate approach based on principal component analysis and data envelopment analysis. Finally, the flood risk is quantified and mapped by aggregating hazard and vulnerability for different socio-economic scenarios, also key indicators contributing to a significant reduction in vulnerability and risk are identified. This non-structural long-term flood risk management approach will benefit densely populated urban areas, especially in developing, and underdeveloped countries.
- Article
(1991 KB) - Full-text XML
- BibTeX
- EndNote


The assessment of flood risks is the most critical non-structural flood management strategy that requires global attention and is of utmost importance; Civic bodies, decision-makers, and the society alike have found it imperative (Shao et al., 2016). Flood risk primarily consists of two major components, flood hazard (H) and flood vulnerability (V), and is characterized in an univariate representation as a combination of both factors (Karmakar et al., 2010) i.e., a product of H and V. In other words, it evaluates the likelihood of flooding, and the degree of risk is principally characterised in terms of probability of occurrence (Kron, 2005), depth, velocity or combination of both and residence time of flood water. However, very less importance has been given to socio-economic vulnerability in the previous studies in terms of flood risk mapping. It has become important to recognize the significance of socioeconomic aspects of vulnerability, since floods bring substantial losses in society like death of family member, loss of temporary or permanent jobs, destruction of property, while concurrently quantifying the flood damage in terms of hazard. In these lines, this study aims to develop a comprehensive vulnerability mapping framework addressing the socio-economic aspects, by utilising a nonparametric data envelopment analysis (DEA). Simultaneously, a severe flood hotspot of Mumbai, the Mithi catchment, is considered to assess the overall changes in flood risk maps, an amalgamation of flood hazard (developed with a hydrodynamic flood modelling framework) and vulnerability maps, under various socio-economic scenarios.
Mumbai, one of the most crowded cities in India with a population of around 12 million as per the most recent Census of India 2011 data and has now increased to around 20 million (Ghosh et al., 2021b), is the focus of this study. The average population density of 20 000 per km2; where more than half of the population resides in slums (Census of India, 2011). As the city grew, many areas were reclaimed to meet the demand for space. Originally, the city was made up of a cluster of islands. This has led to its inherent vulnerability to floods especially in the low-lying regions at or below mean sea level. The city primarily comprises of two revenue districts under the Municipal Corporation of Greater Mumbai (MCGM) – Mumbai city district (67.79 km2) and Mumbai Suburban district (370 km2). These are further divided into six zones, each consists of three to five wards – accounting to a total of twenty-four wards alphabetically named by MCGM. There are nine wards in Mumbai city district and fifteen wards in Mumbai suburban district. The city has been further divided into eighty-eight sections for vulnerability assessment in this study to efficiently manage the city's huge human population. As fine resolution DEM data are available for the flood-prone Mithi catchment of Mumbai, the hazard assessment was conducted over this catchment.
2.1 Vulnerability Assessment
The social and socioeconomic theme is considered for vulnerability assessment by utilising an indicator-based approach using the framework described by Sherly et al. (2015) (Fig. 1). A list of indicators representing socio-economic conditions were selected and categorised into positive (increasing vulnerability) and negative indicators (decreasing vulnerability) categories based on a comprehensive literature review. Since units of different indicators vary, an initial standardisation process was conducted as per the Eq. (1):
where, is the standardised vulnerability = of the ith section/grid; and are the maximum and minimum counts of vulnerability indicator respectively; and Vi is the count pertaining to the ith grid. After the identification of vulnerability indicators in each of these grids, data envelopment analysis (DEA) is performed to give an optimal weight for each indicator from which the vulnerability is quantified (Van Rossum and Drake, 1995). Further to decorrelate the higher correlated data sets, increase explicability, and computational efficiency, principal component analysis (PCA) is performed (Jolliffe, 2002). The PCA aids to decrease the sensitivity to overfitting in DEA, by reduction of dimensions of the problem, i.e., the 11 socio-economic indicator values obtained for all the grid points over the spatial domain. The indicators are linearly transformed to orthogonal variables in order of explanation of variance known as principal components (PCs). A considerable variance is explained by the PCs with higher eigenvalues which reduces the dimension of the dataset.
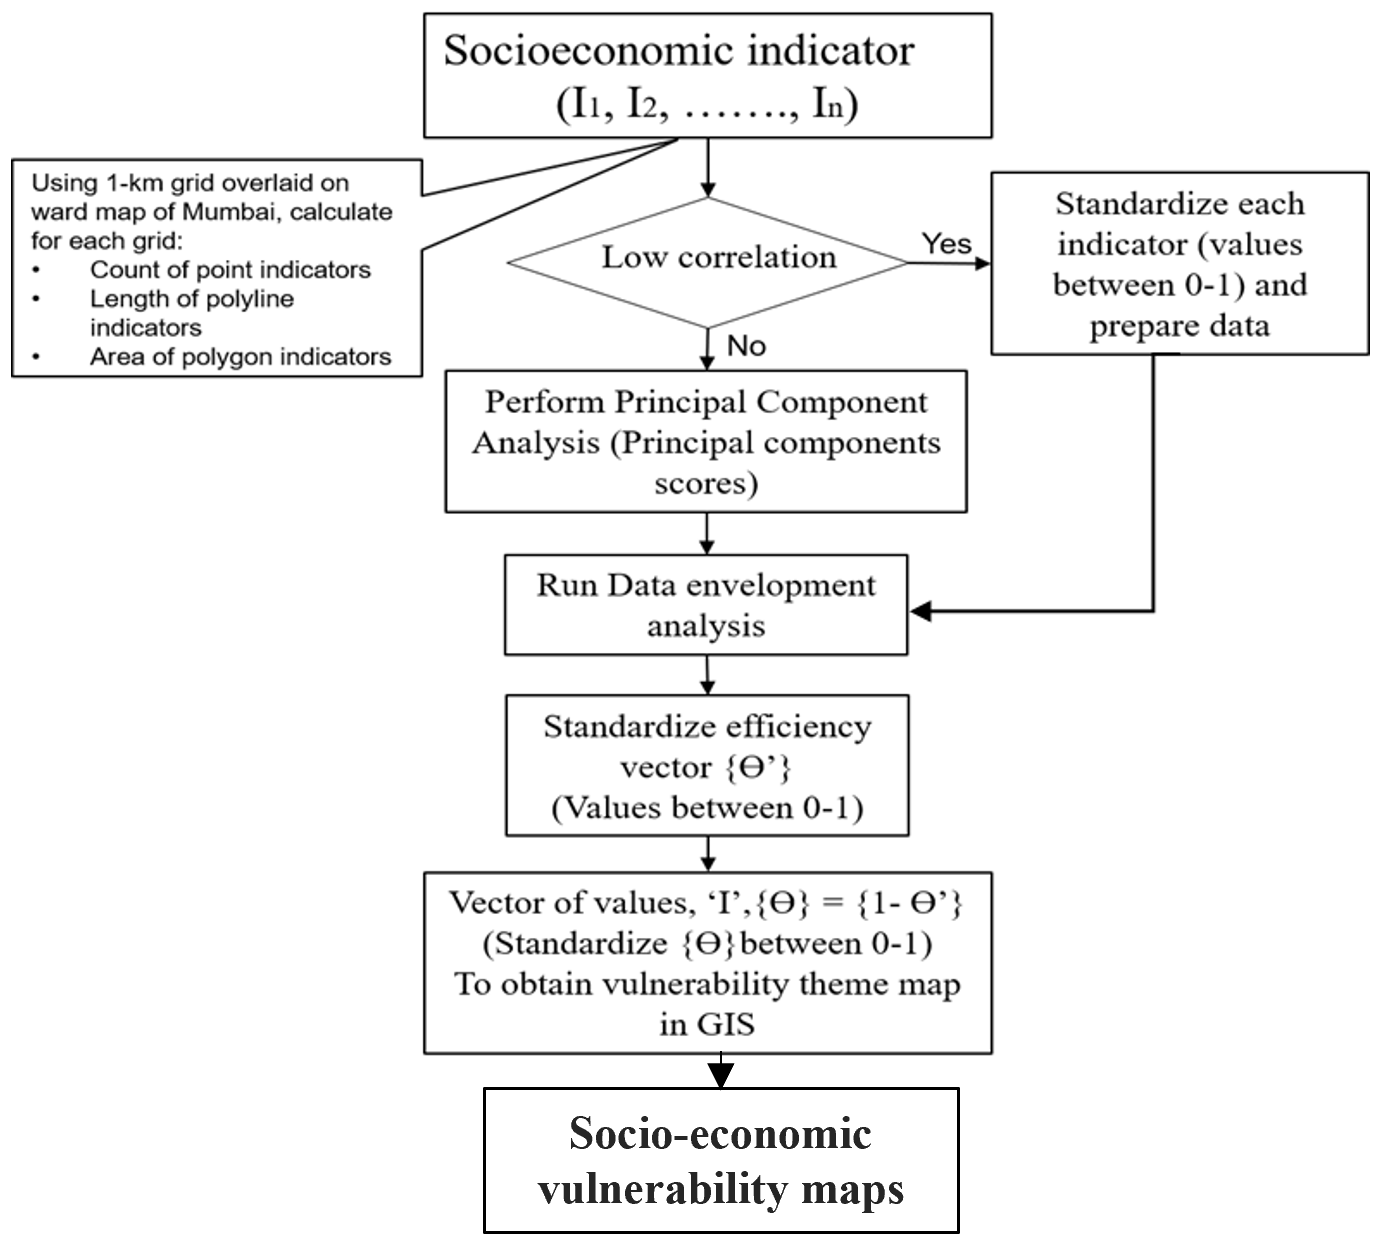
Figure 1Proposed framework of indicator-based quantitative spatial socio-economic vulnerability assessment.
DEA is a method for estimating the relative efficiency of units that are called decision making units (DMU), when it is difficult to identify absolute measures of efficiency. Here each grid or spatial unit may be considered to be a DMU. This non-parametric technique makes no assumptions about the form of the function. It is a non-stochastic approach in which all observations are treated as deterministic. The DEA aims to evaluate how well the DMUs are performing using a data-oriented approach, which communicates multiple inputs into multiple outputs, based on a data-driven nonparametric approach. Unlike other methods, it doesn't require expert elicitation to determine how to assign weightages to various vulnerability indicators (Cooper et al., 2011). The efficiency of each DMU is measured by the distance of its input output vectors to a piece wise linear frontier.
In DEA model, each DMU converts inputs to outputs. The DEA model optimises each observation with the objective of calculating a discrete piecewise frontier determined by the set of Pareto efficient DMUs. The number of DMUs must be no less than the number of inputs and outputs, and the variables must have low correlation, otherwise, the capacity of the DEA model to calculate the efficiency will be reduced.
In this study, the slack based input-oriented BCC model which considers variable returns to scale (VRS) was adopted, given by:
where p is the grid being evaluated; θ (0 < θ≤1) is the technical efficiency of the grid; yrj is the amount of output r provided by grid j, xij is the amount of input I used by grid j; λj is the weight assigned to grid j; and are the slack and remnant variable respectively; and ϵ is the non-Archimedean infinitesimal, generally taking ϵ=10−6. Following this, the DMU's technical efficiency, θ, are utilised to get the respective vulnerabilities which is calculated as which differs between 0–1, here 0 is the minimum and 1 is the maximum values of vulnerability.
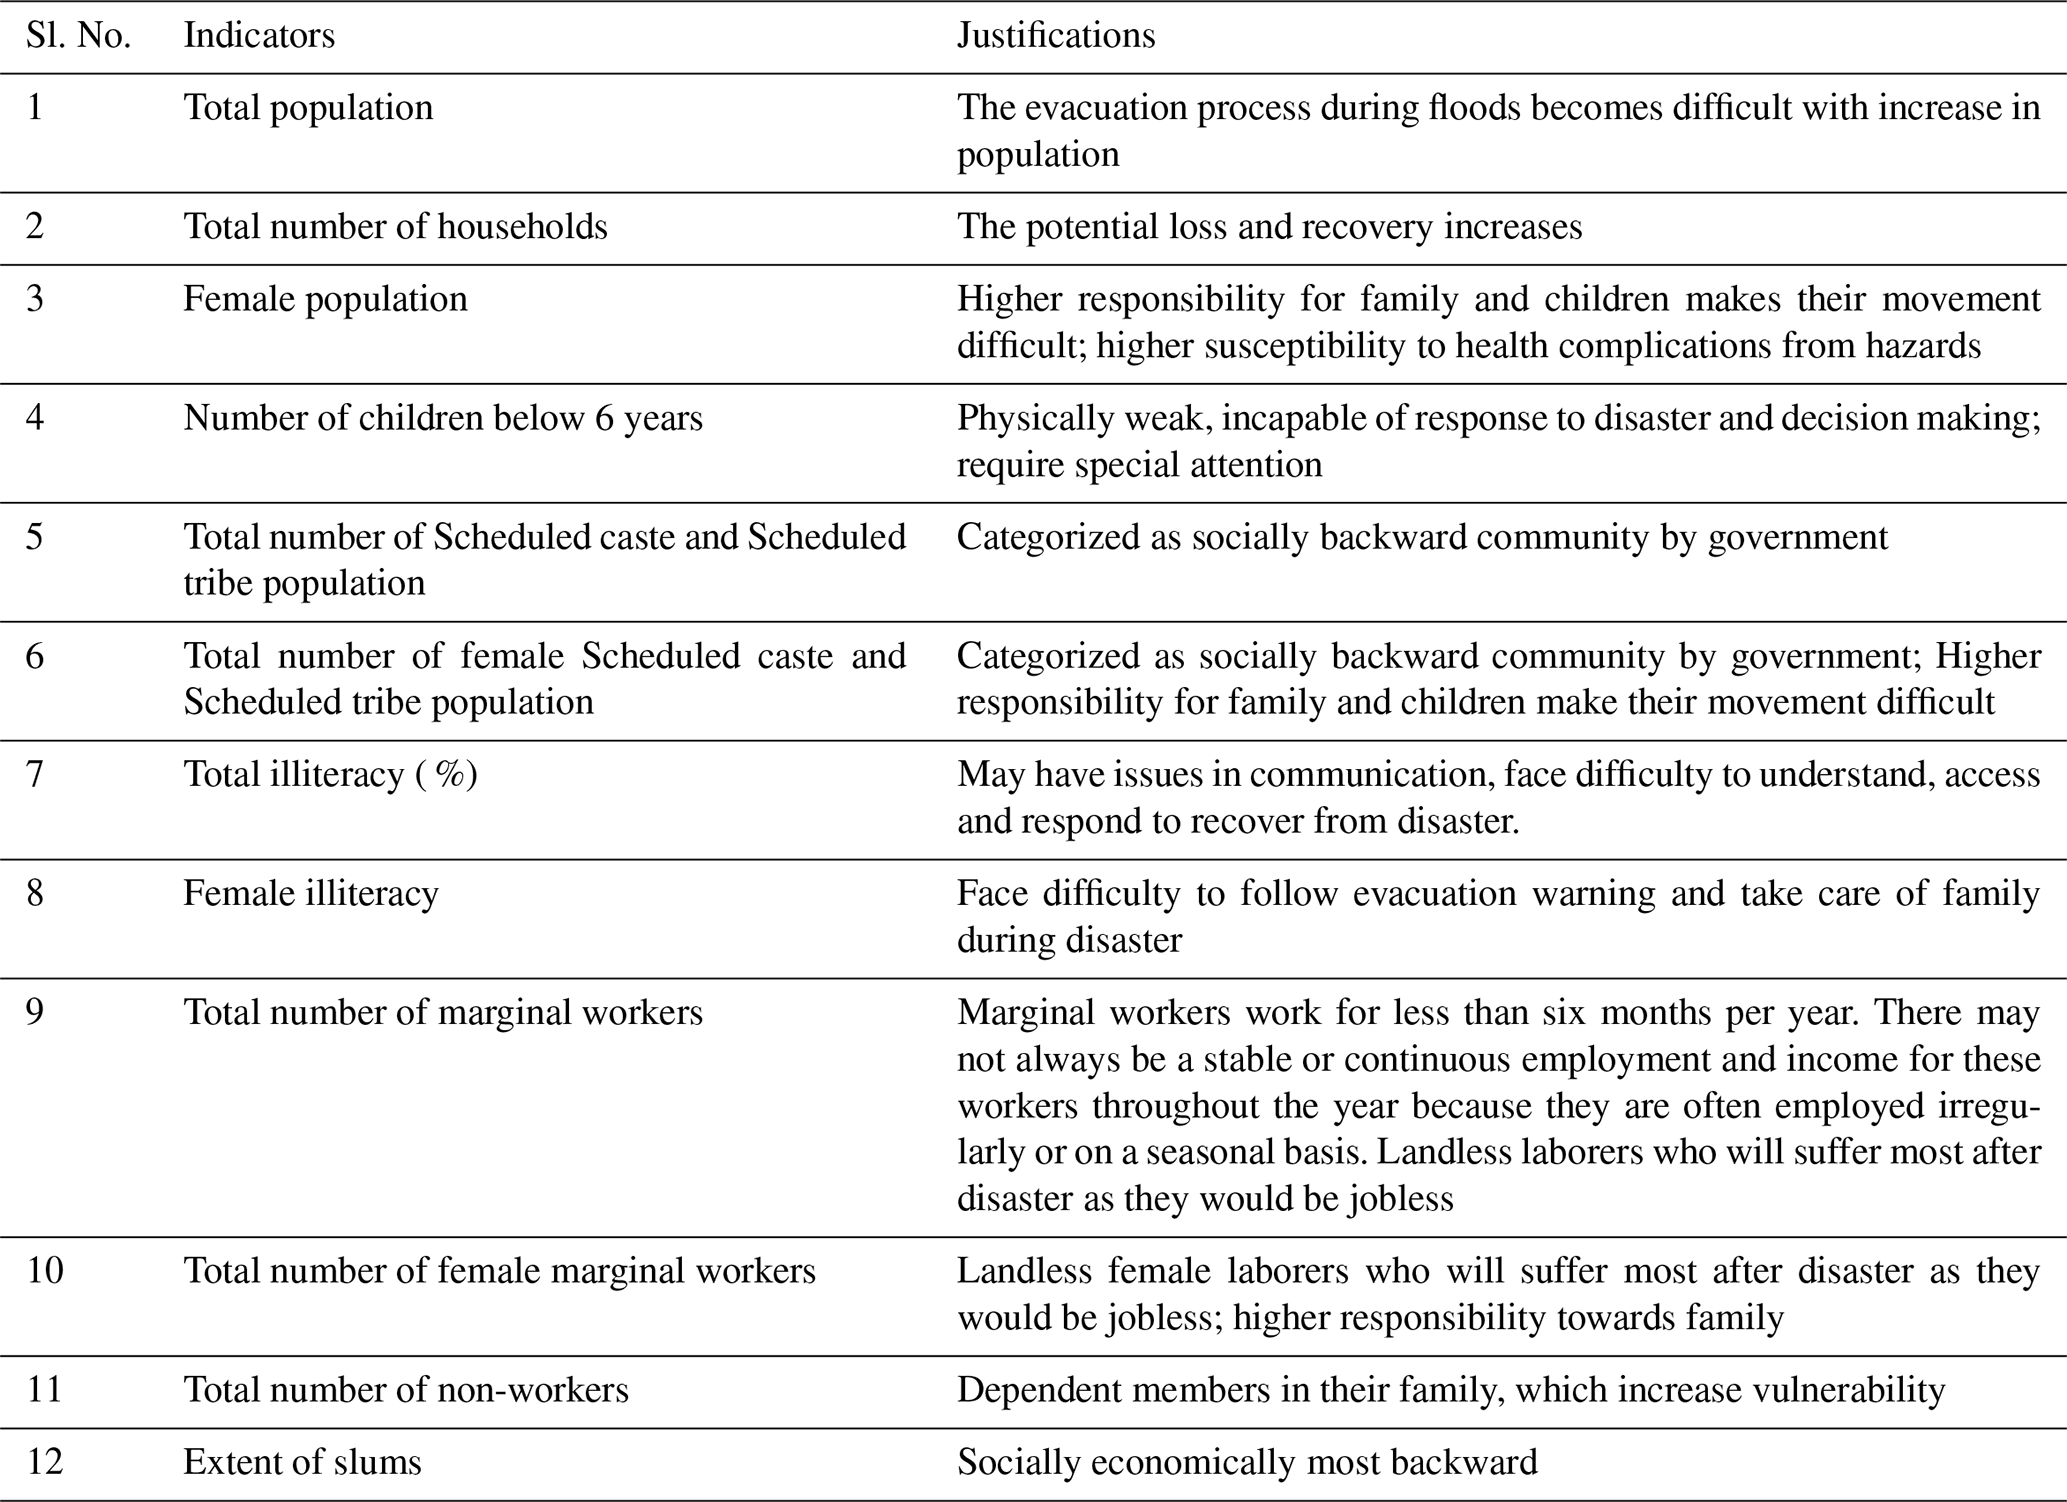
The vulnerability indicators chosen should be appropriately representative, relevant, justifiable and feasible with respect to the system (European Environment Agency, 2005; Vittal et al., 2020). The numerical data required for the development of social and economic indicators for the study are collected from Municipal Corporation of Greater Mumbai MCGM, Google Earth, and the Census of India (2001, 2011). The census data are available at the section level. The set of indicators considered are enumerated in Table 1.
Several efforts have been taken towards flood risk management by adapting strategies for reduction of flood hazard. However, the implementation of measures to reduce the vulnerability of a population to flood which may be beneficial in reduction of flood risk has been less discussed in literature. This can be an effective long-term measure for alleviation of flood risk. The non-working and illiterate section in the society especially female population are affected the most during a heavy flooding event. Hence taking measures towards reduction of their vulnerability to floods by educating them and providing them employment may help in reduction of flood risk and overall upliftment of society. In these lines, for the current study, vulnerability assessment is performed considering these 11 socio-economic indicators for five different socio-economic scenarios to identify the key indicators which contribute to a significant change in vulnerability. Certain sections considered to examine the reduction in vulnerability in response to the change in values of indicators based on the feasibility of change in indicators. The scenarios considered are as follows:
-
2001 – Baseline scenario
-
2011 – Baseline scenario
-
2011 – Total reduction in the number of non-workers by 10 %.
-
2011 – Total increase in female literacy by 10 %.
-
2011 – Total increase in total literacy by 10 %.
Table 1List of social and socio-economic vulnerability indicators considered in the study.
The vulnerability maps are derived for these scenarios following the framework given in Fig. 3 in GIS interface and are compared to identify the key indicator responsible for the reduction in vulnerability.
2.2 Hazard Assessment
A flood hazard is a measure of the likelihood that a flood will occur at a specific location and time, and is represented as flood inundation depth, velocity, extent, onset, critical response time to certain depth of flooding, and other characteristics in previous studies (Ghosh et al., 2023; Mohanty et al., 2020; Russo et al., 2013). In the present study a framework is developed for flood modelling through a 3-way coupled approach for the Mithi catchment to estimate the flood hazard as illustrated in Fig. 2.
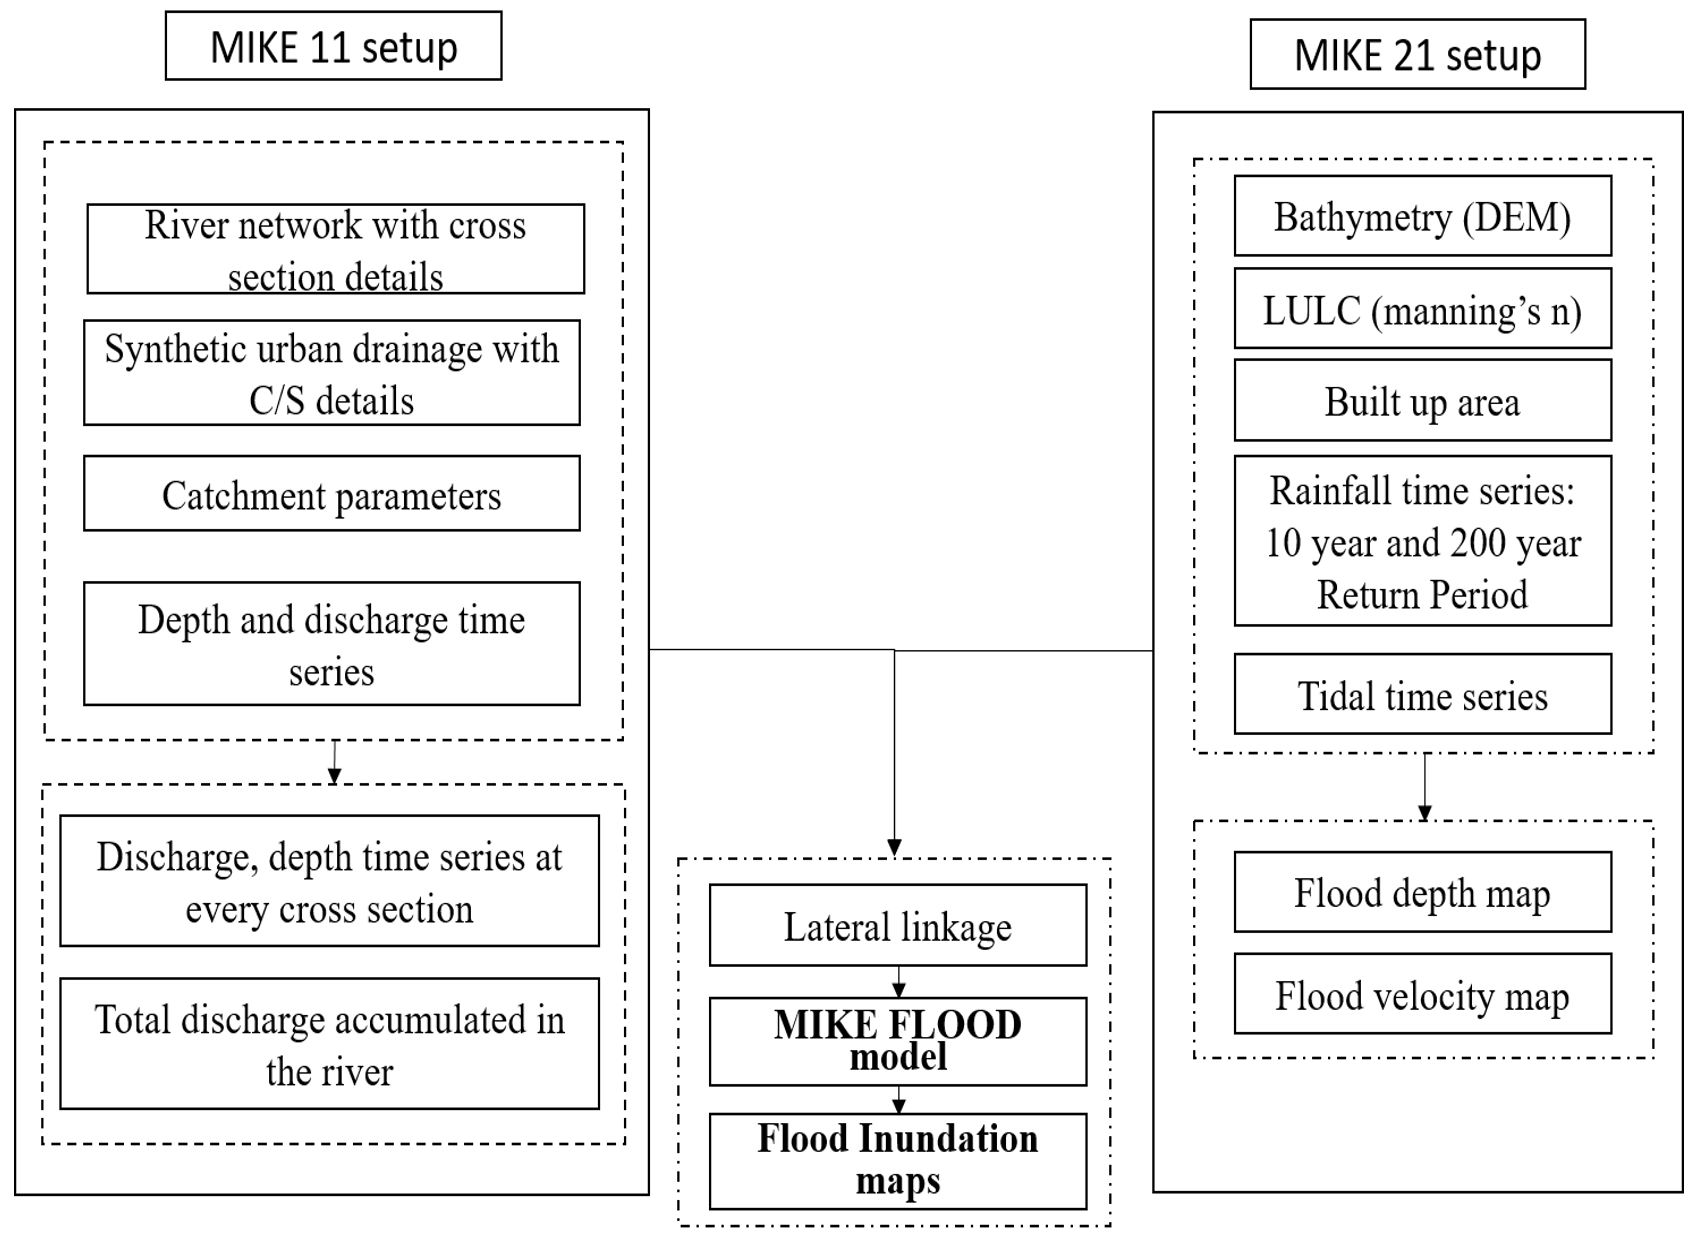
Figure 2Proposed framework of indicator-based quantitative spatial socio-economic vulnerability assessment.
The MIKE 11 model with drainage network has been coupled with the MIKE 21 model in MIKE FLOOD (Danish Hydraulic Institute (DHI), 2020) for the Mithi catchment and flood inundation scenarios have been generated for 10 and 100 years return periods of rainfall (India Meteorological Department, 2023), discharge, and tidal elevation data (Indian National Centre for Ocean Information Services, 2023), the major influencers of flooding. Both the models are individually setup and then MIKE 11 along with stormwater drainage network along with MIKE 21 are linked in MIKE FLOOD as represented in Fig. 2. A detailed illustration for the holistic hydrodynamic framework can be found in Ghosh et al. (2021a). The momentum and continuity equations are solved in the MIKE 11 model for simulation of streamflow and the 2-D Navier-Stokes equations are solved in the MIKE 21 model for simulation of overland flow, and finally the flood inundation depth (m) and extent obtained is utilized to represent the flood hazard for the catchment. Finally, the flood inundation and hazard maps are derived for the various rainfall scenarios. The Australian Flood Hazard Classification is considered to classify flood inundation and hazard into various classes (AIDR, 2017). The inundation is classified into seven categories based on depth only and hazard into six categories based on both depth and velocity.
2.3 Risk Assessment
Risk is expressed as combination of two major components, i.e., hazard and vulnerability (Knighton et al., 2017). Flood risk maps indicate the potential adverse consequences of floods under a variety of probabilities, such as the number of inhabitants potentially affected, the type of economic activity affected, and the installations that could cause accidental pollution during flooding. Various approaches have been adapted in literature to quantify risk such as univariate flood risk mapping, in which risk is expressed as product of hazard and vulnerability (Vojinovic et al., 2016; Arrighi et al., 2019); and bivariate flood risk mapping, where hazard and risk are mapped as two different but spatially correlated variables in same map using a choropleth representation (Mohanty et al., 2020; Vittal et al., 2020; Ghosh et al., 2023), among many others. For the current study the univariate risk mapping approach is used for flood risk assessment. Here, the assessment of flood risk requires hazard and vulnerability estimations separately, which are subsequently aggregated. Univariate flood risk is used to calculate the magnitude of risk from hazards and vulnerabilities in the current study. By multiplying the hazard values with the vulnerability values, a risk value is generated that is further standardized between 0 and 1 and divided into very low, low, medium, high, and very high-risk categories (AIDR, 2017), and flood risk maps for each scenario for the area under consideration are developed.
Figure 3 shows the socio-economic vulnerability maps using DEA for the different scenarios considered. The framework developed proposes an indicator-based approach in which relevant attributes related to socio-economic vulnerability are brought into a spatial database. Five socio-economic scenarios are considered, namely the baseline scenario of 2001 and 2011 and three other scenarios where the indicators like percent of literate population and female population are increased each by 10 % and non-worker population are reduced by 10 % for different scenarios to depict the reduction in vulnerability. As expected, the vulnerability increased in 2011 than that of 2001, which can be attributed to the increase in vulnerable population in the study area as a result of unplanned expansion, slum dwelling population resulting in increase in non-working population, illiterate population, etc., among many other factors. Due to the presence of a large proportion of slum areas and large population density along the Mithi riverbanks making them more susceptible to the impacts of flooding, high vulnerability is found in those regions which can also be visualized from the vulnerability maps. When compared with the baseline scenario of 2011, the scenario where the percentage of non-workers was reduced contributed the most to overall vulnerability reduction among the five scenarios. Female literacy has a greater impact on overall vulnerability than total literacy. The increase in total literacy contributes almost nothing in decrease in vulnerability. The percentage of illiterate female population is high in south-eastern, eastern, and central parts when compared with other areas of the city. Correspondingly, the percentage distribution of total illiterate population across the city is not as uneven as the female illiterate population. Hence, the scenario of female illiteracy reduction results in greater reduction in vulnerability values for obvious reasons. The figures also clearly demonstrate the decadal change in vulnerability. As a result, this scenario-based socio-economic approach can be useful in reducing socioeconomic vulnerability.
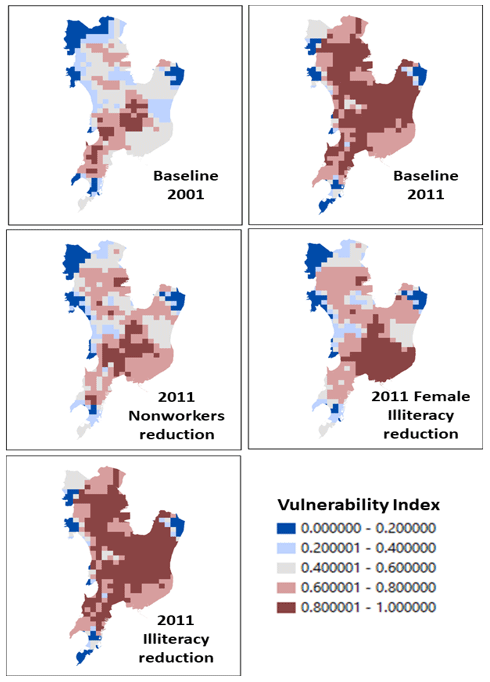
Figure 3Socio-economic vulnerability mapping for different scenarios considered.
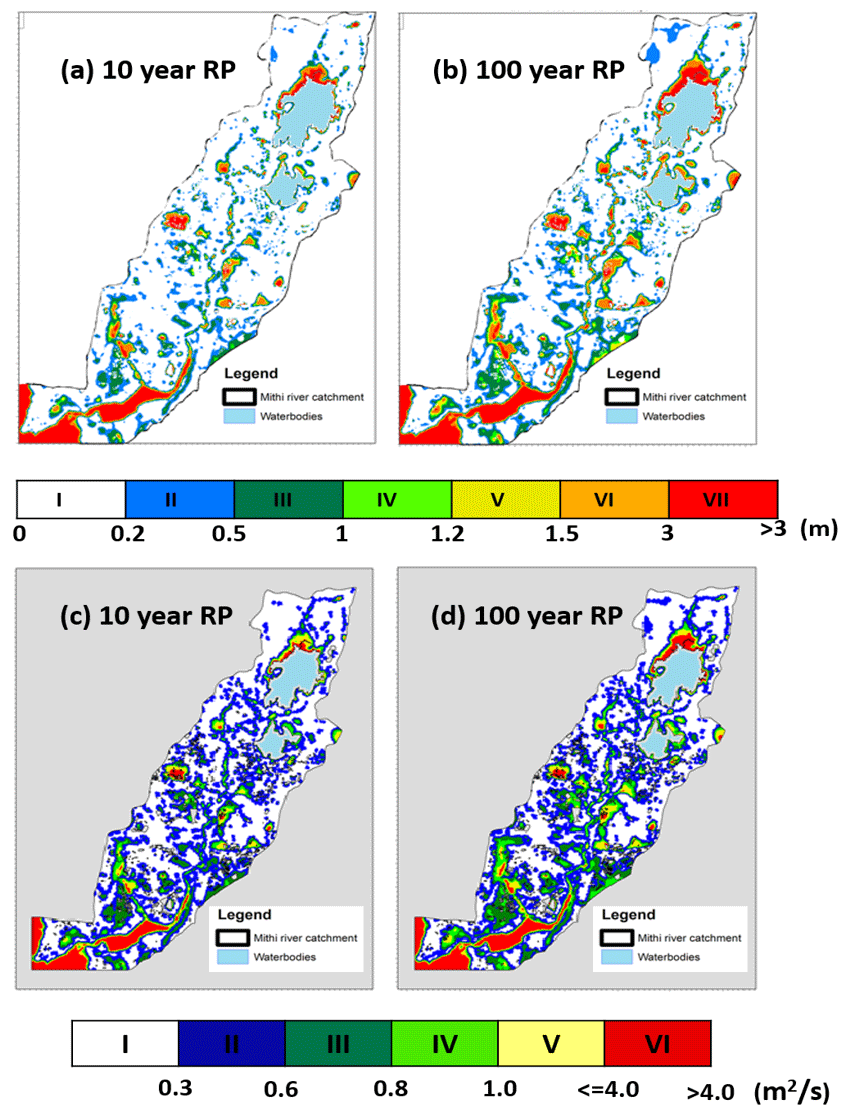
Figure 4Inundation maps for (a) 10 year and (b) 100 year return period and hazard maps for (a) 10 year and (b) 100 year return period.
Inundation and hazard maps derived with a 3-way coupled hydrodynamic flood modelling method are shown in Fig 4. The flood inundation is represented in terms of flood depth and the hazard is quantified by taking into consideration both inundation and velocity as per Australian Flood Hazard Classification (AIDR, 2017). As reflected in the flood maps, with an increase in rainfall return periods, flood inundation areas have increased. In areas with higher rainfall, depth, discharge, and tide, there is a greater chance of flooding. Likewise, for hazard maps, high intensity of rainfall and discharge leads to more inundation as well as increased flow velocities.
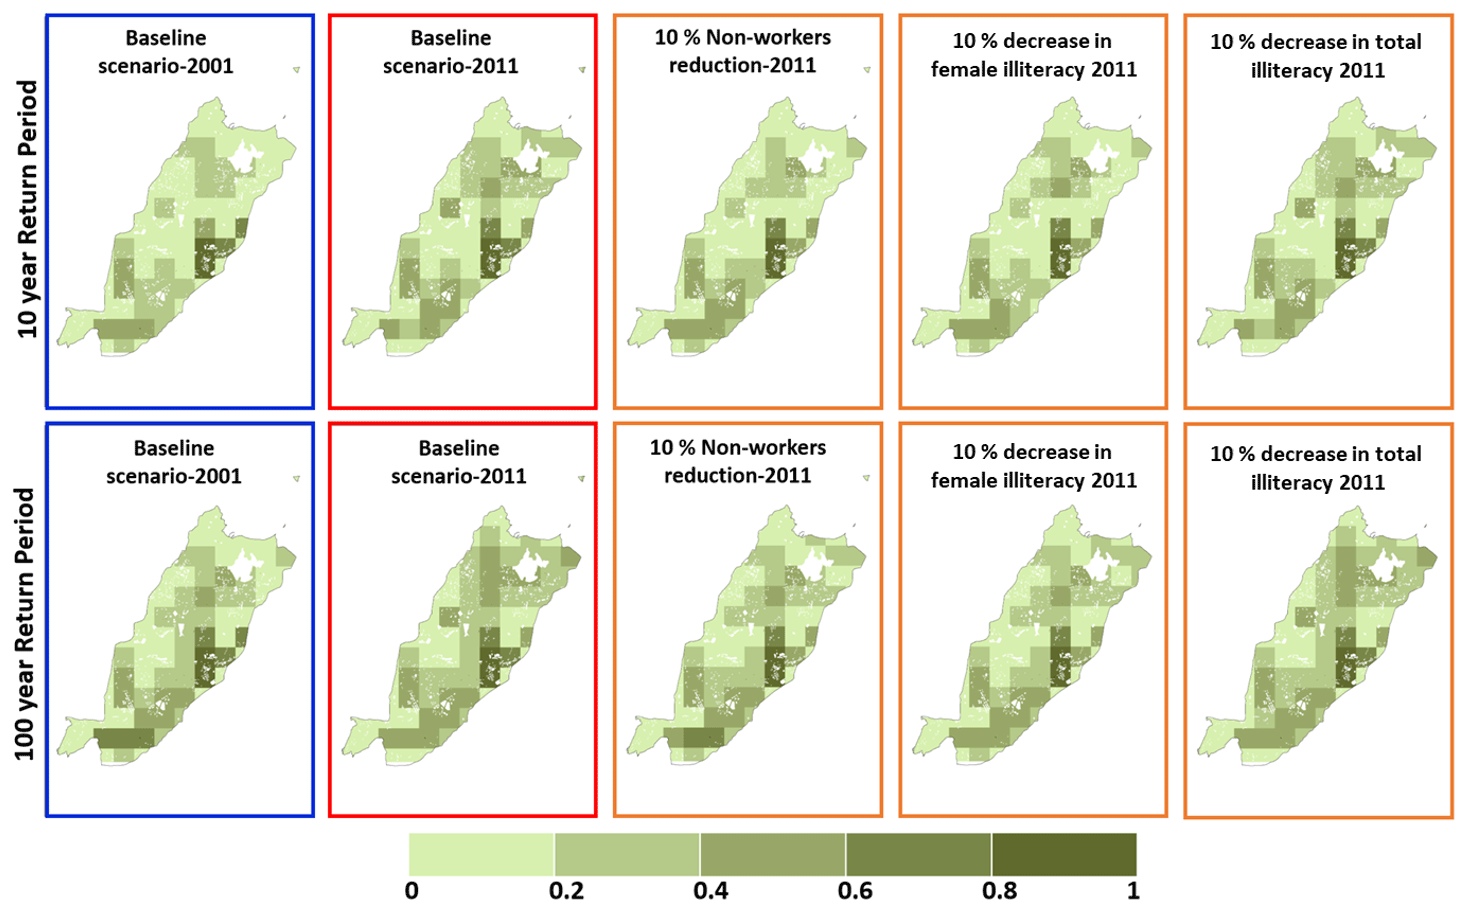
Figure 5Demonstrative risk maps derived for 10 year and 100-year return periods for different socio-economic vulnerability scenarios for Mithi river catchment.
The risk maps are derived which are combination of vulnerability and hazard using univariate approach represented in Fig. 5. The risk maps also show similar trend, i.e. the risk increases in increase in return period of rainfall, and with increase in vulnerability the risk also gets magnified. The 2001 and 2011 baseline scenarios are marked under blue and red borders respectively while the different scenarios are represented under orange borders. It is observed that the socio-economic scenario in which the total literacy is increased has almost no effect on overall reduction of risk. The other two scenarios, i.e., 10 % reduction in non-workers and 10 % increase in female literacy with respect to 2011 census data reduces the overall risk with respect to the baseline 2011 scenario.
In the present study, a comprehensive vulnerability mapping framework addressing the socio-economic aspects (e.g., total population. illiterate population, households, elderly and children population, etc.) using a nonparametric data envelopment analysis (DEA) is developed. Further vulnerability assessment under different socio-economic scenarios is performed to identify the key indicators which contribute to a significant change in vulnerability. A 3-way coupled hydrodynamic flood model is implemented for flood modelling. The inundation and hazard maps for 10 and 100 years of return period of rainfall are derived. The results indicate that with the alteration in the feasible socio-economic indicators the overall vulnerability maybe reduced. The inundation and hazard increase with increase in return period. In addition to implementation of various methods to alleviate the flood hazard, the overall risk can be reduced by reducing the vulnerability as described in various scenarios in this study. The study may be further extended by considering more socio-economic vulnerability scenarios and for deriving bivariate flood risk maps and hence the marginal contribution of both hazard as well as vulnerability can be deduced. The retention and recession time can be considered to evaluate flood resilience of an area to flooding as a future scope of the study. The current study primarily focusses on evaluation on long term flood management options by adapting various vulnerability scenarios for flood risk alleviation, therefore the flood inundation depth and extent (major indicators) has been considered for flood hazard assessment. In future, this study may be extended to include other descriptors of flood hazard and resilience and with updated census of India data when available.
The MIKE FLOOD platform has been utilized to develop the hydrodynamic flood model (https://www.mikepoweredbydhi.com/products/mike-flood) (Danish Hydraulic Institute (DHI), 2020). The rainfall prediction, vulnerability and risk assessment, has been performed by using Python software using packages such as numpy, pandas, and scipy (Van Rossum and Drake, 1995)).
The census of India demographic data for vulnerability assessment can be obtained from https://censusindia.gov.in/census.website/data/census-tables (Census of India, 2001, 2011). The rainfall data can be obtained through request from India Meteorological Department (IMD), India (https://dsp.imdpune.gov.in/, India Meteorological Department, 2023). The tidal data can be obtained from Indian National Centre for Ocean Information Services (INCOIS), Hyderabad, India, used in this study can be obtained from https://incois.gov.in/portal/datainfo/drform.jsp (INCOIS, 2023).
SK and MG designed the problem. MG performed the analysis with inputs from SK. MG prepared the figures with inputs from SK and SG. MG wrote the original draft of the manuscript with inputs from SK. SK and SG did the funding and data acquisition for the work. All authors reviewed and edited the manuscript.
The contact author has declared that none of the authors has any competing interests.
Publisher’s note: Copernicus Publications remains neutral with regard to jurisdictional claims made in the text, published maps, institutional affiliations, or any other geographical representation in this paper. While Copernicus Publications makes every effort to include appropriate place names, the final responsibility lies with the authors.
This article is part of the special issue “ICFM9 – River Basin Disaster Resilience and Sustainability by All”. It is a result of The 9th International Conference on Flood Management, Tsukuba, Japan, 18–22 February 2023.
This work is supported by the Department of Science & Technology (SPLICE – Climate Change Programme), GoI, Project reference numbers DST/CCP/CoE/140/2018), and the Industrial Research & Consultancy Centre (IRCC) Award grant, IIT Bombay, Project reference numbers RI/0221-10000963-001, and the project under GISE hub, reference number RD/0121-DST0000-011.
This research has been supported by the Department of Science and Technology, Ministry of Science and Technology, India (SPLICE – Climate Change Programme, GoI, grant no. DST/CCP/CoE/140/2018), the Industrial Research and Consultancy Centre (grant no. IRCC Award grant, IIT Bombay, Project reference numbers RI/0221-10000963-001) and the grant by the Industrial Research and Consultancy Centre (IRCC), IIT Bombay under GISE hub, reference number RD/0121-DST0000-011.
This paper was edited by Christophe Cudennec and reviewed by Rajendra Prasad and one anonymous referee.
Arrighi, C., Pregnolato, M., Dawson, R. J., and Castelli, F.: Preparedness against mobility disruption by floods, Sci. Total Environ., 654, 1010–1022, 2019.
Australian Institute for Disaster Resilience (AIDR): Guideline 7-3, Supporting document for implementation of Australian Disaster Resilience Handbook 7 Managing the Floodplain: A Guide to Best Practice in Flood Risk Management in Australia, https://knowledge.aidr.org.au/media/3518/adr-guideline-7-3.pdf (last access: 10 January 2023), 2017.
Census of India: Provisional population totals, Census of India, New Delhi: Office of the Registrar General and Census Commissioner, India, https://censusindia.gov.in/census.website/data/census-tables (last access: 10 January 2023), 2001.
Census of India: Provisional population totals, Census of India, New Delhi: Office of the Registrar General and Census Commissioner, India, https://censusindia.gov.in/census.website/data/census-tables (last access: 10 January 2023), 2011.
Cooper, W. W., Seiford, L. M., and Zhu, J.: Data envelopment analysis: History, models, and interpretations, in: International Series in Operations Research and Management Science, 164, https://doi.org/10.1007/978-1-4419-6151-8_1, 2011.
Danish Hydraulic Institute (DHI): MIKE FLOOD 1D-2D Modelling User Manual, https://www.mikepoweredbydhi.com/products/mike-flood (last access: 10 January 2023), 2020.
Environment Agency: EEA core set of indicators: Guide, EEA Technical Report No. 1/2005, Copenhagen, Denmark, https://www.eea.europa.eu/publications/technical_report_2005_1/file (last access: 10 January 2023), 2005.
Ghosh, M., Mohanty, M. P., Kishore, P., and Karmakar, S.: Performance evaluation of potential inland flood management options through a three-way linked hydrodynamic modelling framework for a coastal urban watershed, Hydrol. Res., 52, 61–77, https://doi.org/10.2166/NH.2020.123, 2021a.
Ghosh, M., Singh, J., Sekharan, S., Ghosh, S., Zope, P. E., and Karmakar, S.: Rationalization of automatic weather stations network over a coastal urban catchment: A multivariate approach, Atmos. Res., 254, 105511, https://doi.org/10.1016/j.atmosres.2021.105511, 2021b.
Ghosh, M., Shastri, H., Ghosh, S., and Karmakar, S.: A Novel Response Priority Framework for an Urban Coastal Catchment Using Global Weather Forecasts-Based Improved Flood Risk Estimates, J. Geophys. Res.-Atmos., 128, e2023JD038876, https://doi.org/10.1029/2023JD038876, 2023.
Indian National Centre for Ocean Information Services (INCOIS): Tidal elevation data, INCOIS [data set], https://incois.gov.in/portal/datainfo/drform.jsp, last access: 10 January 2023.
India Meteorological Department: Stationwise rainfall data, https://dsp.imdpune.gov.in/, last access: 10 January 2023.
Jolliffe, I. T.: Principal Component Analysis, Springer-Verlag, New York, 2nd edition, Springer Series in Statistics, http://cda.psych.uiuc.edu/statistical_learning_course/Jolliffe I. Principal Component Analysis (2ed., Springer, 2002)(518s)_MVsa_.pdf (last access: 10 January 2023), 2002.
Karmakar, S., Simonovic, S. P., Peck, A., and Black, J.: An Information System for Risk Vulnerability Assessment to Flood, Journal of Geographic Information System, 2, 129–146, https://doi.org/10.4236/jgis.2010.23020, 2010.
Knighton, J., Steinschneider, S., and Walter, M. T.: A vulnerability-based, bottom-up assessment of future riverine flood risk using a modified peaks-over-threshold approach and a physically based hydrologic model, Water Resour. Res., 53, 10043–10064, 2017.
Kron, W.: Flood Risk = Hazard ⋅ Values ⋅ Vulnerability, Water Int., 30, 58–68, https://doi.org/10.1080/02508060508691837, 2005.
Mohanty, M. P., H, V., Yadav, V., Ghosh, S., Rao, G. S., and Karmakar, S.: A new bivariate risk classifier for flood management considering hazard and socio-economic dimensions, J. Environ. Manage., 255, 109733, https://doi.org/10.1016/j.jenvman.2019.109733, 2020.
Russo, B., Gómez, M., and Macchione, F.: Pedestrian hazard criteria for flooded urban areas, Nat. Hazards, 69, 251–265, https://https://doi.org/10.1007/s11069-013-0702-2, 2013.
Shao, W., Xian, S., Lin, N., Kunreuther, H., Jackson, N., and Goidel, K.: Understanding the effects of past flood events and perceived and estimated flood risks on individuals' voluntary flood insurance purchase behaviour, Water Res., 108, 391–400, https://doi.org/10.1016/j.watres.2016.11.021, 2016.
Sherly, M. A., Karmakar, S., Parthasarathy, D., Chan, T., and Rau, C.: Disaster vulnerability mapping for a densely populated coastal urban area: An application to Mumbai, India, Ann. Assoc. Am. Geogr., 105, 1198–1220, https://doi.org/10.1080/00045608.2015.1072792, 2015.
Van Rossum, G. and Drake Jr., F. L.: Python reference manual, Centrum voor Wiskunde en Informatica Amsterdam, https://dl.acm.org/doi/book/10.5555/869369 (last access: 10 January 2023), 1995.
Vittal, H., Karmakar, S., Ghosh, S., and Murtugudde, R.: A comprehensive India-wide social vulnerability analysis: highlighting its influence on hydro-climatic risk, Environ. Res. Lett., 15, 014005, https://doi.org/10.1088/1748-9326/ab6499, 2020.
Vojinovic, Z., Hammond, M., Golub, D., Hirunsalee, S., Weesakul, S., Meesuk, V., Medina, N., Sanchez, A., Kumara, S., and Abbott, M.: Holistic approach to flood risk assessment in areas with cultural heritage: apractical application in ayutthaya, thailand, Nat. Hazards, 81, 589–616, 2016.