the Creative Commons Attribution 4.0 License.
the Creative Commons Attribution 4.0 License.
 | 21 Jun 2024
Developing an Integrated Flood Management Plan under climate change for Grand River North West River basin, Mauritius
Akshay Kowlesser
Mohamed Rasmy
Toshio Koike
In this article, the catchment of Grand River North West (GRNW) in Mauritius was selected as a case study to develop an Integrated Flood Management Plan to address the flood risks that Mauritius is and will be facing due to climate change. The study contains three main components: (i) a climatology analysis for the past (2003–2018) and future climate (2025–2040) to assess the trends in floods under climate change, (ii) the development of a hydrological model to study the hydrological responses of the basin for extreme flooding events, and (iii) a GIS-based flood risk model to develop a risk map. The results show that extreme rainfall events exceeding 50 mm d−1 have a high likelihood of increasing. A flood vulnerability map for the basin was developed based on nine indicators to aid decision making at the village council area (VCA) level and guide financial investments flood mitigation measures. The study established a novel end-to-end approach to develop an Integrated Flood Management Plan based on a case study for a river basin in Mauritius.
- Article
(2413 KB) - Full-text XML
- BibTeX
- EndNote


From 2000 to 2019, floods affected 1.6 billion people worldwide and accounted for 44 % of all disaster events, the highest figure for any disaster type (CRED and UNDRR, 2020; UNDRR, 2020). Floods also killed 104 614 people and caused USD 651 billion in economic damage during this period (Toledo-Gallegos et al., 2022). Flood impacts are, however, felt differently in various parts of the world due to the physical, socio-economical, environmental, and geographical specificities and this rings even truer for Small Island Developing States (SIDS) (Scandurra et al., 2018) like Mauritius. With the limited space for land use development coupled with an economic strategy driven to support real estate development, Mauritius, is undergoing consequential urbanization (Baguant-Moonshiram et al., 2013), and as a result, Mauritius is becoming increasingly exposed to flood risks. The second most significant hydroclimatic hazard that Mauritius faces after cyclones, is flooding. It leads to direct losses of about USD 22 million annually, which accounts for 20 % of the country's economic losses related to natural disasters(Simpson et al., 2016). This article therefore aims at developing an end-to-end scalable framework to propose an integrated flood management plan based on the case study of the second largest river basin in Mauritius, the Grand River North West Basin.
2.1 Study Area
The Grand River North West (Fig. 1), has an area of 114 km2 and consists of young lava series geology for the most part. The GRNW basin has a mixed land use; 35 % for urban areas, 34 % for agricultural land (consisting mainly of sugarcane fields), and 24 % for forest land. The catchment of GRNW has undergone significant land use changes in the past decade alone. The catchment of GRNW contains the Moka Smart City, currently under construction of an extent of around 19 km2 taking over sugarcane fields. This large-scale development will further accentuate the very present flooding issues in the catchment if not integrated with the overall water management and land use strategies.
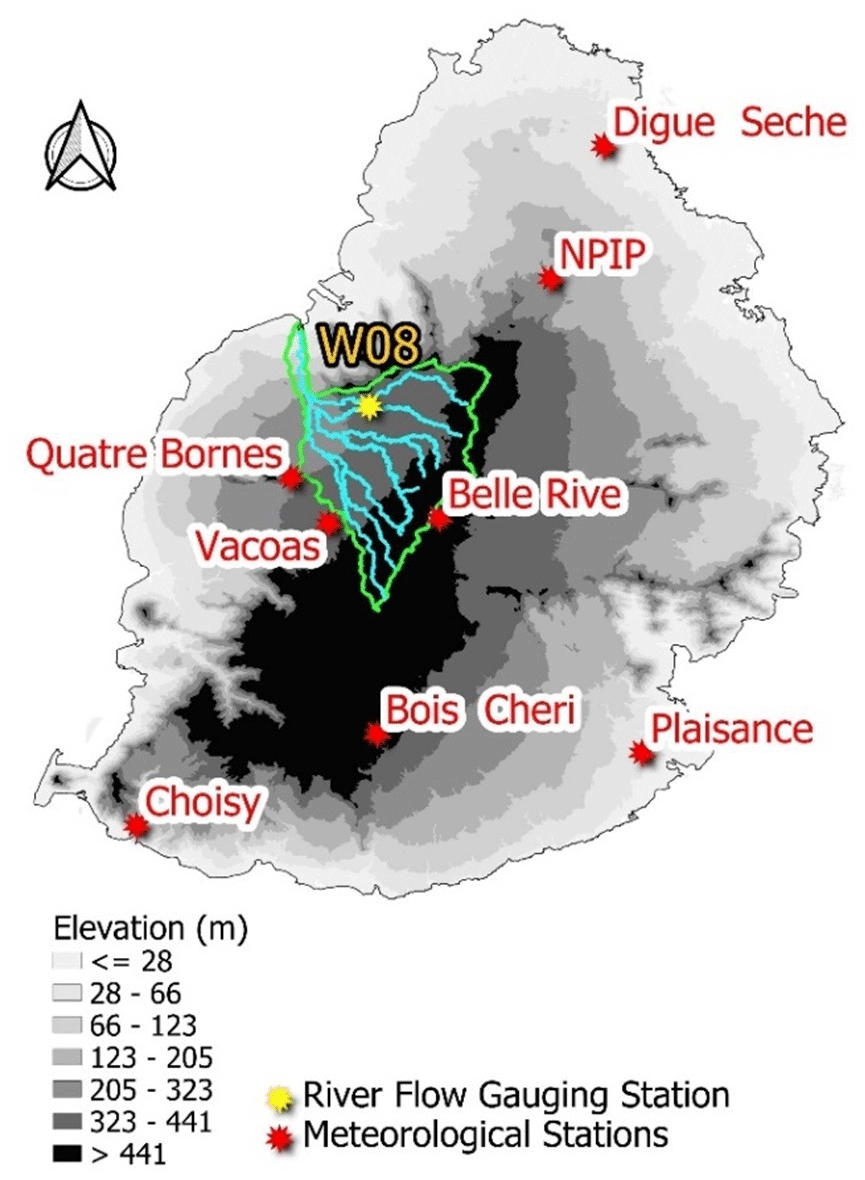
Figure 1Location of GRNW Basin.
2.2 Input data collection and preparation
For the purpose of this study, meteorological data and river discharge data were used for climate change impact assessment and robust hydrological model development. The respective stations are shown in Fig. 1. A digital elevation model (DEM) with a resolution of 60 m was also used for the model construction as well as MODIS (MCD15A2H), Japanese Reanalysis 55 years Data (JRA-55) 3 h temporal resolution, and 0.125° spatial resolutions for air temperature, wind speed, specific humidity, and surface pressure, and 0.56° spatial resolution for downward radiations, respectively. These data were interpolated to the model grid resolution of 60 m and a model temporal resolution of 1 h using a linear interpolation method.
2.3 Climate Analysis
To enable addressing island-scale rainfall trends for future climate analysis and ensuing flood risks, general circulation model (GCM) outputs were used. GCMs are important tools, but their outputs, although reasonable, are often not adapted to regional climate characteristics, which are critical for basin- and national-scale studies (Kawasaki et al., 2017). The Coupled Model Intercomparison Project Phase 5 (CMIP5) (Taylor et al., 2012) Data Integration and Analysis System (DIAS) tool is a state-of-the-art multimodel dataset comprised of 44 GCMs and tools to reduce this uncertainty associated with GCMs so as to better represent regional climate conditions. A methodology developed by Koike et al. (2014) proposed the selection of the best suited GCMs to best represent regional climatology based on 7 key meteorological elements which are:
- a.
Precipitation-Small scale
- b.
Air Temperature-Medium Scale
- c.
Outgoing Long Wave Radiation- Medium Scale
- d.
Sea Level Pressure- Medium Scale
- e.
Zonal Wind- Medium Scale
- f.
Meridional Wind- Medium Scale
- g.
Sea Surface Temperature-Large Scale
A small domain was chosen for the precipitation and a larger domain for the sea surface temperature while a medium domain was chosen for the other parameters. The larger domain was selected for the sea surface temperature due to the effects of the El Nino Southern Oscillation, which affects the climate in the Indian Ocean region.
The spatial correlation (Scorr) and the root mean square were used to compare the variances between the models and the observed global datasets. The Global Precipitation Climatology Project (GPCP) dataset was used to analyze the mean monthly rainfall, while the Japan reanalysis data (JRA55) was used to differentiate other meteorological variables.
The Scorr and absolute values were thus used as indices to evaluate the best GCMs.
Based on the past climate records (1 January 2003–31 December 2018), the future climate projections and trends can be analyzed using these GCMs. Four rain gauge stations were chosen for that purpose since they contained relatively complete daily data, and wherever data was missing, the data was filled using nearby points. The four selected stations were: Belle Rive, Bois Cheri, Digue Seche and Plaisance.
The precipitation data was then downscaled and bias-corrected. The CMIP5-DIAS adopts a three-step statistical bias correction (Nyunt et al., 2016). For each of the four gauge stations, the GCM data was extracted and divided into extreme rainfall, normal rainfall, and no rainfall thresholds. The Generalized Pareto Distribution was used for extreme-rainfall correction, the gamma distribution was used for normal-rainfall correction, and the statistical ranking order was used for no-rain days correction (Koike et al., 2014). The RCP 8.5 radiative forcing scenario was used to investigate the effects of climate change on precipitation. The corrected and downscaled rainfall data for each of the four stations was then obtained for future projections for the years 2025–2040.
For the purpose of this study, and based on the aforementioned methodology, the best suited GCMs were identified to be:
- i.
CMCC-CESM@ens_mean (Scoccimarro et al., 2011)
- ii.
ACCESS1.3@ens_mean (Lewis et al., 2014)
- iii.
CESM1(CAM5)@ens_mean (Neale et al., 2010)
- iv.
CSIRO-Mk3.6.0@ens_mean (Gordonet al., 2002)
2.4 Hydrological Model Development
The Water and Energy Budget-based Rainfall-Runoff-Inundation (WEB-RRI) model (Rasmy et al., 2019) was used for the simulation of catchment-scale water budgets as well as rainfall-runoff-inundation processes so as to perform operational applications such as hydrological extremes forecasting, land use changes, and water-cycle variability.
The WEB-RRI model combines physical processes such as vertical transfer of moisture and energy fluxes, soil-vegetation-atmosphere interactions, soil structure, soil-moisture dynamics, lateral movements of water flows, and interaction between vertical and horizontal water flows. The model structure is comprised of four components:
- i.
The Simple Biosphere (SiB) Model 2 module
- ii.
The unsaturated zone vertical flow
- iii.
The 2D diffusive wave lateral flow module
- iv.
The 1D diffusive wave river flow module
2.5 Flood Vulnerability Assessment
The vulnerability index for each VCA (the smallest administrative unit for infrastructure management) was computed to enable local management of the vulnerability at an urban scale while taking into consideration a larger basin scale effect.
Vulnerability can be defined as the “extent of harm that can be expected under certain conditions of exposure, susceptibility and resilience.” (UNESCO IHE, 2021).
The flood vulnerability equation can therefore be summarized as follows:
where exposure is defined in this context as the cost of damage to buildings and agricultural land and risk of loss of life as well as access to main roads and highways; susceptibility, on the other hand, relates to the system characteristics and are elements exposed within the system that influence the damage probability of flooding (UNESCO IHE, 2021) and resilience can be expressed as any system's ability to withstand and come back from a significant perturbation such as floods while maintaining a certain level of efficiency and functionality in its social, environmental, economic, and physical components (Kerner and Thomas, 2014) with indicators such as shelters and flood defence implementation.
3.1 Extreme Rainfall Analysis
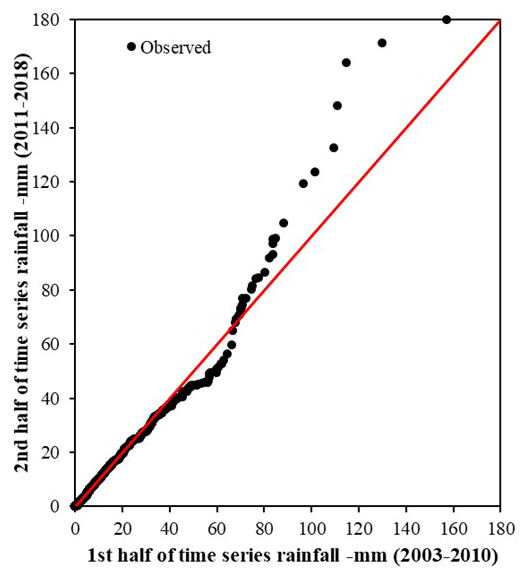
The Innovative Trend Analysis (Sen, 2012) was used to study the climatic trends of the past recorded climate by looking at changes in precipitation occurring at two equal historical consecutive scales. The results in Fig. 2 illustrate that during the last 8 years, precipitation exceeding 100 mm became more common. This increasing trend of extreme rainfall events suggests potentially significant flood damage in the past decade.
To assess the level of confidence in the future simulations, a simple methodology was adopted:
- a.
If 4 out of the 4 models agree on their output, the event is deemed very likely to happen (100 %).
- b.
If 3 out of the 4 models agree, the event is deemed likely to happen (75 %).
- c.
If 2 out of the 4 models agree, the event is deemed uncertain. (50 %).
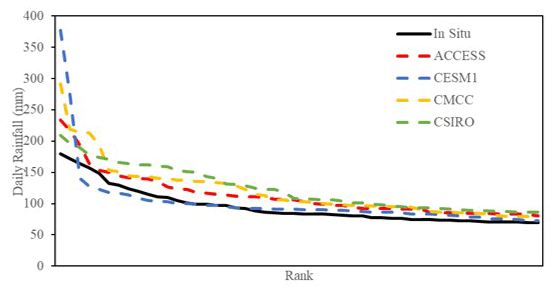
The trends in extreme precipitation obtained from the GCM simulations were analysed to investigate the possible increase in hazard caused by heavy rainfall. The highest 30 daily rainfall events for the simulations for 2025–2040 were compared to the previous observed records for the past 16 years (Fig. 3). It can be observed that all the models agree that there will be an increase in the extreme daily rainfall intensity, with the CESM1 model even showing a twofold increase. There is therefore a very high likelihood that the extreme rainfall events will increase in their intensity and that record breaking events will occur.
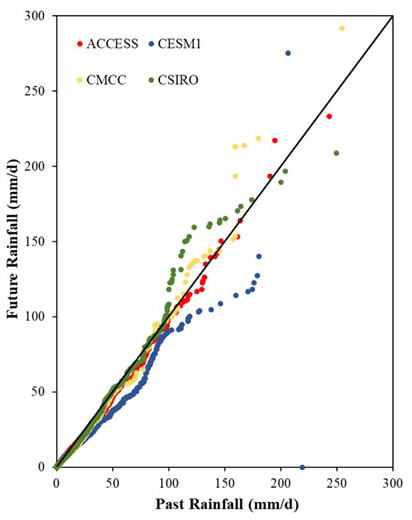
This was further demonstrated using the Innovative Trend Analysis comparing past and future simulations as shown in Fig. 4, where the values of in-situ rainfall were compared to the GCMs. It was observed that the models predict an increasing trend in extreme events (for a threshold of 100 mm).
Therefore, it can be inferred from the above that extreme rainfall events of above 100 mm d−1 will become more frequent. Moreover, record-breaking events will also become more common. As such, it is expected with a very high level of confidence that in the next 16 years, flood events will become more common in Mauritius, as has been the trend in the past.
3.2 WEB RRI Simulation
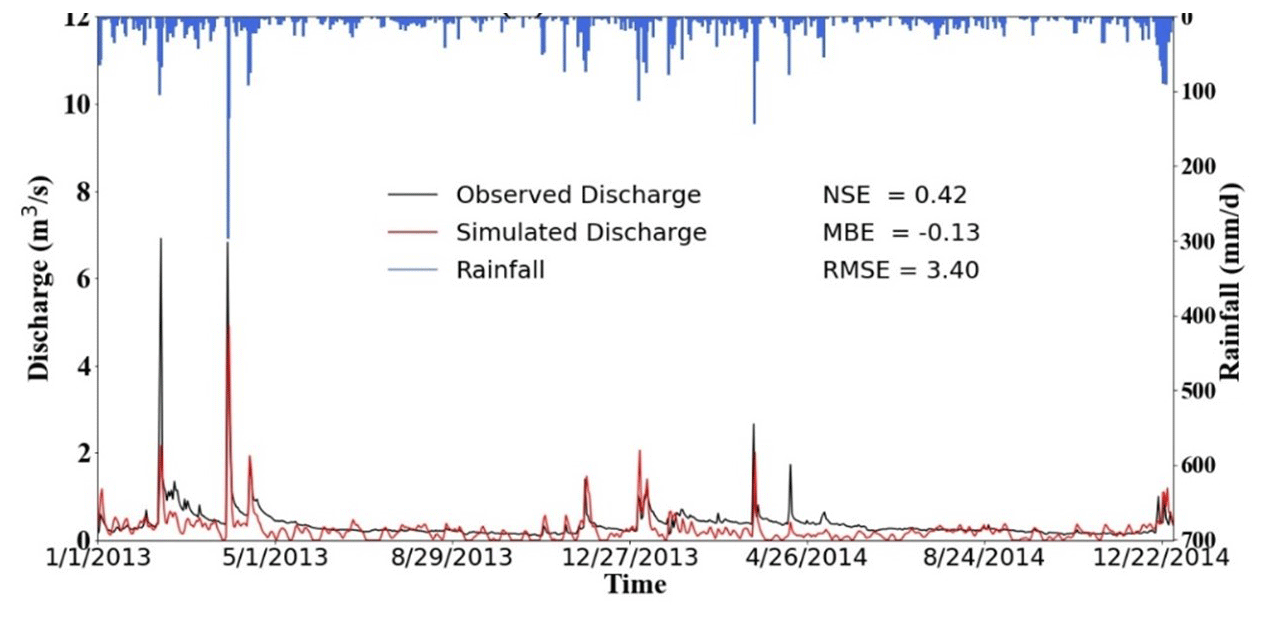
The WEB-RRI model was calibrated reasonably well for high flows and well-calibrated for low flows. The model performance was evaluated using the MBE, RMSE, and NSE. It should be noted that the W08 station, situated in Riviere Profonde as shown in Fig. 1 drains only a section of the GRNW catchment. This explains the relatively low flows in the order of 6 m3 s−1 for flood peaks and 1 m3 s−1 for the base flow at the river discharge measurement location. As such, since the difference between the peak and the base flow was not very discernible within the model, the calibration to model the low flows had to be carefully done so as not to overestimate the base flows and to capture the peak flows and vice versa. The model managed to capture the base flows reasonably well while the peaks were slightly underestimated by a margin of 2–4 m3 s−1. The model was calibrated with an NSE = 0.42 and MBE m3 s−1, and RMSE = 3.40 m3 s−1 for the years 2013–2014, as shown in Fig. 5.
For the validation, the model parameters were kept constant, and the model was run from 1 January 2015 to 31 December 2016 for the same location. The model was validated with a satisfactory NSE = 0.41, MBE m3 s−1, and RMSE = 2.06 m3 s−1 for the years 2015–2016, as shown in Fig. 6. It was noted that the floods of February and March 2015 were well reproduced by the model, but that of January 2016 was not captured. The base-flow values were seen to be generally well simulated.
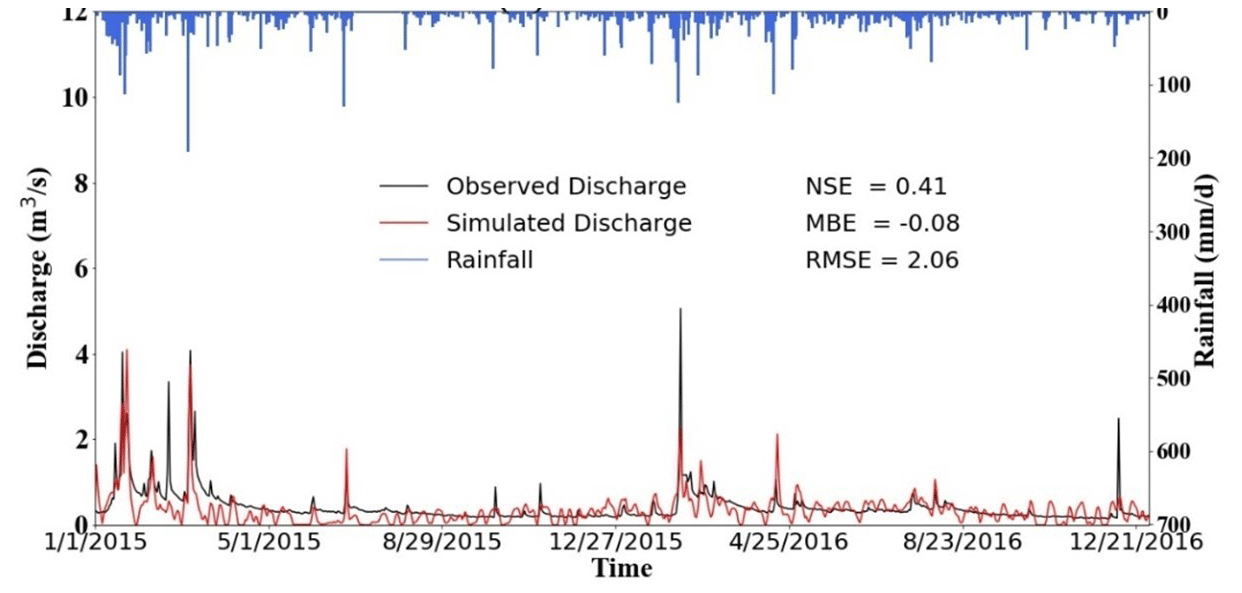
It was noted that the dry period which ranges from May to September gives a base flow for Riviere Profonde of less than 1 m3 s−1, and the wet period only shows singular peaks for specific flood events.
3.3 Flood Vulnerability Assessment
The vulnerability assessment demonstrated that one VCA, PL2, presented a very high risk of flooding. The PL2 VCA is at the downstream end of the basin, and with the basin being “funnel-shaped”, the high peak flow arrives and accumulates quickly at the outlet. Moreover, the low-lying topography of the PL2 VCA offers no gradient to discharge the flood efficiently to the sea. If a flood event coincides with a high tide or a storm surge, it is expected that the impacts of the flood at PL2 will significantly worsen. The Moka, St Pierre and VP5 VCAs are next in terms of their vulnerability due to the high concentration of assets (buildings and agricultural land) and a concentration of watercourses as well as new developments such as the Moka Smart city impacting on the basin run-off increase and decrease in lead times. The medium, low, and very low vulnerable VCAs were located mostly in the upstream sections where the majority of the land use consists of forested and agricultural land. The vulnerability assessment yielding a flood vulnerability map at a VCA level consists of an important tool in demonstrating to decision makers the risk of inaction and also the benefits of urgent and targeted actions using scientific evidence.
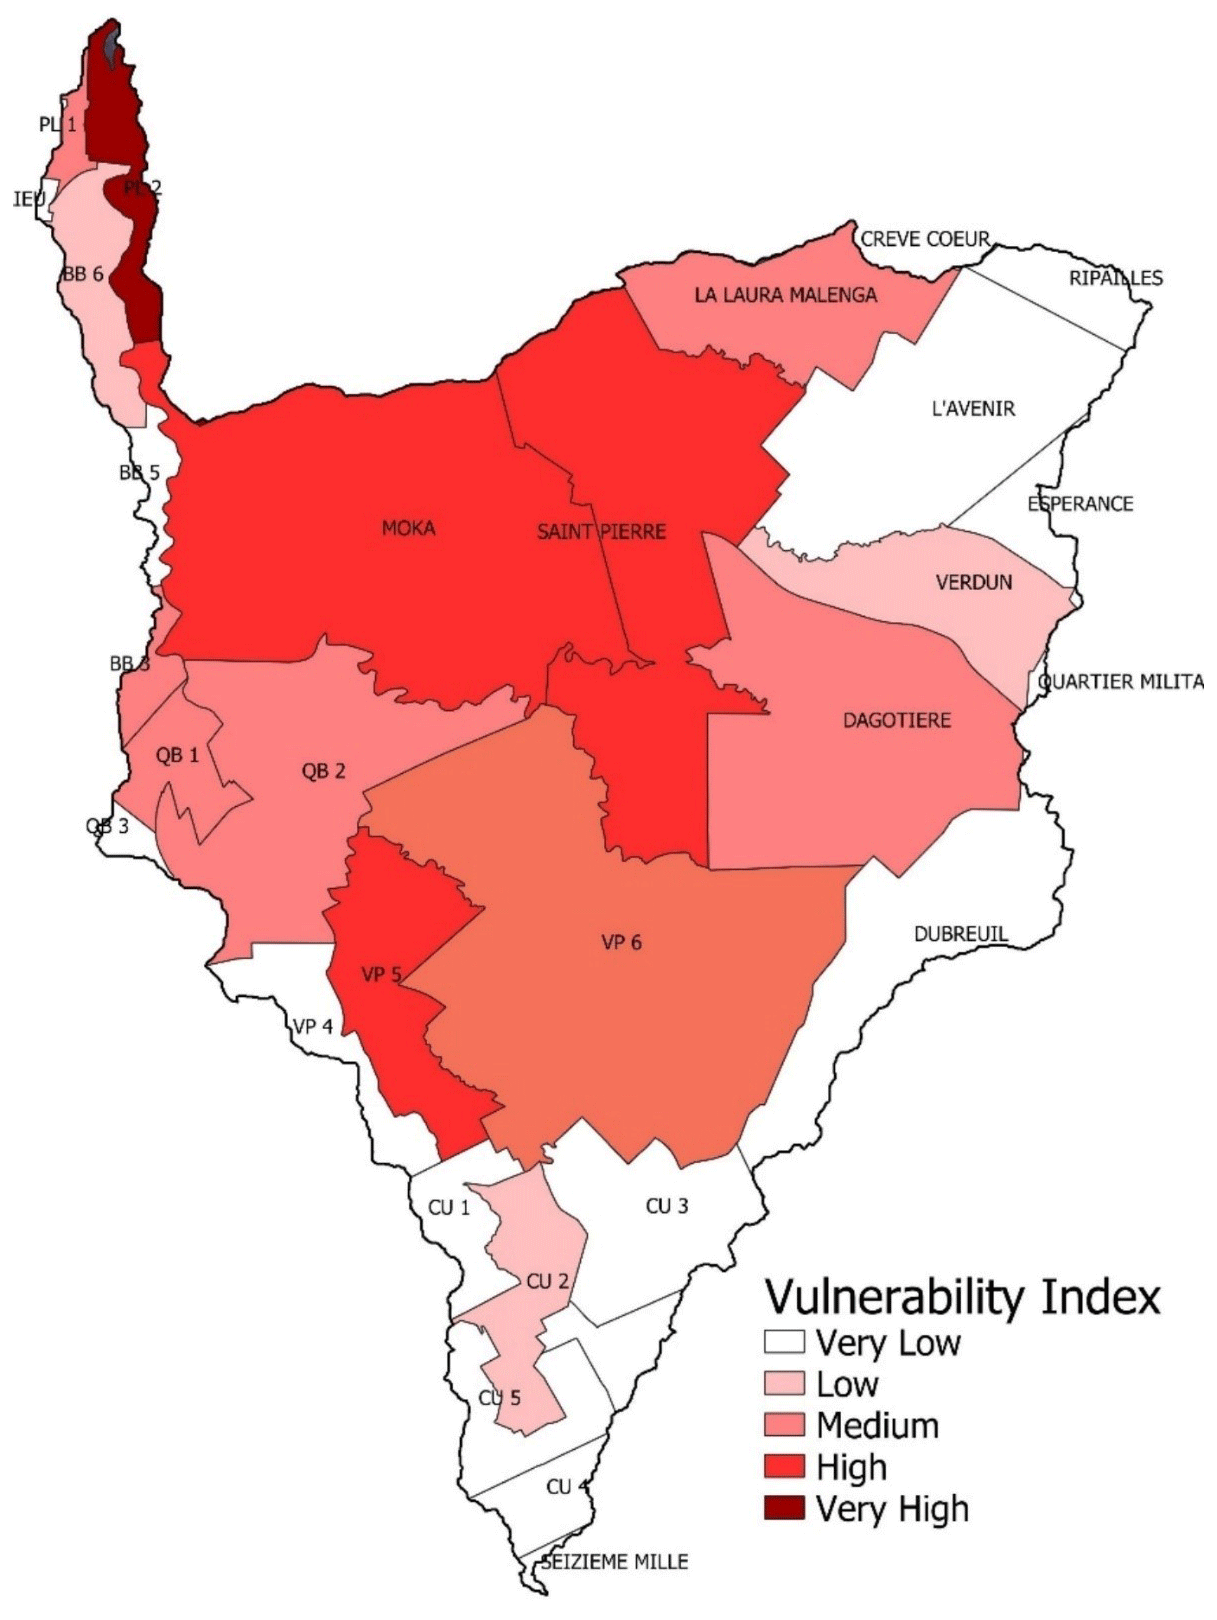
Figure 7Flood Vulnerability Index per VCA for GRNW.
Mauritius, as a small island developing state, is exposed to a number of pressing water related hazards which have rendered Mauritius vulnerable in terms of its disaster management as well as posed threats to its water resources. This research work has aided in understanding the past climatic trends in Mauritius and their impacts on flood hazards. Based on the past climate trends, future climate trends were inferred based on GCMs that were downscaled and bias-corrected. It was inferred that it is very likely that in the near future, extreme rainfall exceeding 100 mm will become more common. By implementing hydrological modelling techniques coupled with climate change impact analyses and a GIS-based risk model, a novel technique that has been adopted on a basin scale in Mauritius, the relationship among rainfall, runoff, inundation, damage and vulnerability were identified. A vulnerability map with qualitative vulnerability indices has been developed to guide decision making in flood management strategies at a local level.
This research however provides findings based on 16 years of meteorological data for 8 stations. In order to increase the reliability and robustness of the developed models, longer time series and a higher number of stations should be included in the computation together with a higher resolution DEM.
The data is not publicly available and has been obtained from the Mauritius Meteorological Services, the Water Resources Unit and the Ministry of Housing and Land Use Planning of Mauritius.
MR conceptualized the study. AK developed the methodology, wrote the initial draft, and prepared the figures. TK supervised the work.
At least one of the (co-)authors is a guest member of the editorial board of Proceedings of IAHS for the special issue “ICFM9 – River Basin Disaster Resilience and Sustainability by All”. The peer-review process was guided by an independent editor, and the authors also have no other competing interests to declare.
Publisher's note: Copernicus Publications remains neutral with regard to jurisdictional claims made in the text, published maps, institutional affiliations, or any other geographical representation in this paper. While Copernicus Publications makes every effort to include appropriate place names, the final responsibility lies with the authors.
This article is part of the special issue “ICFM9 – River Basin Disaster Resilience and Sustainability by All”. It is a result of The 9th International Conference on Flood Management, Tsukuba, Japan, 18–22 February 2023.
The authors would like to extend their gratitude to the Mauritius Meteorological Services and the Water Resources Unit and the Ministry of Housing and Land use Planning for their help in the data acquisition. The authors would also like to extend their thanks to the Japan International Cooperation Agency (JICA) for supporting this cooperation.
This paper was edited by Christophe Cudennec and reviewed by two anonymous referees.
Baguant-Moonshiram, Y., Samy, M., and Thomas, K., The Challenges of Building Sustainable Cities: A Case Study of Mauritius, THE SUSTAINABLE CITY 2013, Putrajaya, Malaysia, 247–253, https://doi.org/10.2495/SC130211, 2013.
Centre for Research on the Epidemiology of Disasters (CRED) and UN Office for Disaster Risk Reduction, Human Cost of Disaster (UNDRR): An Overview of the Last 20 Years 2000–2019, 2020.
Gordon, H. B., Rotstayn, L. D., McGregor, J. L., Dix, M. R., Kowalczyk, E. A., O'Farrell, S. P., Waterman, L. J., Hirst, A. C., Wilson, S. G., Collier, M. A., and Watterson, I. G.: The CSIRO Mk3 Climate System Model, Aspendale, CSIRO Atmospheric Research technical paper, 60, 130 pp., http://www.dar.csiro.au/publications/gordon_2002a.pdf (last access: 15 August 2021), 2002.
Kawasaki, A., Yamamoto, A., Koudelova, P., Acierto, R., Nemoto, T., Kitsuregawa, M. and Koike, T.: Data Integration and Analysis System (DIAS) Contributing to Climate Change Analysis and Disaster Risk Reduction, Data Sci. J., 16, 41, https://doi.org/10.5334/dsj-2017-041, 2017.
Kerener, A. and Thomas, J. S.: Resilience Attributes of Social-Ecological Systems: Framing Metrics for Management, Resources, 3, 672–702, https://doi.org/10.3390/resources3040672, 2014.
Koike, T., Koudelova, P., Jaranilla-Sanchez, P. A., Bhatti, A. M., Nyunt, C. T., and Tamagawa, K.: River Management System Development in Asia Based on Data Integration and Analysis System (DIAS) under GEOSS, Earth Sci., 58, 76–95, 2014.
Lewis, S. C. and Karoly, D. J.: Assessment of Forced Responses of the Australian Community Climate and Earth System Simulator (ACCESS) 1.3 in CMIP5 Historical Detection and Attribution Experiments, Aust. Meteorol. Oceanogr. J., 64, 87–101, 2014.
Neale, R. B., Chen, C. C., Gettelman, A., Lauritzen, P. H., Park, S., Williamson, D. L., Conley, A. J., Garcia, R., Kinnison, D., Lamarque, J. F., and Marsh, D.: Description of the NCAR Community Atmosphere Model (CAM5.0), NCAR Tech. Rep. NCAR/TN-4861STR, 268 pp., 2010.
Nyunt, C. T., Koike, T., and Yamamoto, A.: Statistical bias correction for climate change impact on the basin scale precipitation in Sri Lanka, Philippines, Japan and Tunisia, Hydrol. Earth Syst. Sci. Discuss. [preprint], https://doi.org/10.5194/hess-2016-14, 2016.
Rasmy, M., Sayama, T. and Koike, T.: Development of Water and Energy Budget-based Rainfall Runoff-Inundation Model (WEB-RRI) and Its Verification in the Kalu and Mundeni River Basins, Sri Lanka, J. Hydrol., 579, 124163, https://doi.org/10.1016/j.jhydrol.2019.124163, 2019.
Scandurra, G., Romano, A. A., Ronghi, M., and Carfora, A.: On the Vulnerability of Small Island Developing States: A Dynamic Analysis, Ecol. Indic., 84, 382–392, https://doi.org/10.1016/j.ecolind.2017.09.016, 2018.
Scoccimarro, E., Gualdi, S., Bellucci, A., Sanna, A., Fogli, P. G., Manzini, E., Vichi, M., Oddo, P. and Navarra, A.: Effects of Tropical Cyclones on Ocean Heat Transport in a High Resolution Coupled General Circulation Model, J. Climate, 24, 4368–4384, https://doi.org/10.1175/2011JCLI4104.1, 2011.
Sen, Z.: Innovative Trend Methodologies in Science and Engineering, Springer, J. Hydrol. Eng., 17, 1042–1046, https://doi.org/10.1061/(ASCE)HE.1943-5584.0000556, 2017.
Simpson, A., Phillips, E., Balog, S., Murnane, R., Deparday, V., Fraser, S., Jongman, B., and Parmelee, L. F.: Southwest Indian Ocean Risk Assessment and Financing Initiative, Washington, D.C., World Bank Group, 2016.
Taylor, K. E., Stouffer, R. J., and Meehl, G. A.: The CMIP5 Experiment Design, B. Am. Meteorol. Soc., 93, 485–498, 2012.
Toledo-Gallegos, V. M., My, N. H. D., Tuan, T. H., and Börger, T.: Valuing Ecosystem Services and Disservices of Blue/Green Infrastructure: Evidence from a Choice Experiment in Vietnam, Econ. Anal. Policy, 75, 114–128, https://doi.org/10.1016/j.eap.2022.04.015, 2022.
UNDRR: The Human Cost of Disasters: An Overview of the Last 20 Years (2000–2019), https://www.undrr.org/publication/human-cost-disasters-overview-last-20-years-2000-2019 (last accessed: 28 December 2023), 2020.
UNESCO IHE: Flood Vulnerability Index, FVI, http://www.unesco-ihe-fvi.org/ (last access: 7 August 2021), 2021.
A flood management plan for the Grand River North West basin in Mauritius was developed to address the risks associated with climate change-induced flooding. Historical and projected climatic data were analyzed to discern trends in flood occurrence. A hydrological model was constructed to simulate the basin’s response to extreme flood events, and a Geographic Information System-based model was created for flood vulnerability map using exposure, susceptibility and resilience indicators.
A flood management plan for the Grand River North West basin in Mauritius was developed to...