the Creative Commons Attribution 4.0 License.
the Creative Commons Attribution 4.0 License.
 | 07 May 2024
Developing a flood monitoring system by utilizing real-time satellite rainfall estimates and water energy budget-based rainfall-runoff inundation model in West Africa
Abdul Wahid Mohamed Rasmy
Maksym Gusyev
Katsunori Tamakawa
Miho Ohara
Toshio Koike
The African regions have been affected by frequent flood-related disasters. To support decision-makers in flood disaster management, a real-time flood monitoring system was established in the Niger and Volta basins under the Water disaster platform to enhance climate resilience in Africa (WADiRE-Africa). To bridge a gap between data unavailability and inaccessibility, the near-real-time satellite rainfall data (GSMaP-NRT) was evaluated and found to have a very low correlation (<0.4) with gauge data at daily scales and a higher correlation (>0.7) at monthly scales. The statistically bias-corrected GSMaP-NRT data was used in the Water and Energy Budget-based Rainfall-Runoff-Inundation (WEB-RRI) model to generate hydrological responses of the basins. As the simulated river discharges were overestimated, an additional correction method was employed for the GSMaP-NRT data to match well with observed discharges. The prototype system provides real-time flood information in both basins.
- Article
(3811 KB) - Full-text XML
- BibTeX
- EndNote


Flood disasters have magnified over the last decade due to global changes (e.g. global warming, population increase, and land-use changes). Though Flood Early Warning System (FEWS) services are proven life-savers and crucial for flood risk management, those services are woefully insufficient for those who need them most, and half the world is not prepared for disasters (https://wmo.int/media/news/un-warns-half-world-not-prepared-disasters, last access: 19 April 2024).
Especially, the West African regions have been affected by frequent flood-related disasters (Floodlist News in Africa, 2020) hindering the region's sustainable development and requiring the capacity to predict, monitor, and mitigate flood disasters in the countries of the Niger and Volta basins. Despite various efforts by international donor organizations to bridge gaps in in-situ data, modeling technology, and capacity building in the West Africa region, these gaps remain the main challenge preventing a setup of FEWS to produce reliable outputs for policymakers in the West Africa region. In addition, the Niger and Volta basin countries lack flood-disaster management practices to prepare for disasters in advance. Given this situation, and to increase flood disaster preparedness and resilience, UNESCO IHP with help from the Government of Japan initiated the regional project titled “Water Disaster Platform to Enhance Climate Resilience in Africa” (WADiRE-Africa). The project was implemented in the Niger and Volta River basins by International Centre for Water Hazard and Risk Management (ICHARM), UNESCO Intergovernmental Hydrological Programme (IHP), and AGRHYMET Regional Center in collaboration with the Niger Basin Authority (NBA) and the Volta Basin Authority (VBA).
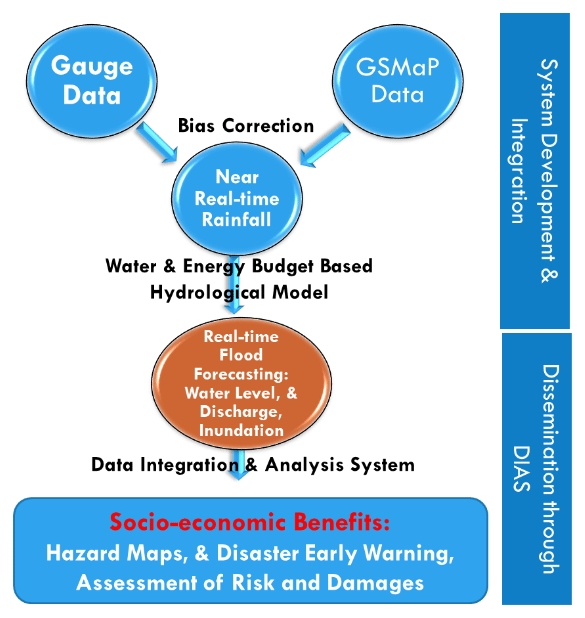
Preferably, a FEWS System (IFIS) should have the following essential components: (a) adequate real-time rainfall observations, (b) quantitative rainfall prediction (not incorporated in this project), (c) a runoff and inundation simulator, and (d) a data analysis and dissemination system (Rasmy et al., 2023). Figure 1 is the schematic diagram of major FEWS components and the data integration.
Real-time rainfall data with adequate spatial and temporal resolutions were unavailable in these basins. Global satellite precipitation products (SPPs) can contribute to water-related disaster management by improving their quality by merging with available ground gauges for hydrological applications in poorly gauged basins. This study used near-real-time GSMaP products, which are available at 0.1° spatial and 1 h temporal resolutions (Kubota et al., 2020). In addition, available ground rainfall and discharge data were obtained and used for satellite rainfall data calibration and model verification.
Moreover, physically-based Distributed Hydrological Models (DHMs) with the capability of simulating rainfall-runoff-inundation processes are very effective tools for obtaining crucial flood-related information (i.e., peak flow, inundation depths, and extents). this study employed the Water and Energy Budget-based Rainfall-Runoff-Inundation (WEB-RRI) model as a flood simulator, which has several merits, including (a) physical formulations for evapotranspiration fluxes and soil moisture dynamics to improve the accuracy of soil-water storages and reduce model-related uncertainties; (b) the compatibility with numerical weather models to estimate basin responses to model forcing data directly; and (c) restarting capability for warm-up simulations (Rasmy et al., 2019).
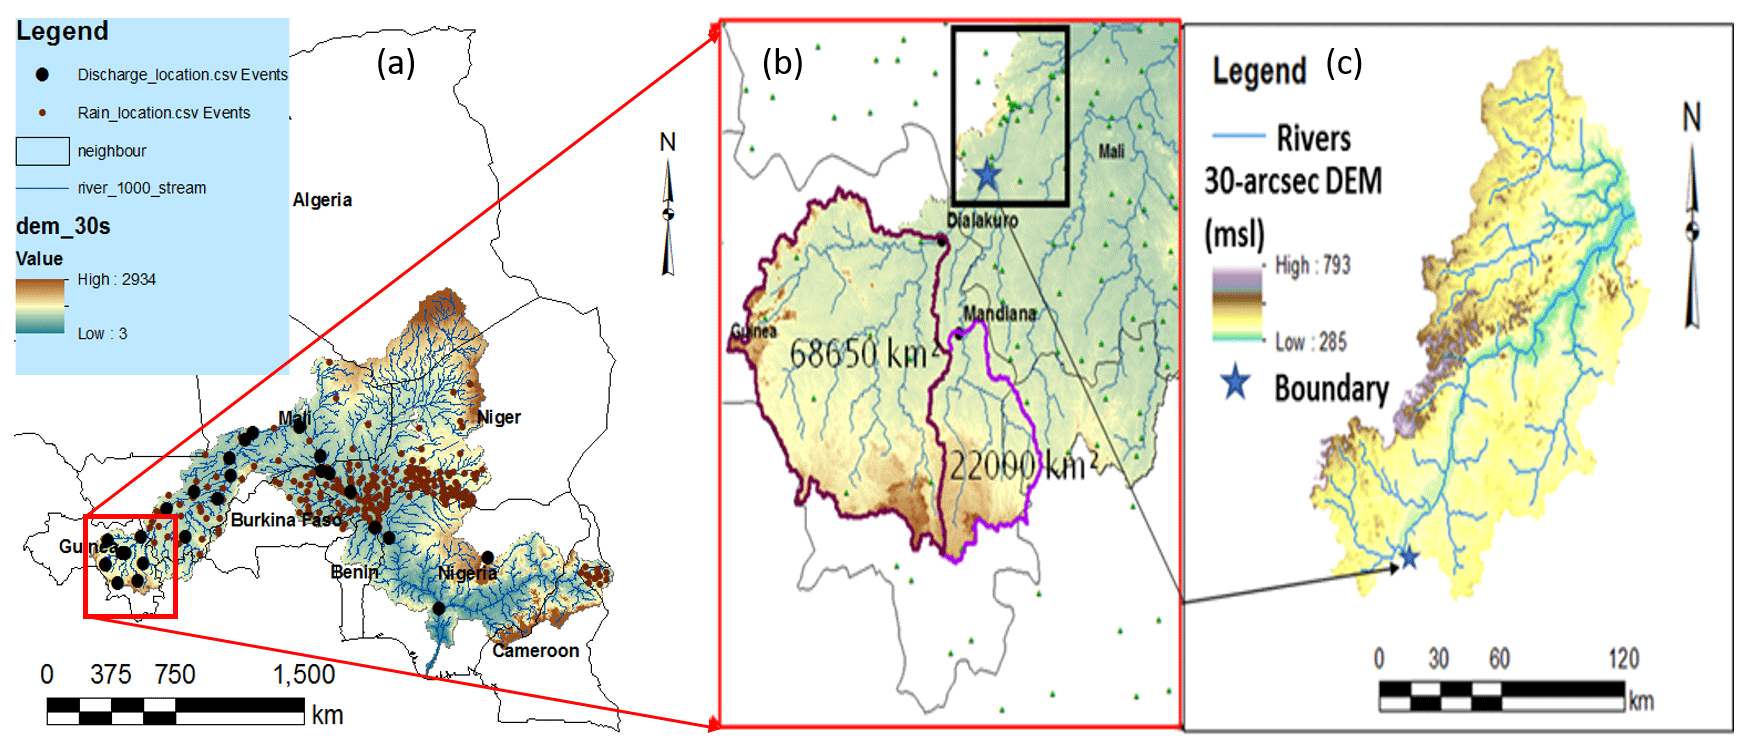
Figure 2The Niger River basin (a), the upstream area (b), and the hot spot model for Bamako city (c).
The WEB-RRI models were developed in the river basin scale (the Niger model at 4 km grid and the Volta model at 2 km grid) and flood hot spot scale (at 0.45 km grid) (Figs. 2 and 3). Flood hot spot scale models have nested within the regional scale WEB-RRI models by using upstream boundary condition river discharge, which was simulated by the regional scale WEB-RRI models.
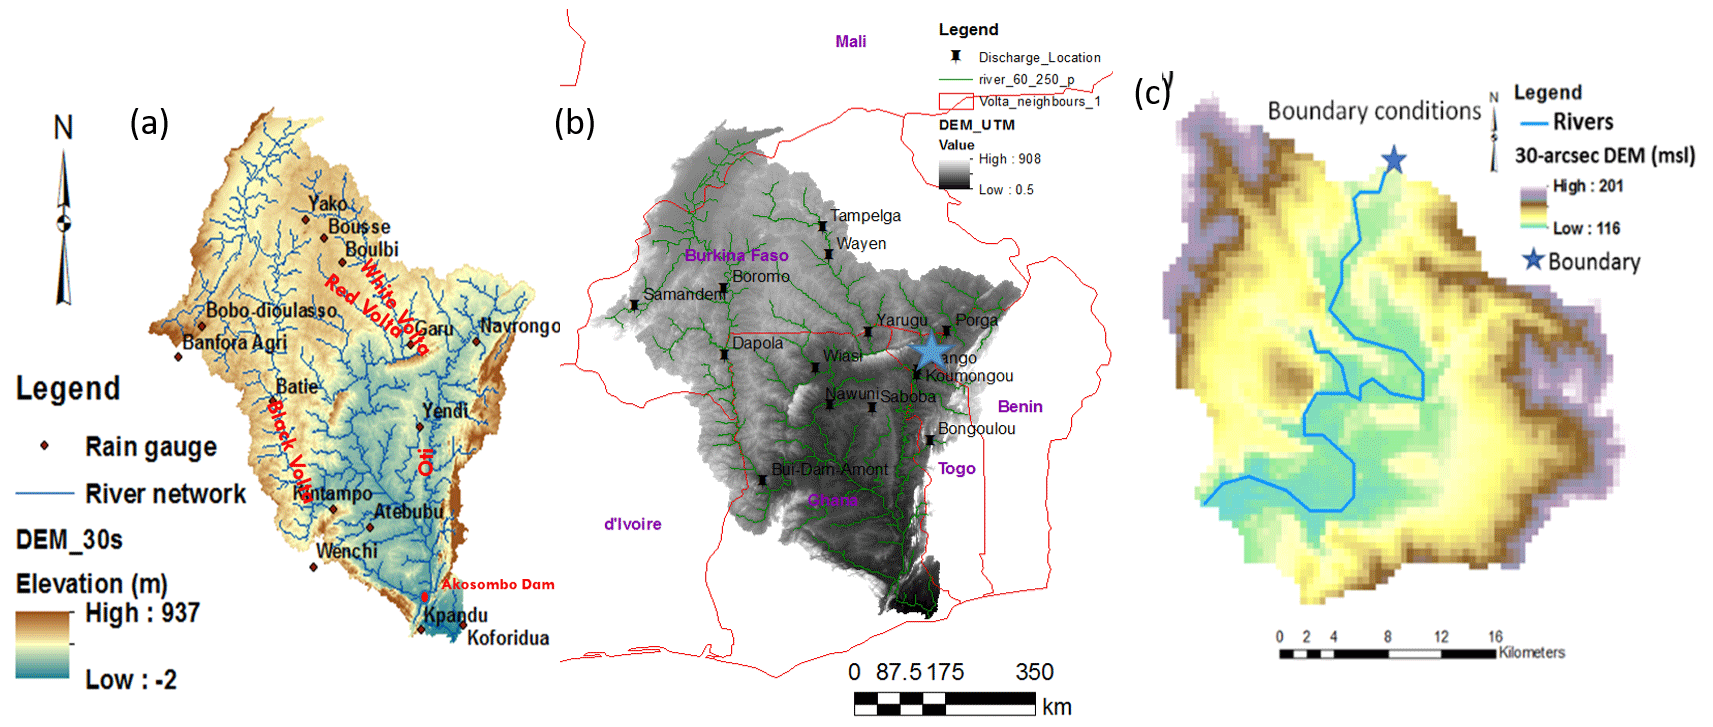
Figure 3The Volta River basin and rain gauges (a) discharge gauges (b) and hot-spot model for the Mango city (c).
Data Integration and Analysis System (DIAS) started in 2006 to collect, store, and analyze global and local data in combination with socio-economic data, and convert data into information useful for disaster/crisis management and to make this information available within Japan and overseas (https://diasjp.net/en/about/, last access: 19 April 2024). This study used the DIAS resources for data archiving, integration, model simulation, and information dissemination for the Volta and the Niger River basins.
3.1 Satellite rainfall analysis
Figure 4 is the scatter plot for the comparison between the observed data and GSMaP-NRT data at all the rain gauge locations at daily and monthly scales during 2002–2006 in the Volta River basin. As shown in the figures, the daily correlation between observed data and GSMaP-NRT data has a very low correlation (<0.3), however, the monthly correlation values are very much higher (>0.7). Similarly, the daily correlation between observed data and GSMaP-NRT data in the Niger basin has a very low correlation (<0.4), however, the monthly correlation values are very much higher (>0.8) as shown in Fig. 5. These results indicate that the applicability of GSMaP-NRT monthly data is reliable and has a high potential to be used for monthly based assessments and water resources management, however, the GSMaP-NRT data has to be bias-corrected to utilize for flood monitoring and mapping applications in these poorly gauged basins reliably.
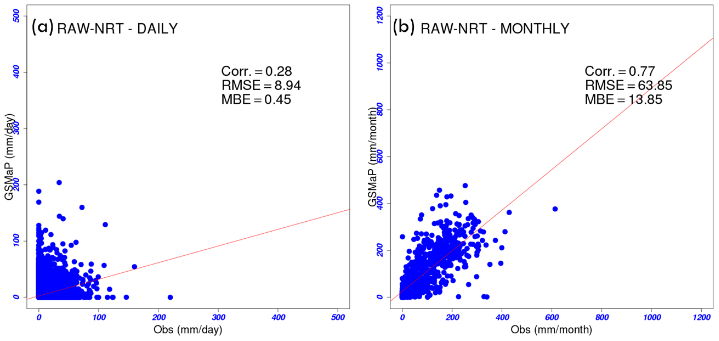
Figure 4Comparison of in-situ and GSMaP-NRT data at daily and monthly scale during 2002–2006 in the Volta River basin.
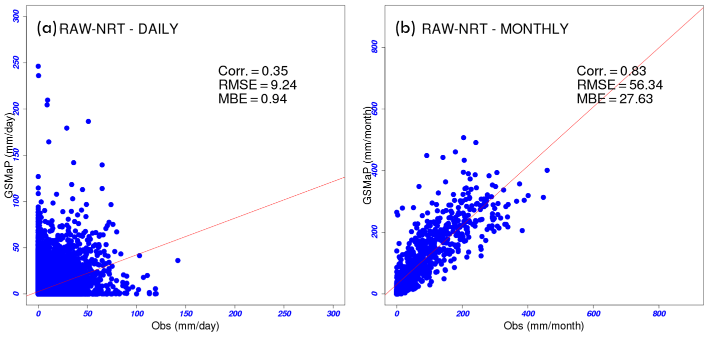
Figure 5Comparison of in-situ and GSMaP-NRT data at daily and monthly scale during 2003–2007 in the Niger River basin.
Due to the unavailability of real-time ground data, we have estimated statistical bias correction factors based on 10 d averaged products and implemented these factors in real-time flood monitoring and mapping applications. The bias correction method used in this study is the simple gradient fitting to unity. Figure 6 is the plots that compare the 10 d products of GSMaP-NRT and ground gauges before and after the bias correction for the selected rain gauges in the Volta River basin. The statistics are shown in the same plot. In this method, the correlation between GSMaP-NRT and ground observation will not be changed, however, the slope or gradient of the points will be adjusted to unity. The correction factors were calculated at each gauging point and distributed to basin scales by the Thiessen polygon method as shown in Fig. 7.
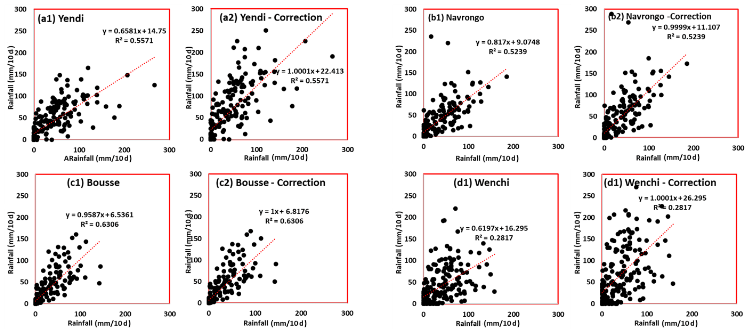
Figure 6Comparison of in-situ and GSMaP-NRT data at 10-daily and bias-correction using gradient fitting method in the Volta basin.
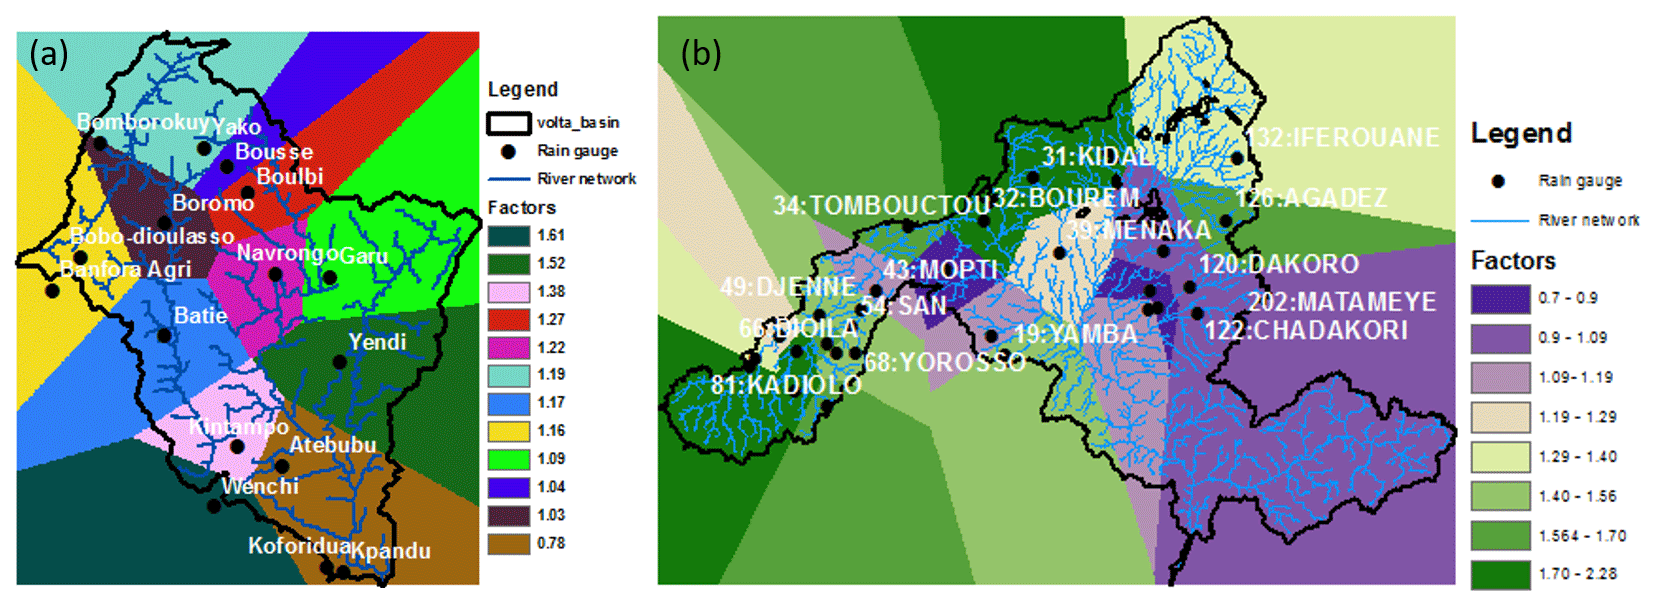
Figure 7The distributed statistical bias-correction factors for (a) the Volta River basin and (b) the Niger River basin.
3.2 Hydrological simulations
3.2.1 Model calibration
The rainfall and Discharge data from 1965 to 1970 at the limited number of stations were obtained from the Volta River Basin Authority and used for model calibration. The discharge data at Yarugu and Waisi stations were used as a boundary condition to simulate discharge data at the Nawuni station due to the unavailable of water release data from several dams in this basin (Fig. 3). Similarly, the discharge data at the Boromo station was used as a boundary condition to derive discharge data at the Dapaola station.
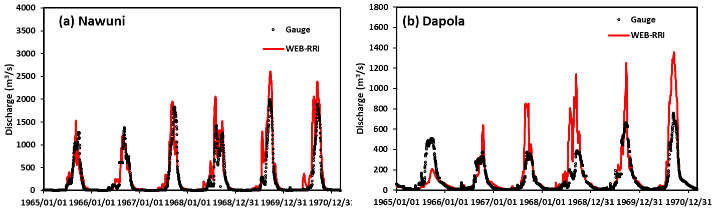
Figure 8Comparison of observed and simulated river discharges derived from observed rain data from 1965 to 1970 at (a) Nawuni and (b) Dapola Stations.
As shown in Fig. 7a, the simulated discharge at the Nuwuni gauging point is well comparable with the observed discharges during the 1965 to 1970 period. Particularly, the low-flows and peak-flows are well-matched with observed low-flows and peak-flows. The estimated performance statistics (Nash = 0.84, RMSE = 139 m3 s−1) are very high in this station during the simulation period. On the other hand, the simulated discharges for the same model parameters at the Dapola station were higher and the estimated performance statistics (Nash = 0.36, RMSE = 113 m3 s−1) were relatively poor in this station during the simulation period. The poor Nash value at this location was due to the unavailability of the dam data from the upstream regions. Unfortunately, there was no ground rainfall data was available from the upstream part of the Niger basin for the model calibration and verification. As a result, the same calibrated parameters from the Volta Basin were used for the Niger Basin simulation.
3.2.2 Model validation for GSMaP data
Figure 9 compares the observed and simulated river discharges derived from bias-corrected GSMaP-NRT data during 2004–2006 at Nawuni and Dapola stations. As shown in Fig. 9a1 and b1, the bias-corrected GSMaP-NRT data overestimated the peak flow, particularly during June, July, and September. To improve the hydrological responses of the basin, the rainfall data was further modified without changing the model assuming that the model is well calibrated using the ground data. The modification factors were identified by trial and error method for better matching of discharges, and the factors were January–May = 0.25, June = 0.5, and July = 1. As shown in Fig. 9a2 and b2, after the additional modification of the GSMaP-NRT data, the simulated discharges were well-matched with observed discharges at both locations.
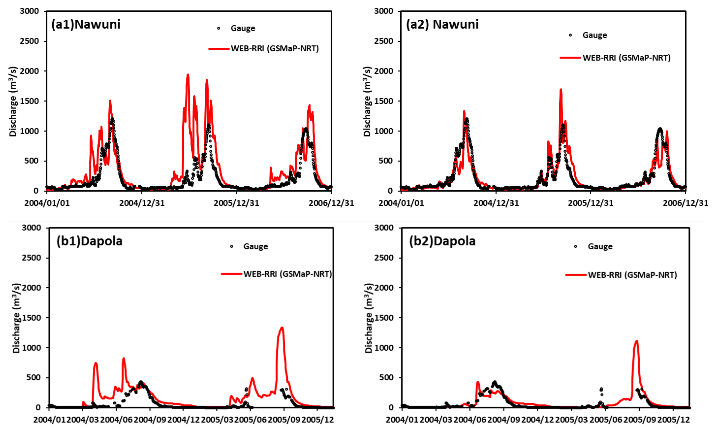
Figure 9Comparison of observed and simulated river discharges derived from bias-corrected GSMaP-NRT data at (a1) Nawuni for 10 d factors, (a2) Nawuni for 10 d factors and additional factors, (b1) Dapola for 10 d factors, and (b2) Dapola station for 10 d factors and additional factors.
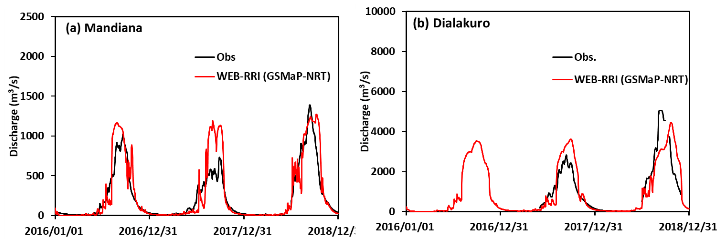
Figure 10Comparison of observed and simulated river discharges derived from bias-corrected GSMaP-NRT data during 2016–2018 using 10 d statistical factors and additional factors as similar to the Volta River basin at (a1) Madiana station and (a2) Dialakuro station.
Similarly, the bias-corrected GSMaP-NRT data, which was derived from the 10 d correction factors and additional factors (January–May = 0.25, June = 0.5, July = 1) used for simulating hydrological responses of the Niger basin. The model simulated discharge outputs were compared at the Mandiana and Dialakuro stations (Fig. 2b). As shown in Fig. 10, the simulated discharges were well-matched with observed discharges at both locations during 2016–2018. Therefore, it is confirmed that the selected bias correction method for GSMaP-NRT data is applicable for generating reliable flow information in both basins.
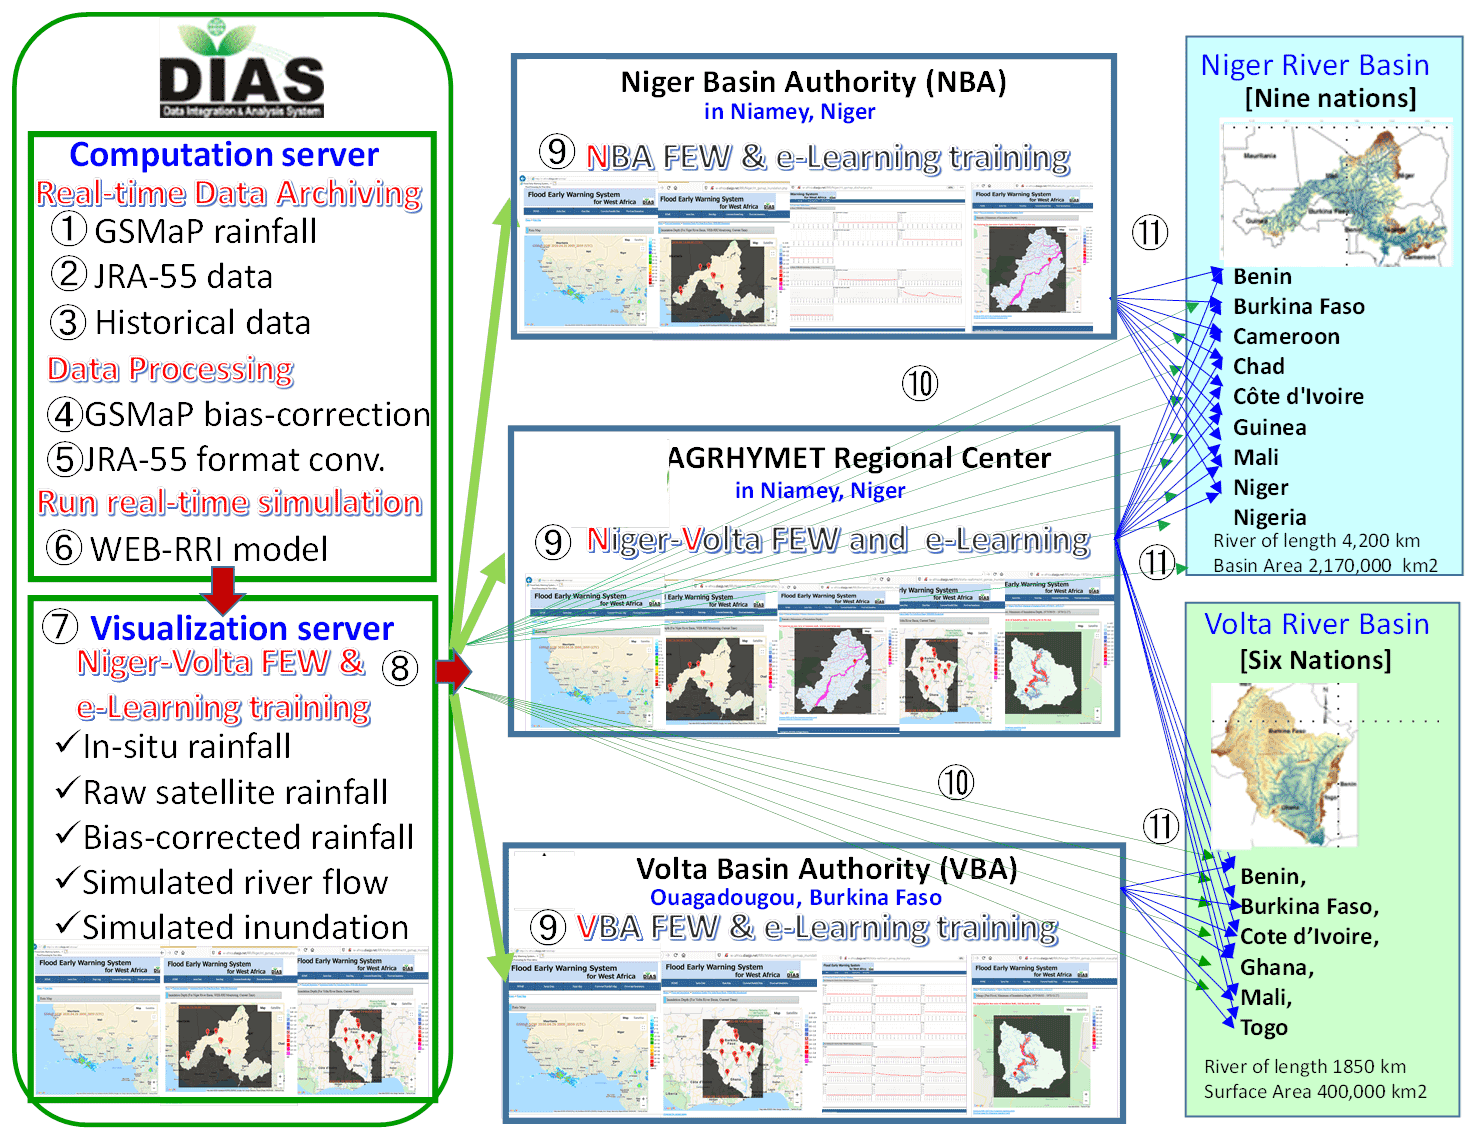
Figure 11Schematic diagram of the regional FEWS in DIAS for the Niger and Volta River basins (DIAS logo was from https://diasjp.net/, last access: 19 April 2019).
3.3 Implementation of FEWS in DIAS
FEWS in the Volta and the Niger River basin were implemented on Data Integration and Analysis System (DIAS) as shown in Fig. 11. As shown in the figures, the near real-time GSMaP rainfall and other data are archived on DIAS (Steps 1–2). In Step 3, historical rainfall data of Niger-Volta basins are manually uploaded on DIAS, which also allows the automatic uploading of the real-time in-situ data of each gauge. In Steps 4–5, DIAS converts archived data into the unified data format and conducts a bias correction of the GSMaP rainfall. The WEB-RRI models of Niger-Volta basins are run and simulated outputs of flood discharge and inundation depth are visualized on DIAS (Step 7). In Step 8, model outputs and in-situ, raw, and bias-corrected GSMaP rainfall are processed for downloading.
The FEWS services are crucial for flood risk management and the sustainable development of the nations. The Niger and the Volta River basins in West Africa do not have adequate data to implement FEWS for the effective management of water-related disasters. This study developed an FEWS in both river basins by utilizing available ground data, near-real-time satellite rainfall products, and a water and energy budget-based hydrological model.
The daily correlation between observed data and GSMaP-NRT data has a very low correlation (<0.4), however, the monthly correlation values are much higher (>0.7) in both river basins. To utilize the GSMaP-NRT data for flood monitoring and mapping applications in these poorly gauged basins reliably, the statistical bias correction factors based on 10 d averaged products were estimated and implemented these factors in real-time flood monitoring and mapping applications. The WEB-RRI model was developed at both basins to simulate the hydrological responses of the basins. It is found that discharge estimated for the bias-corrected GSMaP-NRT data has overestimated the discharges, particularly during June, July, and September. To improve the hydrological responses of the basin, the rainfall data was further modified by trial and error method by matching the simulated discharges with observed discharges. It is found that the distributed 10 d correction factors together with additional rainfall factors (January–May = 0.25, June = 0.5, July = 1) can simulate discharges well as compared to observed discharges at Madiana and Dialakoro of Niger basin and Nawuni and Dapola of Volta basin.
The FEWSs in the Volta and the Niger River basin were implemented in DIAS by utilizing the statistical bias-correction method and the calibrated WEB-RRI model in both Niger and Volta River basins. The FEWS system executes the near-real-time GSMaP satellite rainfall bias-correction processes and feeds to the WEB-RRI model with natural flow conditions (i.e. without considering upstream dam impacts due to the absence of dam inflow and outflow data). The future activity of this research will focus on improving the system further by archiving more data from relevant authorities in the West African region.
Data and code used in the study are available and can be obtained from the corresponding author.
All the authors contributed to the conceptualization, methodology, analysis, and writing.
At least one of the (co-)authors is a guest member of the editorial board of Proceedings of IAHS for the special issue “ICFM9 – River Basin Disaster Resilience and Sustainability by All”. The peer-review process was guided by an independent editor, and the authors also have no other competing interests to declare.
Publisher's note: Copernicus Publications remains neutral with regard to jurisdictional claims made in the text, published maps, institutional affiliations, or any other geographical representation in this paper. While Copernicus Publications makes every effort to include appropriate place names, the final responsibility lies with the authors.
This article is part of the special issue “ICFM9 – River Basin Disaster Resilience and Sustainability by All”. It is a result of The 9th International Conference on Flood Management, Tsukuba, Japan, 18–22 February 2023.
This paper was edited by Mamoru Miyamoto and reviewed by two anonymous referees.
Floodlist News in Africa: Breaking News 3 days ago – Guatemala – 25 000 Affected by Heavy Rain, Floods and Landslides West Africa – Floods Hit Burkina Faso and Northern Ghana, http://floodlist.com/africa/west-africa-burkinafaso-ghana-september-2020 (last access: 22 April 2024), 8 September 2020.
Kubota, T., Aonashi, K., Ushio, T., Shige, S., Takayabu, Y. N., Kachi, M., Arai, Y., Tashima, T., Masaki, T., Kawamoto, N., Mega, T., Yamamoto, M. K., Hamada, A., Yamaji, M., Liu, G., and Oki, R.: Global Satellite Mapping of Precipitation (GSMaP) Products in the GPM Era, in: Advances in Global Change Research, 355–373, Advances in Global Change Research, vol. 67, Springer, https://doi.org/10.1007/978-3-030-24568-9_20, 2020.
Rasmy, M., Sayama, T., and Koike, T.: Development of Water and Energy Budget-based Rainfall Runoff-Inundation Model (WEB-RRI) and Its Verification in the Kalu and Mundeni River Basins, Sri Lanka, J. Hydrol., 579, 124163, https://doi.org/10.1016/j.jhydrol.2019.124163, 2019.
Rasmy, M., Yasukawa, M., Ushiyama, T., Tamakawa, K., Aida, K., Seenipellage, S., Hemakanth, S., Kitsuregawa, M., and Koike, T.: Investigations of Multi-Platform Data for Developing an Integrated Flood Information System in the Kalu River Basin, Sri Lanka, Water, 15, 1199, https://doi.org/10.3390/w15061199, 2023.