the Creative Commons Attribution 4.0 License.
the Creative Commons Attribution 4.0 License.
 | 19 Apr 2024
Evaluation of satellite precipitation products for real-time extreme river flow modeling in data scarce regions
Mohamed Rasmy
Toshio Koike
Inadequacy of spatio-temporal hydro-climatic data limits the efficacy of hazard monitoring and disaster risk reduction activities in disaster-prone areas. Various satellite missions are recently providing climate data, but prior evaluation and enhancement of these data are necessary for a reliable application. In this study, we conducted performance evaluation and enhancement of three real-time satellite precipitation products (SPPs) (GSMaP, GPM-IMERG, and PERSIANN) for flood modeling in the Blue Nile basin. The bias correction improved the original SPPs, with the largest improvement being for factors generated from 10 d mean data. Flood event hydrograph indicated satisfactory results of error metrics on the devastating flood event of 2012. Employing reliable physical–based distributed hydrologic models provided longer lead time and high-accuracy flood simulation. Furthermore, the results indicate that integrating available initial observed precipitation data improved the efficiency of SPPs simulation, and hence are applicable in operational flood monitoring.
- Article
(1911 KB) - Full-text XML
- BibTeX
- EndNote


Floods are major water-related disasters that affect millions of people around the world. As non-structural measures, flood forecasting and real-time monitoring require gathering essential quantitative information for effective water resource management and disaster risk reduction. In recent times, active remote sensing instruments have greatly improved, providing detailed information with a high spatio-temporal resolution. Consequently, the number of available satellite precipitation products (SPPs) has increased, along with the quality of the data they generate (Illingworth et al., 2015). However, to reliably employ SPPs in hydrological modelling, it is necessary to validate and enhance their performance beforehand. This evaluation is essential because the accuracy of SPPs is influenced by various factors such as sampling uncertainty, indirect observation errors, and type of inversion algorithm (Lo Conti et al., 2014).
Moreover, the demand for real-time datasets in disaster risk monitoring is on the rise, especially among policymakers and disaster relief officials, as it enables evidence-based decision-making. In addition, real-time data are invaluable for researchers and scientists studying disaster patterns and trends. Numerous studies have assessed the effectiveness of satellite-borne precipitation datasets in rivers flow modelling (Gebregiorgis and Hossain, 2013; Kubota et al., 2007; Ushio et al., 2009). Moreover, Zhou et al. (2021, 2022) developed SPPs bias correction methods to improve the applicability of the SPPs to an evaluation of the adequacy of observation stations for hydrologic modeling. Real-time bias correction requires the determination of an effective correction factor based on past simulations for usage in various applications. These bias correction techniques can be utilized for correcting real-time SPPs as well as climate forecasts. In this study, we applied spatiotemporal windows to perform bias correction and evaluate both the original and bias-corrected SPPs.
Impact assessment of floods and drought requires reliable physical–based Distributed Hydrologic Models (DHMs) for a comprehensive understanding of the various hydrological components. We employed the Water Energy Budget Rainfall Runoff Inundation (WEB-RRI) model, which incorporates water and energy budget processes to model flood onset timing, peak flood discharge, and inundation characteristics (Rasmy et al., 2019). Hydrological extreme projections in the Blue Nile basin indicated the need for actions on climate change adaptation and disaster risk reduction (Tedla et al., 2022). Moreover, the Blue Nile Basin is not immune to flash floods, which can cause severe damage and loss of life. Hence the entire approach is expected to assist climate change adaptation efforts by providing hydrological extremes forecasting of a catchment. The objective is to enhance the accuracy and lead-time of near real-time SPP on extreme flood modeling with a high degree of confidence. The combined application of real time data, bias corrections and simulation models is expected to enhance flood early warning and disaster risk reduction activities in transboundary river basin.
The Blue Nile, the largest tributary of the Nile Basin (Fig. 1), which covers a catchment area of about 312 000 km2 and provides 62 % of the flow at the Aswan Dam (World Bank, 2006). The basin is characterized by rugged topography and a considerable variation in altitude, ranging from about 350 m above sea level (m a.s.l.) at Khartoum to over 4250 m a.s.l. in the Ethiopian highlands (Easton et al., 2012).
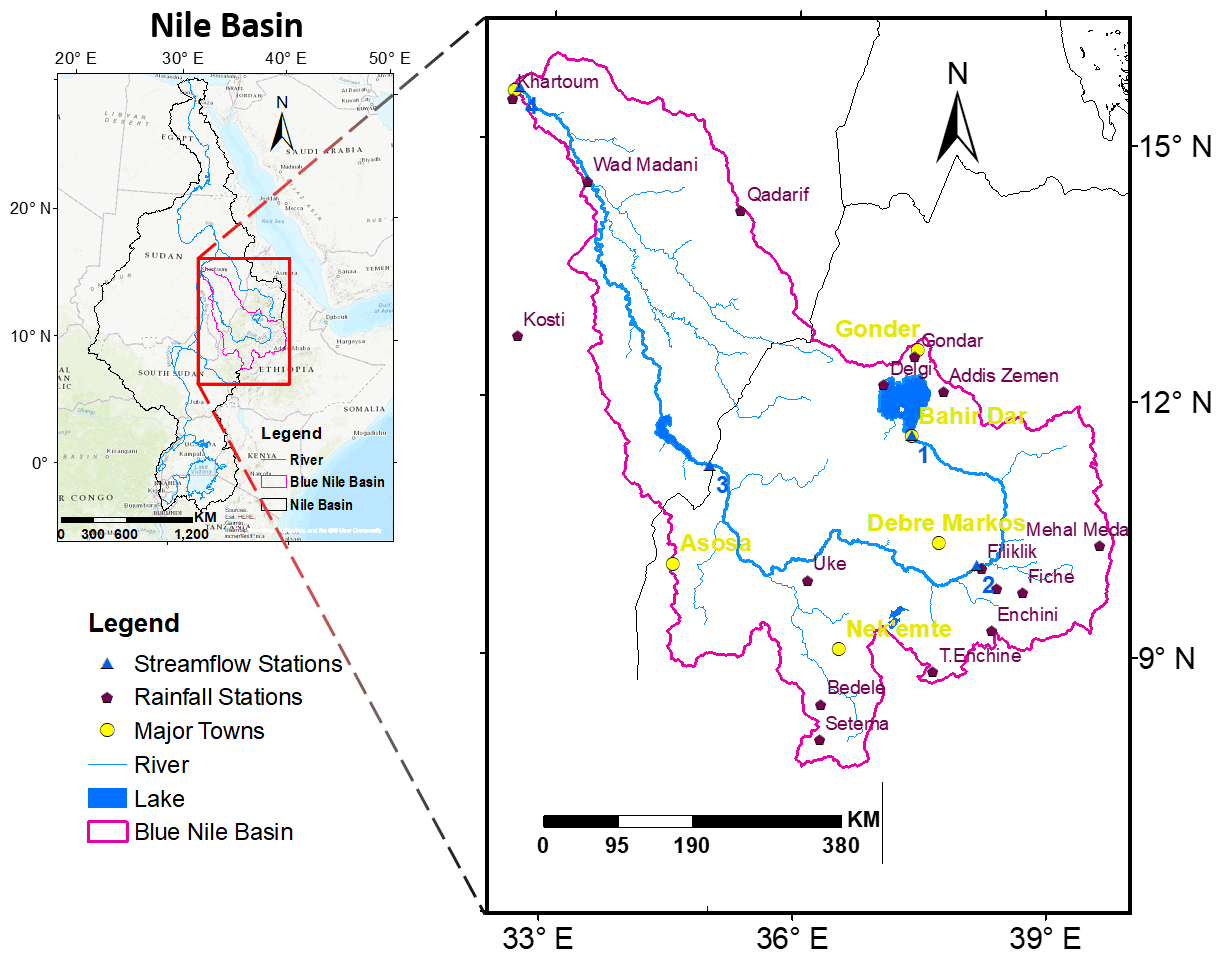
Figure 1The Blue Nile basin and observation stations. Base map source: ESRI.
3.1 Gauged data
Observed daily precipitation data from 24 observation stations upstream of the Blue Nile river basin have been collected for the period 2003–2012 (Fig. 1). Similarly, observed river discharge data have been collected from the Abbay near Kessie flow observation station. The flow at this station is used for model setup by calibration (2003–2005) and validation (2006–2012) periods.
3.2 Satellite precipitation products (SPPs)
Three open-source SPPs with high spatial and temporal resolution have been used for flood modelling evaluation. The SPPs are selected for their availability at a real time. As shown in (Fig. 2), the grid based SPPs provide good spatial distribution compared to the point based observed datasets (Fig. 2a).
3.2.1 GSMaP-NRT
The Global Satellite Mapping of Precipitation-Near-Real-Time (GSMaP-NRT) version 6 data, provided by Earth Observation Research Center, Japan Aerospace Exploration Agency (JAXA), was obtained at a daily time step with 0.1° × 0.1° resolution and 4 h latency, Fig. 2b. The GSMaP is produced based on a Kalman filter-based CMORPH model that refines the precipitation rate propagated based on the atmospheric moving vector derived from MW sensors (Ushio et al., 2009). The data can be accessed from https://sharaku.eorc.jaxa.jp/GSMaP/ (last access: 14 April 2022).
3.2.2 IMERG-Early
The Integrated Multi-satellitE Retrievals for Global Precipitation Measures (IMERG) algorithm combines information from the Global Precipitation Measurement (GPM) satellite constellation to estimate precipitation over the majority of the Earth's surface. For this study, we used the IMERG Early Precipitation Level 3 (0.1° × 0.1° resolution) V06 at daily intervals derived from the half-hourly, Fig. 2c (Tan et al., 2019). The latest product for half hourly in near-real time at 4 h latency was downloaded from: https://disc.gsfc.nasa.gov/ (last access: 26 May 2022).
3.2.3 PERSIANN-CCS
Precipitation Estimation from Remotely Sensed Information using Artificial Neural Networks-Clouds Classification System (PERSIANN-CCS), a real-time global precipitation product was obtained with high-resolution (0.04° × 0.04°), Fig. 2d. It enables the categorization of cloud-patch features based on cloud height, areal extent, and variability of texture estimated from satellite imagery (Nguyen et al., 2019). The data can be accessed from: https://chrsdata.eng.uci.edu/ (last access: 26 August 2022).
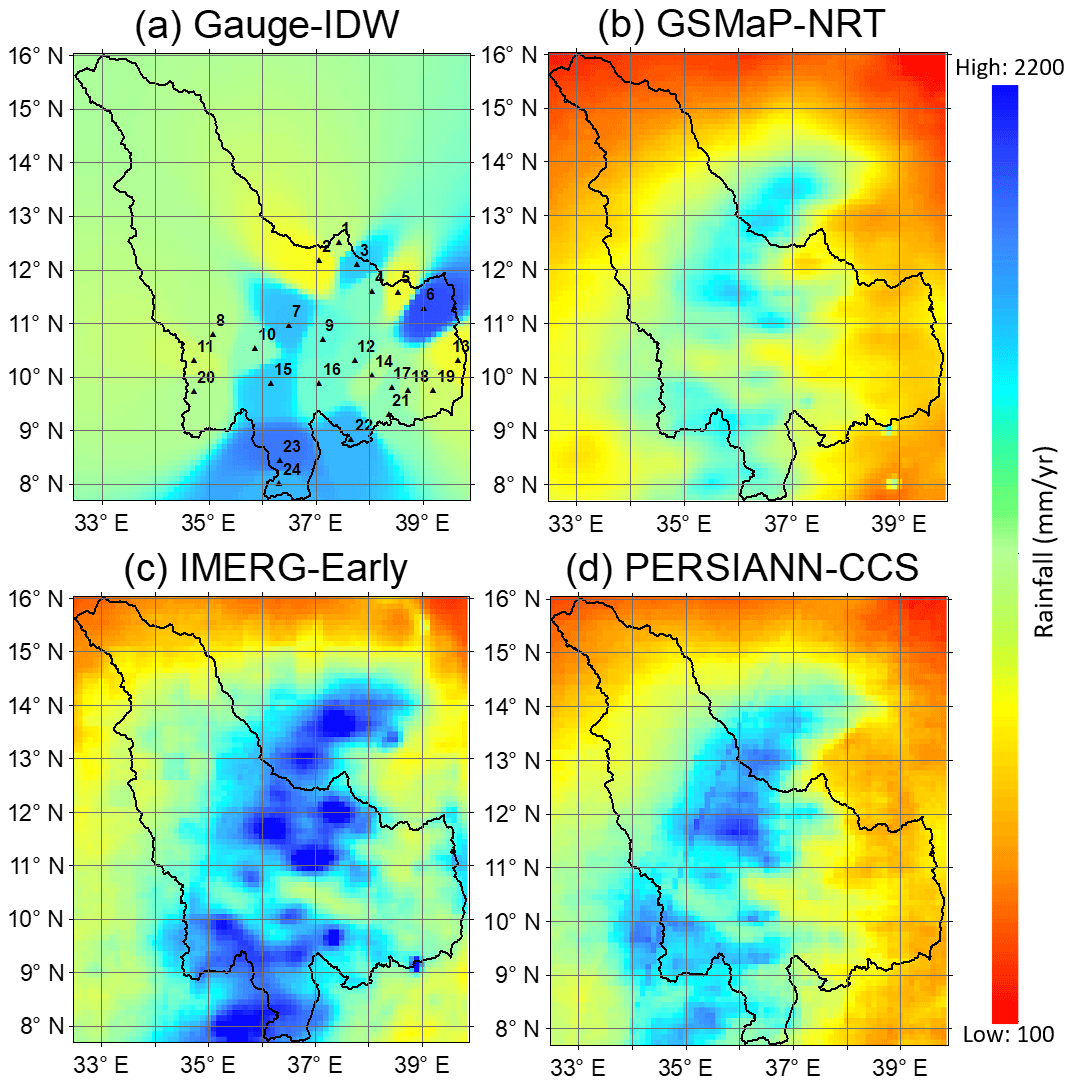
Figure 2Annual average precipitation in Blue Nile basin between (2003–2012).
3.3 SPPs bias-correction method
The rainfall bias correction method for SPPs correction was selected here in light of the availability and distribution of observation data. For the application of bias correction factors, we used the Ratio bias correction at each gauge stations. The factors are computed at a 10 d and monthly average time step (rather than the original daily data window). This approach aids in eliminating errors in observation and outliers in daily observation. The technique involves utilizing each observation stations to convert three closest SPP grids into point data. Accordingly, the correction equations are modified as necessary to accommodate this modification.
where Fk is the correction factor; Pg,k is the gauge, and Ps,k is the SPP estimates for k stations average.
After that, the bias-corrected SPPs are calculated as
where Pscor(i,j) represents the corrected estimates of the original SPPs (Ps(i,j)) at grid cell (i,j).
3.4 Hydrologic model forcing data
Model inputs such as air temperature, wind speed, shortwave downward radiation, longwave radiation, specific humidity, and surface pressure, were obtained from the Japanese 55 year Reanalysis (JRA-55) data prepared by the Japan Meteorological Agency (JMA) (Kobayashi et al., 2015). Global products for terrestrial evapotranspiration (ET) were prepared using MODIS version 08. The MOD16A2 terrestrial ET products were estimated using an improved algorithm by Mu et al. (2011). These data were interpolated to model grid resolutions of 1 arcmin.
3.5 Discharge simulation and evaluation
For extreme flow simulation, the SPPs were simulated using the Water Energy Budget-based Rainfall-Runoff-Inundation (WEB-RRI) model, a physically based distributed model. WEB-RRI is structured into four major modules to evaluate water and energy fluxes, low flow estimation, flood onset timing, peak flood discharge, and inundation characteristics (Rasmy et al., 2019). The model estimates overland flow by separating surface and groundwater with the 2-D diffusive wave module derived from the continuity, momentum and Manning's equations. The river routing of river channel within each slope grid cell is estimated using a 1-D diffusive wave equations.
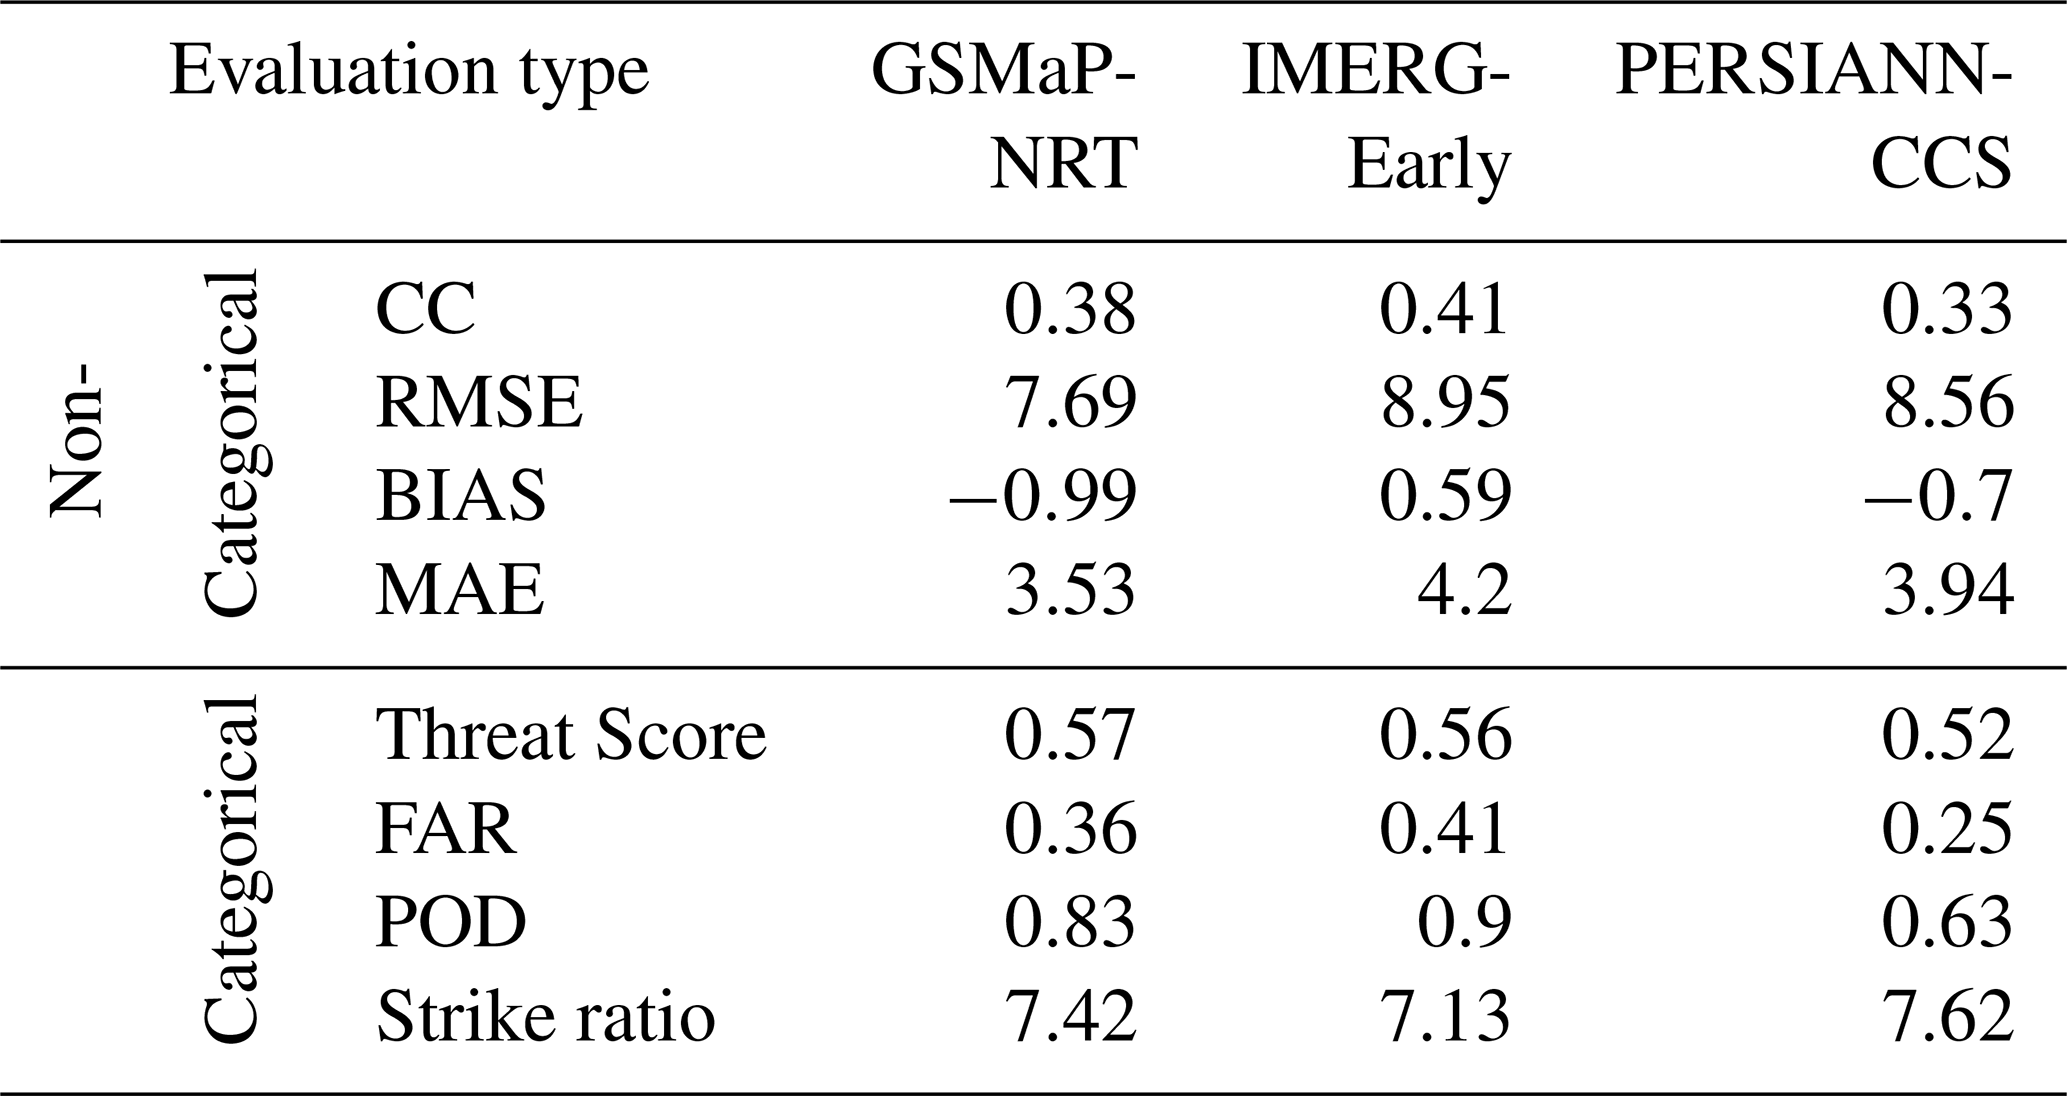
For performance evaluation, categorical statistical indices, such as the threat score (TS), false-alarm ratio (FAR), probability of detection (POD), and strike ratio (SR) which evaluates how well the SPPs match to the gauged data, were employed. Non-categorical statistical error metrics measures, Correlation Coefficient (CC), Nash–Sutcliff equation (NSE), Mean Average Error (MAE), Mean Bias Error (MBE) and root-mean-squared error (RMSE) were used for model performance (i.e., the strengths and weaknesses of the model). The peak flood events hydrograph was evaluated for extreme flood event from observed discharge with discharge from SPPs simulation using the statistical error metrics.
4.1 SPPs performance with gauged data
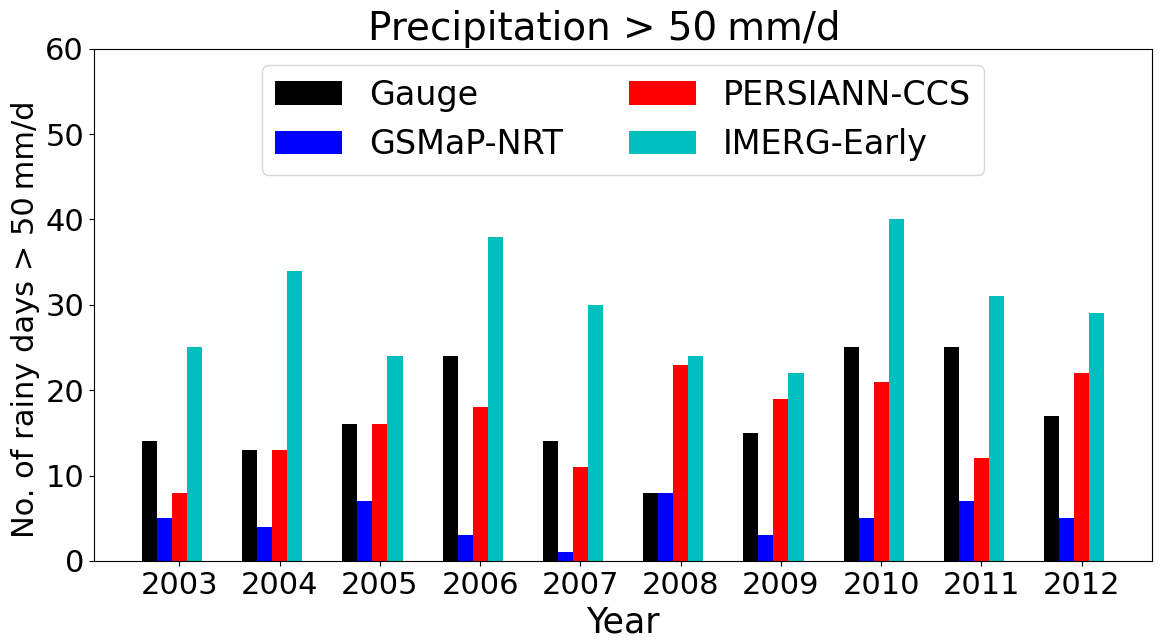
The grid-based satellite precipitation products (SPPs) were transformed into point data using the inverse distance weighting method for evaluating with the observation data. When comparing the original SPPs estimates against the observation data, it was observed that the IMERG-Early original data overestimate both the mean and peak rainfall. In contrast, the GSMaP-NRT and PERSIANN-CCS estimates were observed to be underestimates (as depicted in Fig. 3).
Further, categorical and non-categorical indices analyses results of the original SPPs comparison indicates that all the SPPs (GSMaP-NRT, IMERG-Early and PERSIANN-CCS) exhibited poor correlation with the observation data. These findings indicate the necessity for improvement of the SPPs.
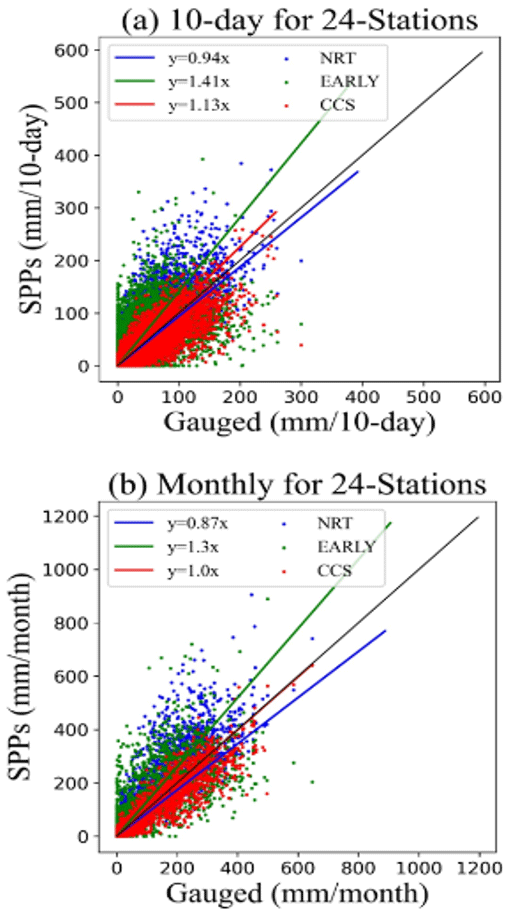
Consequently, a bias correction was carried out to enhance the accuracy of the SPPs and assesses the performance difference between the two windows datasets (i.e. 10 d mean and monthly). To calculate the bias correction factor for each SPP, regression analysis was employed with the observation data. The three stations, near each observation location, are used to convert the gridded SPPs into point data for generating correction factors through regression. The scatterplots of SPPs for the two correction windows are presented in Fig. 4.
4.2 Flow evaluations
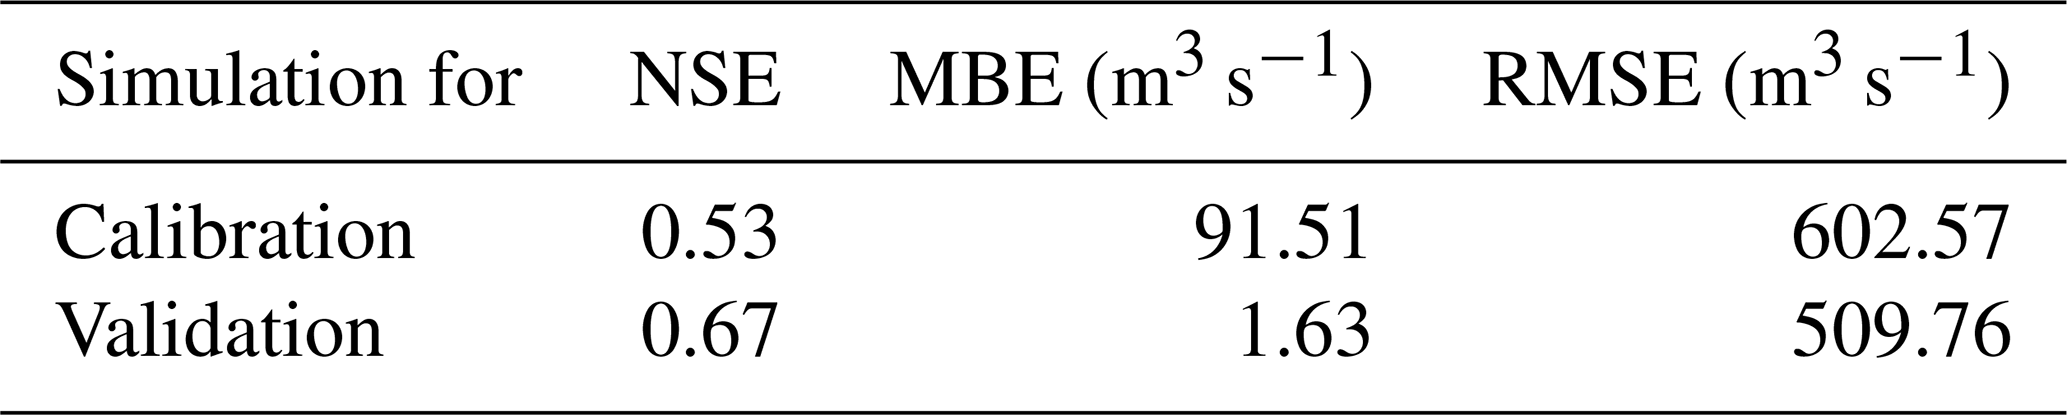
The WEB-RRI model was calibrated and validated, and the result indicates satisfactory range of error indices, as presented in Table 2.
Afterwards, discharge simulation of original and bias corrected SPPs was conducted to evaluate the performance of bias correction in reproducing the hydrograph of the flood event period. The results demonstrated that the bias correction significantly enhanced the simulation skills for each SPPs with the extreme flow hydrograph and error metrics (Fig. 5).
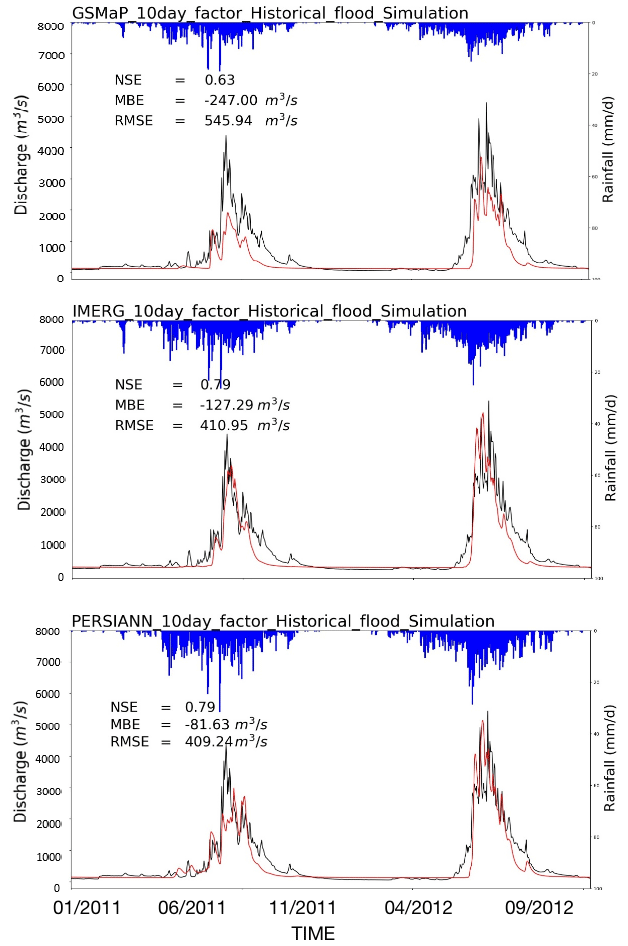
Figure 5Flow hydrograph for observation and bias corrected SPPs with the best performing correction factors.
The results of each SPP, original and bias corrected simulations (with 10 d and monthly correction factors) performance were assessed with peak hydrograph and error metrics. These results indicate that the 10 d mean window performed better in improving the accuracy and reliability of the SPPs for discharge simulation.
4.3 Flood event simulation
To enhance the applicability of real time flood estimation with the catchment characteristics, we conducted an investigation on the lead time and accuracy of SPPs in WEB-RRI model. This investigation considered an observed extreme event that occurred in July 2012. As shown in Fig. 6, real time dataset simulations provides lead time of SPPs up to 78 h with higher accuracy at the downstream of the Blue Nile in Sudan. Moreover, when the model was driven by real-time SPPs integrated with initial observed conditions, the accuracy of the model significantly improved, resulting to an acceptable error metrics index with longer lead time.
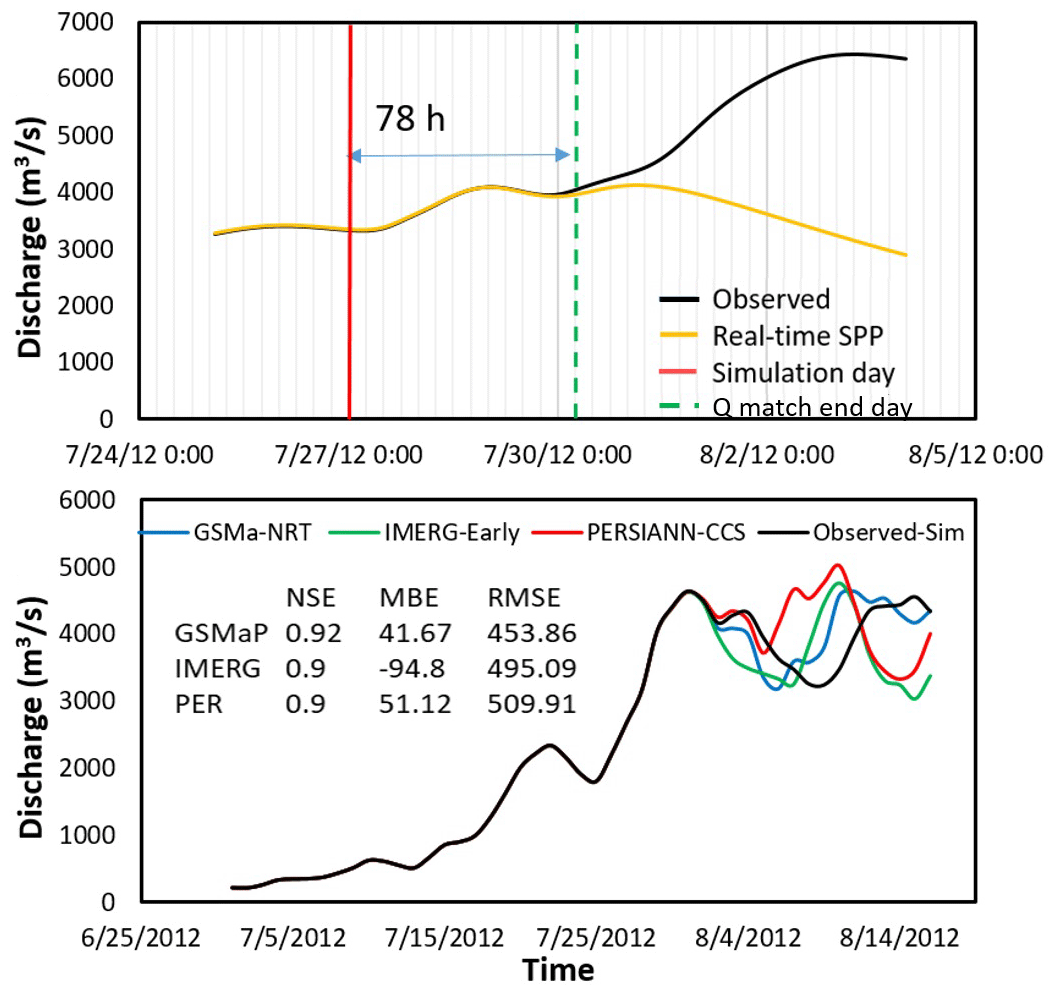
Figure 6Performance comparison of (a) real-time SPPs lead time and (b) integrated simulation of observed and SPPs.
From the results obtained in this study, the following conclusions can be drawn regarding the applicability of SPPs to flood monitoring:
-
The applicability of bias correction methods significantly improved the accuracy of the SPPs in simulating river flow and floods modelling.
-
The study utilized three independent real-time SPPs (GSMaP, GPM–IMERG, and PERSIANN) for the simulation of river flow and floods. The results revealed that all are applicable with variations in the performance of these products.
-
By evaluating the lead time and accuracy of SPPs, it was found that the models driven by real-time SPPs can predict floods with acceptable errors ranges for timely and reliable flood forecasting and disaster preparedness.
-
The findings of this study have practical implications for informed decision making in flood preparedness, mitigation, and response in transboundary river basins.
The hydrologic model (WEB-RRI) codes and descriptions are detailed in the subsequent publication: Rasmy et al. (2019). The SPPs data were obtained from open-source datasets, with access links provided in the data description section. Observed data requests should be directed to the respective institutions. Some of the datasets and codes employed for data processing are available at Zenodo [codes] via the following links: https://doi.org/10.5281/zenodo.10835234 (Tedla, 2024).
Conceptualization, investigation, methodology, software and visualization, MGT and MR; Data curation, formal analysis, MGT and LZ; Funding acquisition, project administration, resources, supervision and validation, MR and TK; writing – original draft, MGT; writing – review and editing, MGT, MR and TK.
At least one of the (co-)authors is a guest member of the editorial board of Proceedings of IAHS for the special issue “ICFM9 – River Basin Disaster Resilience and Sustainability by All”. The peer-review process was guided by an independent editor, and the authors also have no other competing interests to declare.
Publisher's note: Copernicus Publications remains neutral with regard to jurisdictional claims made in the text, published maps, institutional affiliations, or any other geographical representation in this paper. While Copernicus Publications makes every effort to include appropriate place names, the final responsibility lies with the authors.
This article is part of the special issue “ICFM9 – River Basin Disaster Resilience and Sustainability by All”. It is a result of The 9th International Conference on Flood Management, Tsukuba, Japan, 18–22 February 2023.
The authors would like to thank GSMaP (JAXA), GPM-IMERGE (NASA) and the PERSIANN (UCI-CHRS) for providing the SPP data for analysis, model simulations and evaluation. We thank the Ethiopian National Meteorology Institute and the Ministry of Water and Energy for the observed datasets. We also acknowledge anonymous reviewers for their comments and suggestions that improved this manuscript.
This paper was edited by Mamoru Miyamoto and reviewed by two anonymous referees.
Easton, Z. M., Awulachew, S. B. Steenhuis, T. S., Habte, S. A., Zemadim, B., Seleshi, Y., and Bashar, K. E.: Hydrological process in the Blue Nile, IWMI Books, Reports H045313, International Water Management Institute, 2012.
Gebregiorgis, A. S. and Hossain, F.: Understanding the Dependence of Satellite Rainfall Uncertainty on Topography and Climate for Hydrologic Model Simulation, IEEE T. Geosci. Remote, 51, 704–718, https://doi.org/10.1109/TGRS.2012.2196282, 2013.
Illingworth, A. J., Barker, H. W., Beljaars, A., Ceccaldi, M., Chepfer, H., Clerbaux, N., Cole, J., Delanoë, J., Domenech, C., Donovan, D. P., Fukuda, S., Hirakata, M., Hogan, R. J., Huenerbein, A., Kollias, P., Kubota, T., Nakajima, T., Nakajima, T. Y., Nishizawa, T., Ohno, Y., Okamoto, H., Oki, R., Sato, K., Satoh, M., Shephard, M. W., Velázquez-Blázquez, A., Wandinger, U., Wehr, T., and van Zadelhoff, G.-J.: The EarthCARE satellite: the next step forward in global measurements of clouds, aerosols, precipitation, and radiation, B. Am. Meteorol. Soc., 96, 1311–1332, https://doi.org/10.1175/BAMS-D-12-00227.1, 2015.
Kobayashi, S., Ota, Y., Harada, Y., Ebita, A., Moriya, M., Onoda, H., Onogi, K., Kamahori, H., Kobayashi, C., and Endo, H.: The JRA-55 reanalysis: General specifications and basic characteristics, J. Meteorol. Soc. Jpn. Ser. II, 93, 5–48, 2015.
Kubota, T., Shige, S., Hashizume, H., Aonashi, K., Takahashi, N., Seto, S., Hirose, M., Takayabu, Y. N., Ushio, T., Nakagawa, K., Iwanami, K., Kachi, M., and Okamoto, K.: Global precipitation map using satellite-borne microwave radiometers by the GSMaP project: Production and validation, IEEE T. Geosci. Remote, 45, 2259–2275, https://doi.org/10.1109/TGRS.2007.895337, 2007.
Lo Conti, F., Hsu, K.-L., Noto, L. V., and Sorooshian, S.: Evaluation and comparison of satellite precipitation estimates with reference to a local area in the Mediterranean Sea, Atmos. Res., 138, 189–204, https://doi.org/10.1016/j.atmosres.2013.11.011, 2014.
Mu, Q., Zhao, M., and Running, S. W.: Improvements to a MODIS global terrestrial evapotranspiration algorithm, Remote Sens. Environ., 115, 1781–1800, https://doi.org/10.1016/j.rse.2011.02.019, 2011.
Nguyen, P., Shearer, E. J., Tran, H., Ombadi, M., Hayatbini, N., Palacios, T., Huynh, P., Braithwaite, D., Updegraff, G., Hsu, K., Kuligowski, B., Logan, W. S., and Sorooshian, S.: The CHRS Data Portal, an easily accessible public repository for PERSIANN global satellite precipitation data, Sci. Data, 6, 180296, https://doi.org/10.1038/sdata.2018.296, 2019.
Rasmy, M., Sayama, T., and Koike, T.: Development of water and energy Budget-based Rainfall-Runoff-Inundation model (WEB-RRI) and its verification in the Kalu and Mundeni River Basins, Sri Lanka, J. Hydrol., 579, 124163, https://doi.org/10.1016/j.jhydrol.2019.124163, 2019.
Tan, J., Huffman, G. J., Bolvin, D. T., and Nelkin, E. J.: IMERG V06: Changes to the Morphing Algorithm, J. Atmos. Ocean. Tech., 36, 2471–2482, https://doi.org/10.1175/JTECH-D-19-0114.1, 2019.
Tedla, M. G.: Satellite Precipitation Products data performance evaluation with observed datasets, Zenodo [code and data set], https://doi.org/10.5281/zenodo.10835234, 2024.
Tedla, M. G., Rasmy, M., Tamakawa, K., Selvarajah, H., and Koike, T.: Assessment of Climate Change Impacts for Balancing Transboundary Water Resources Development in the Blue Nile Basin, Sustainability, 14, 15438, https://doi.org/10.3390/su142215438, 2022.
Ushio, T., Sasashige, K., Kubota, T., Shige, S., Okamoto, K., Aonashi, K., Inoue, T., Takahashi, N., Iguchi, T., Kachi, M., Oki, R., Morimoto, T., and Kawasaki, Z.-I.: A Kalman Filter Approach to the Global Satellite Mapping of Precipitation (GSMaP) from Combined Passive Microwave and Infrared Radiometric Data, J. Meteorol. Soc. Jpn. Ser. II, 87A, 137–151, https://doi.org/10.2151/jmsj.87A.137, 2009.
World Bank: Africa Development Indicators 2006: From the World Bank Africa Database, The World Bank, 2006.
Zhou, L., Rasmy, M., Takeuchi, K., Koike, T., Selvarajah, H., and Ao, T.: Adequacy of Near Real-Time Satellite Precipitation Products in Driving Flood Discharge Simulation in the Fuji River Basin, Japan, Appl. Sci., 11, 3, https://doi.org/10.3390/app11031087, 2021.
Zhou, L., Koike, T., Takeuchi, K., Rasmy, M., Onuma, K., Ito, H., Selvarajah, H., Liu, L., Li, X., and Ao, T.: A study on availability of ground observations and its impacts on bias correction of satellite precipitation products and hydrologic simulation efficiency, J. Hydrol., 610, 127595, https://doi.org/10.1016/j.jhydrol.2022.127595, 2022.