the Creative Commons Attribution 4.0 License.
the Creative Commons Attribution 4.0 License.
 | 19 Apr 2024
Attributing weather patterns to Davao River extreme rainfall from Reanalysis and GCM
Ralph Allen Acierto
Tomoki Ushiyama
Toshio Koike
Extreme rainfall or heavy rainfall events (HREs) causes significant socio-economic damages annually affecting local development especially in developing countries. Thus, assessing changes in frequency and magnitude of HREs under climate change using global climate model (GCM) projections became ubiquitous to hydrological impact studies. Here, we present a framework for evaluating GCM's ability in reproducing the seasonal frequency of HREs in Davao River basin and the associated weather patterns that led to HREs. Our results show that HREs in MRI-AGCM 3.2S occurred 81 % in DJF and 4 % in JJA, which showed over(under) estimation bias during DJF(JJA) season compared to ERA5 HREs that show occurrence of 50 % in DJF and 18 % in JJA. Furthermore, we examined the weather pattern and anomalies that led to anomalous conditions of the season specific HREs in Davao River basin, which showed MRI-AGCM3.2S was able to reproduce the general structure of anomalous conditions fairly well on both seasons in comparison with ERA5. However, the slight over(under)estimation of the surface anomalous conditions in DJF(JJA) are directly proportional to the over(under)estimation in rainfall magnitude in the basin.
- Article
(3463 KB) - Full-text XML
- BibTeX
- EndNote


Climate information is crucial to water resource and disaster risk reduction management due to the high sensitivity of water resource systems to climate variabilities worsened by global warming (Clark et al., 2016). So, investigating future climate and changes in flood hazard for basin-scale assessment using projections from general circulation models (GCM) has been widely adopted (e.g. Wood et al., 1997; Fowler et al., 2007; Teutschbein and Seibert, 2010; Breuer et al., 2017). One of the key factors in determining future flood hazard are the occurrence of extreme events such as heavy rainfall events, which received particular focus due to potential increase of future disaster damages and likely increase shown by GCM projections (Pfahl et al., 2017; Neelin et al., 2022). For hydrological impact assessments, rainfall time-series including the heavy rainfall events come from dynamically downscaled GCM projections to provide physically consistent variables and subsequently bias-corrected. However, naive application of dynamical downscaling of GCM projections and subsequent application of bias-correction can potentially lead to unintended consequences of over-correction of climate model simulations and overconfidence in the climate change signal from global models (Clark et al., 2016). Recent reviews (Clark et al., 2016; Meresa et al., 2022) on providing hydrological extremes advocate in characterizing and reducing uncertainties within each of the steps of the impact assessment modeling chain. Furthermore, naive application of bias-correction techniques disregards the fact that its application fundamentally assumes a skillful GCM (or RCM) as input (Maraun, 2016).
Essentially, credible climate information relies on the understanding of climate model biases (Maraun et al., 2017) to appropriately reduce the uncertainty coming from utility of downscaling methods and bias-correction in providing for hydrological applications. However, commonly used GCM assessments typically focus on either purely statistical or purely process-oriented indices. Furthermore, common bias-correction methods were highly developed on the statistical or mathematical but it remains underdeveloped in considering process-related information (Maraun et al., 2017).
In this study, we present a framework combining the utility of statistics and process-related understanding in evaluating a GCM's ability to reproduce heavy rainfall events in a study river basin coincident with significant large-scale conditions. We present a framework for evaluating high-resolution GCMs for representing large-scale conditions that are coincident with the extreme rainfall or heavy rainfall event (HRE) in a river basin. We used ERA5 as reference dataset, which has a comparable model resolution of around 27 km, for evaluating the 20 km resolution model MRI-AGCM 3.2 (MRI-AGCM 3.2S). We also illustrate a framework for linking significant hydrological events or heavy rainfall event (HREs) to the large-scale or synoptic features in the region. There are two main components of this framework: (1) assessment of GCM's ability to reproduce the seasonal frequency of the annual HREs; and (2) identification of large-scale/synoptic conditions in ERA5 for seasonal HREs in the river basin and compare it with large-scale/synoptic conditions from MRI-AGCM 3.2S for respective seasons. The framework establishes the baseline for identifying significant weather patterns related to HREs in Davao river basin using ERA5. Then, it utilizes the identified weather patterns of seasonal HREs as reference for assessing the capability of a high-resolution GCM called MRI-AGCM 3.2S to reproduce similar weather patterns of seasonal HREs.
This type of assessment is necessary for defining the limitation of high-resolution GCMs in reproducing seasonal HREs and associated weather patterns, which can be used for in event based scenario modeling under a storyline approach (Shepherd, 2019) for climate adaptation studies. This assessment also informs critical information to the GCM's utility for dynamical downscaling and appropriate selection and/or necessity of bias-correction method.
2.1 Data
In this study, the following datasets were used:
-
Daily rainfall data from synoptic stations of Philippine Atmospheric, Geophysical and Astronomical Services Administration (PAGASA) from 1980 to 2016 for Davao, Malaybalay, General Santos, Cotabato, Surigao, Lumbia, Butuan, Hinatuan, Zamboanga, and Dipolog. Rainfall data were interpolated using Cressman-barnes method to make a gridded rainfall dataset that was masked by Davao River shapefile to get the basin rainfall.
-
Daily surface variables (rainfall, mean-sea-level-pressure or MSLP, surface wind components u10 and v10) and pressure-level variables (zonal and meridional wind, temperature, relative humidity, geopotential height from fifth generation of ECMWF atmospheric reanalyses (ERA5, Hersbach et al., 2020) from 1979 to 2018.
-
Same variables selected in ERA5 from Japan's Meteorological Research Institute (MRI) Atmospheric General Circulation Model (AGCM) 3.2S (Mizuta et al., 2012) with a period of 1979–2003. This GCM is a part of the on-going efforts in increasing the accuracy of GCM projections such as the on-going efforts on the World Climate Research Programs' Comprehensive Model Inter-comparison Project (CMIP). The MRI-AGCM outputs have been used in various programs such as CORDEX (Gutowski et al., 2016), HighResMIP(Haarsma et al., 2016), and Japan's domestic assessment studies (Mori et al., 2021) creating regional climate information for impact assessment and adaptation studies (Ito et al., 2020). MRI-AGCM 3.2 has showed good reproducibility on the regional precipitation globally (Ito et al., 2020) and improvements to representation of tropical cyclones (Murakami et al., 2011, 2012).
2.2 Methodology
We selected HREs in the river basin using basin-averaged rainfall from raingauge observation using annual block maxima (ABM) and peak-over-threshold (POT) method. For the POT method, we used a 99th percentile threshold. To provide comparison with basin-averaged rainfall from raingauge, we calculated the area-averaged (area is between 7 and 8° latitude and 125 to 126° longitude) rainfall for ERA5 and MRI-AGCM 3.2S.
First, we selected HREs using ABM and POT method were analysed to characterize the seasonal frequency in the river basin from raingauge, ERA5, and MRI-AGCM 3.2S. We focused on the dominant monsoon seasons in the months of June–July–August (JJA) for southwest monsoon and December–January–February (DJF) for northeast monsoon.
Second, we used the POT method for selecting seasonal HREs for ERA5 and MRI-AGCM 3.2S for respective periods shown in Table 1. We calculated the composites of surface variable for the HREs of JJA and DJF season. We assessed the ability of MRI-AGCM 3.2S in reproducing HREs through comparison with ERA5. Composite weather patterns were calculated as the mean of corresponding variables during the selected HREs. In addition, anomaly composites were also calculated and were based on 1979–2003 seasonal climatology. We focused on anomalous wind and pressure characteristics of the HRE composites to understand its difference with seasonal conditions over Davao river basin.
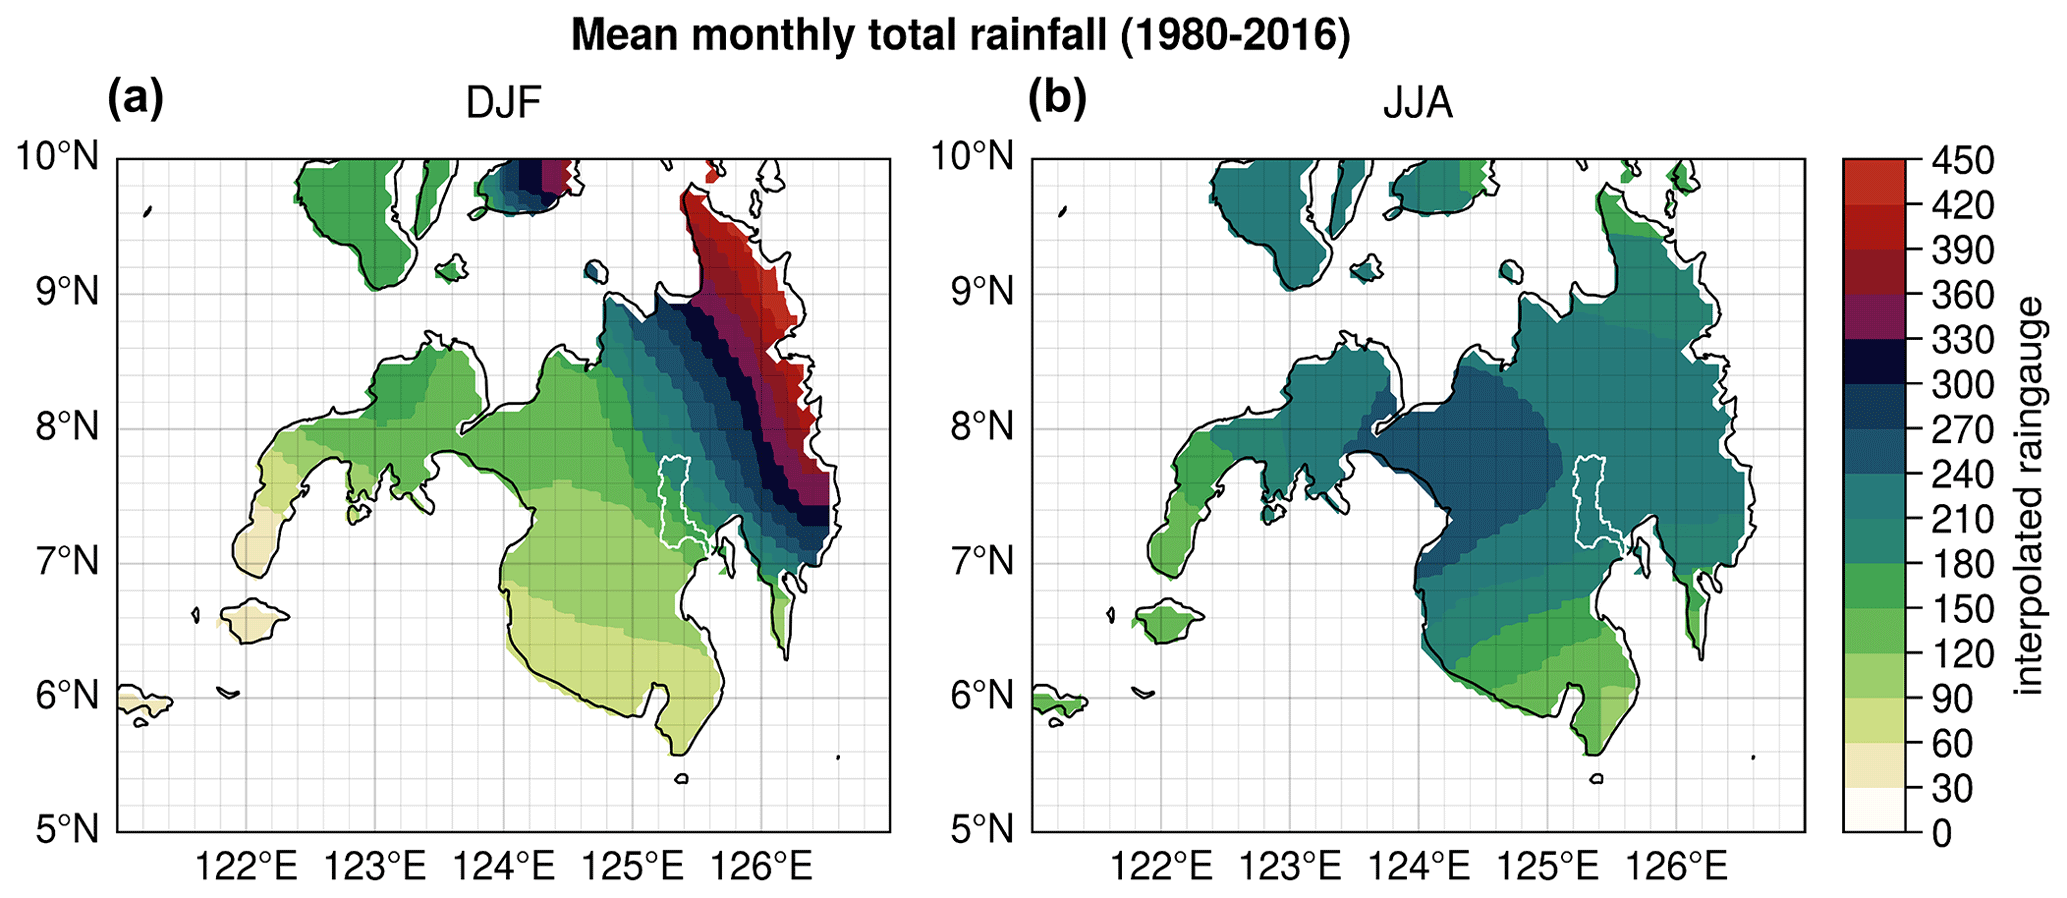
Figure 1Mean monthly total rainfall for DJF and JJA seasons in Mindanao Island using interpolated rainfall data from PAGASA stations.
2.3 Study Area and basin rainfall characteristics
The study area (shown in Fig. 1) is the Davao river basin with an area of 1700 km2 is located in Mindano island of the Philippines. Figure 1 shows the summary of rainfall over the Davao River basin, where the basin-averaged climatology and annual maximum rainfall was extracted within the river basin. Wet period occurs during months of May to October while the dry period occurs in the months of November to April of the next year. As shown in Fig. 1, DJF season shows rainfall gradient consistent with a northeast monsoon flow with a maximum rainfall occurring on the eastern coasts, which is near the northeastern boundary of the Davao River basin. For JJA season, the island receives higher volume of rainfall with smaller variations spatially but with some maximum located on the west-northwestern coasts coinciding with south-southwest monsoon flows, which is on western boundary of the river basin. The study basin was selected due to the occurrence of HREs in DJF and JJA season that has very distinct large-scale conditions.
This section is organized into two main sections: Davao River HRE statistics (Sect. 3.1), and Climatology of seasonal HREs from ERA5 and MRIAGCM3.2S (Sect. 3.2). Section 3.1 discusses on two main points: (1) reliability of ERA5 as a reference dataset by comparing it with the raingauge dataset; and (2) assessment of the GCM as compared with the ERA5 dataset. On the other hand, Sect. 3.2 focuses on the description of synoptic conditions coincident with the occurrence of HREs in the study basin. We primarily use composite analysis to compare MRI-AGCM 3.2S with ERA5.
3.1 Davao River HRE statistics
The extreme rainfall or heavy rain events (HREs) for Davao River basin are selected using ABM method, which is summarized in Tables 1 and 2. As shown in Table 1, raingauge observations show that the highest frequency of HRE events occur 38 % in December–January–February (DJF) season and 24 % in June–July–August (JJA) season.
Table 1Percent Frequency (Events) of Selected HRE using ABM.
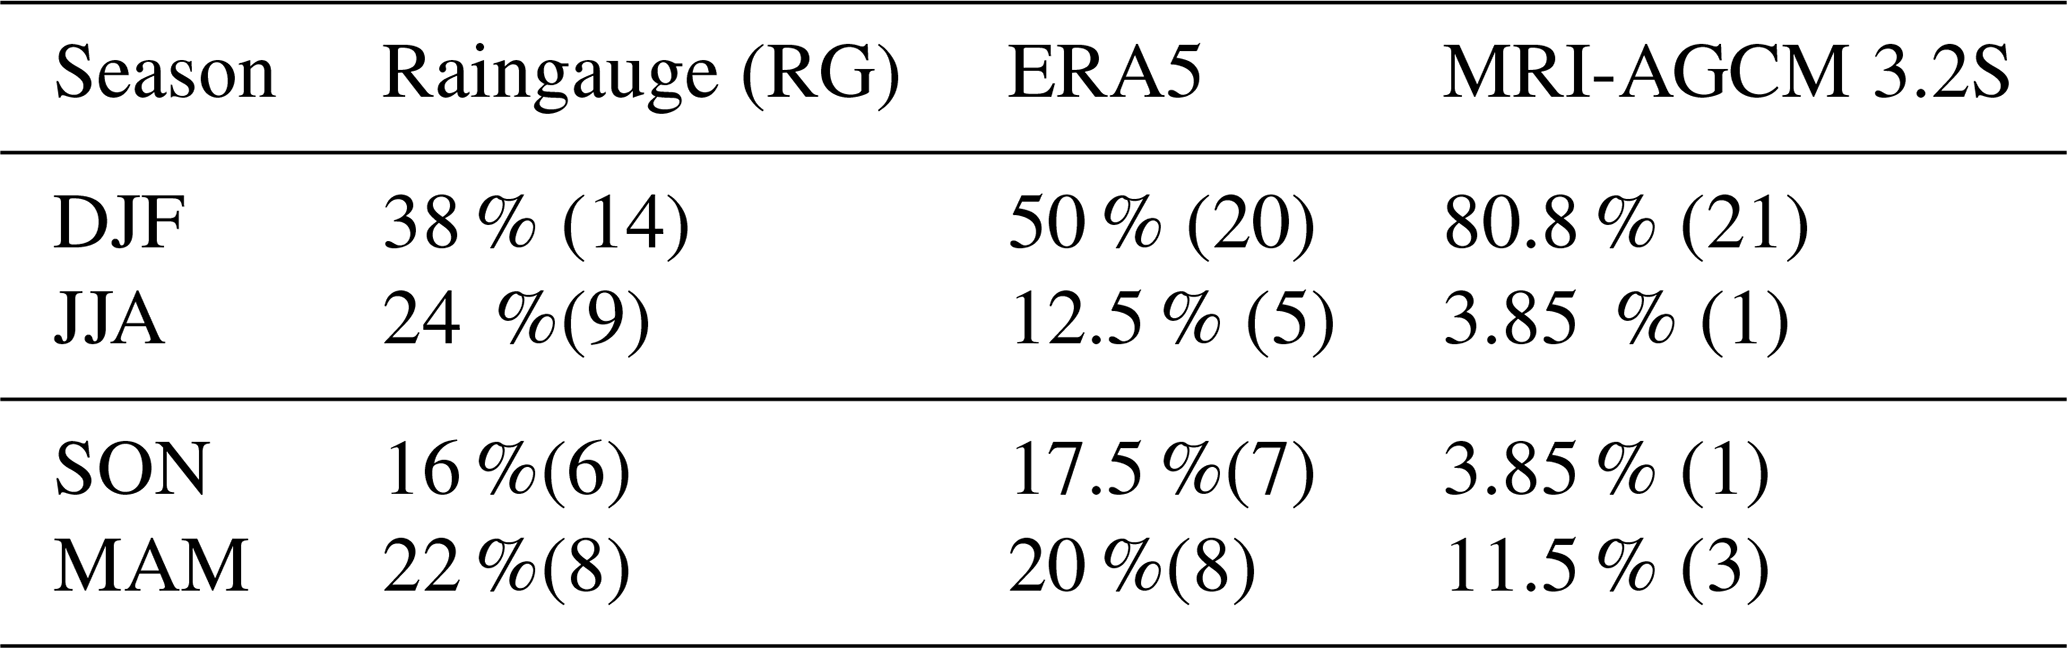
Note: Data (period) – raingauge (1980–2016), ERA5 (1979–2018), and MRI-AGCM3.2S (1979–2003)
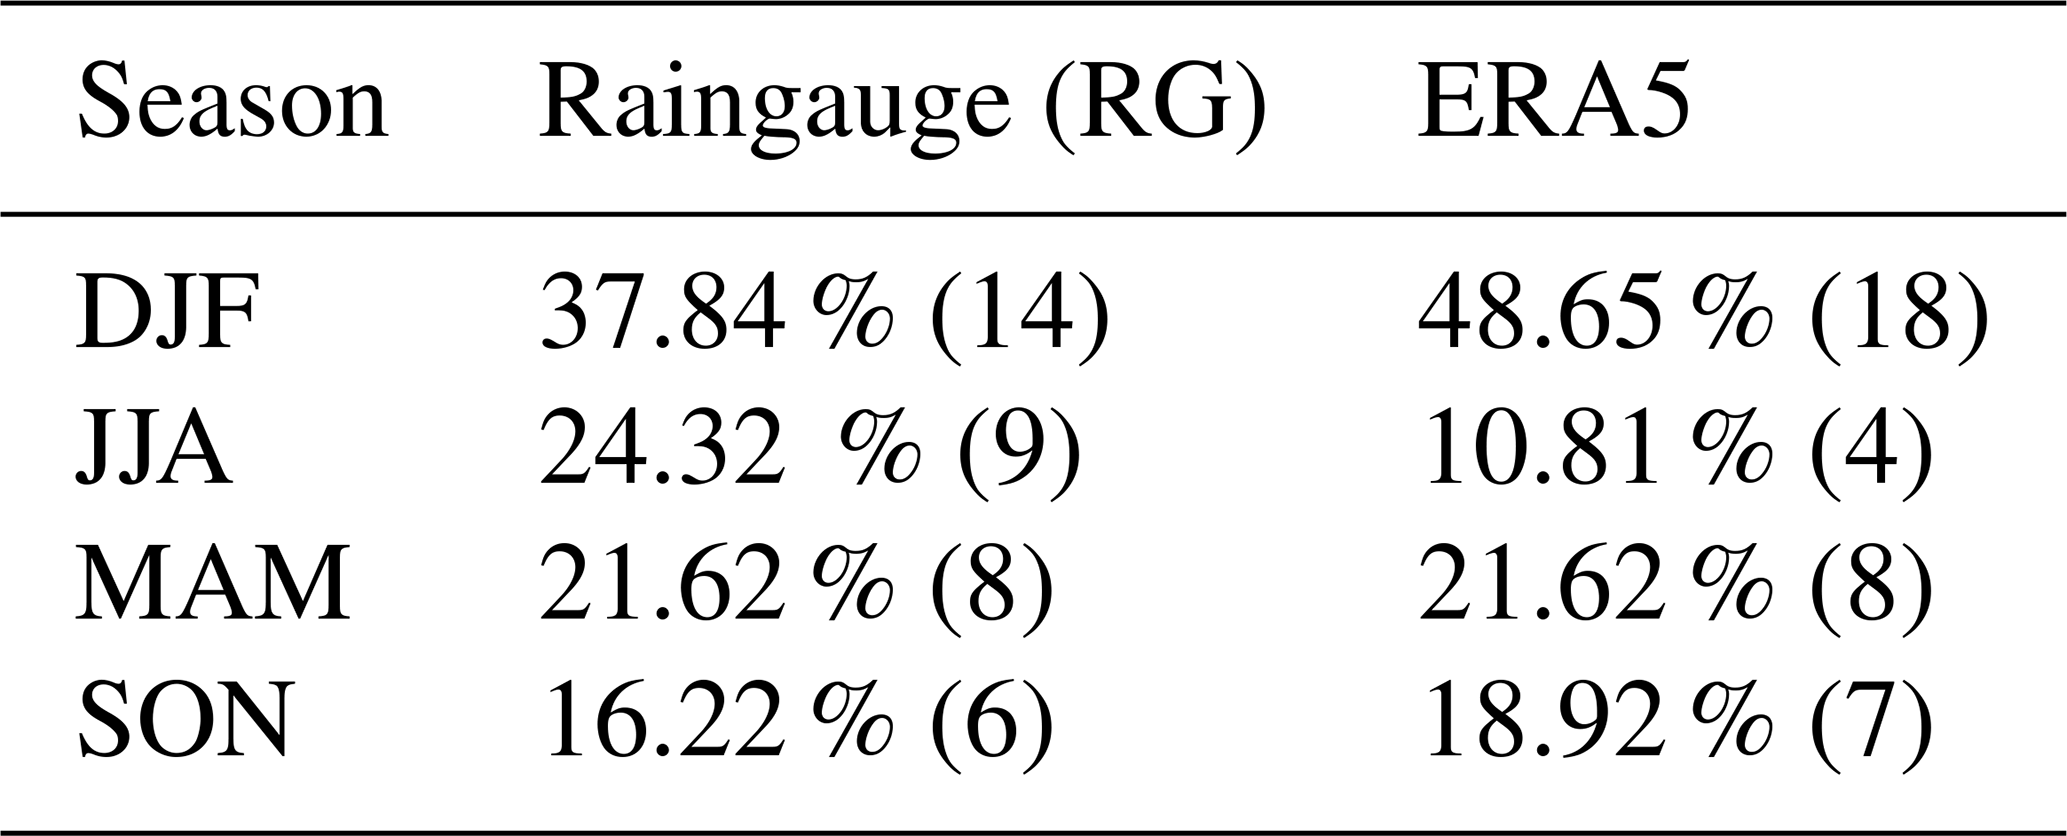
To establish ERA5 as a reference, ERA5 was compared with the raingauge observations using the same period from 1980 to 2016, which is summarized in Fig. 2a and shown in Table 2. As shown by the boxplot comparison showing the mean-normalized HRE rainfall amount, ERA5 shows a comparable range but with slightly higher variance than raingauge observations. ERA5 shows good correspondence with seasonal frequency of the selected HREs but with over(under)estimation for DJF(JJA) seasons. The frequency bias is partly due to the coarse resolution of ERA5. Overall, ERA5 shows a good skill in representing the seasonal frequency and mean-normalized HRE rainfall amount.
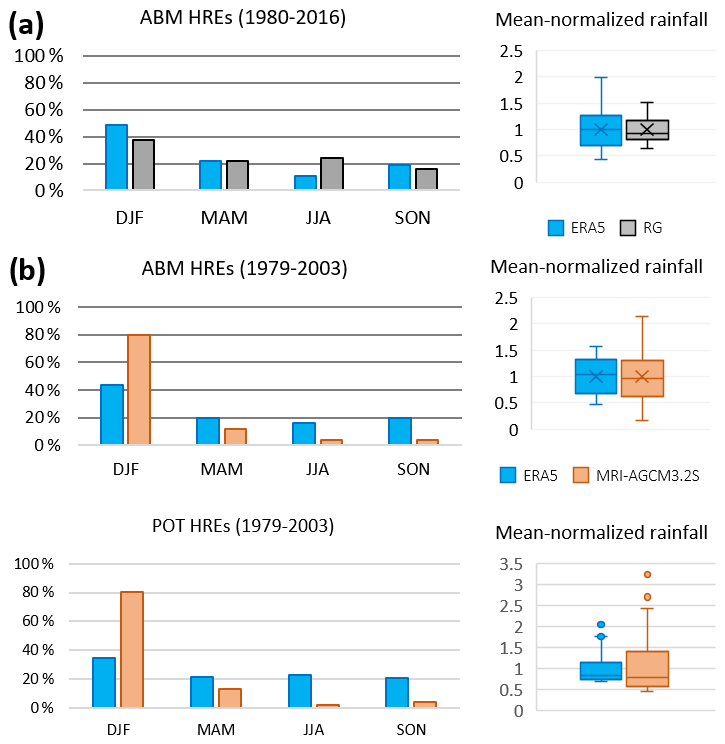
Figure 2Seasonal Frequency and Mean-normalized rainfall of HRE events: (a) comparison of raingauge with ERA5; (b) comparison of ERA5 with MRI-AGCM 3.2S.
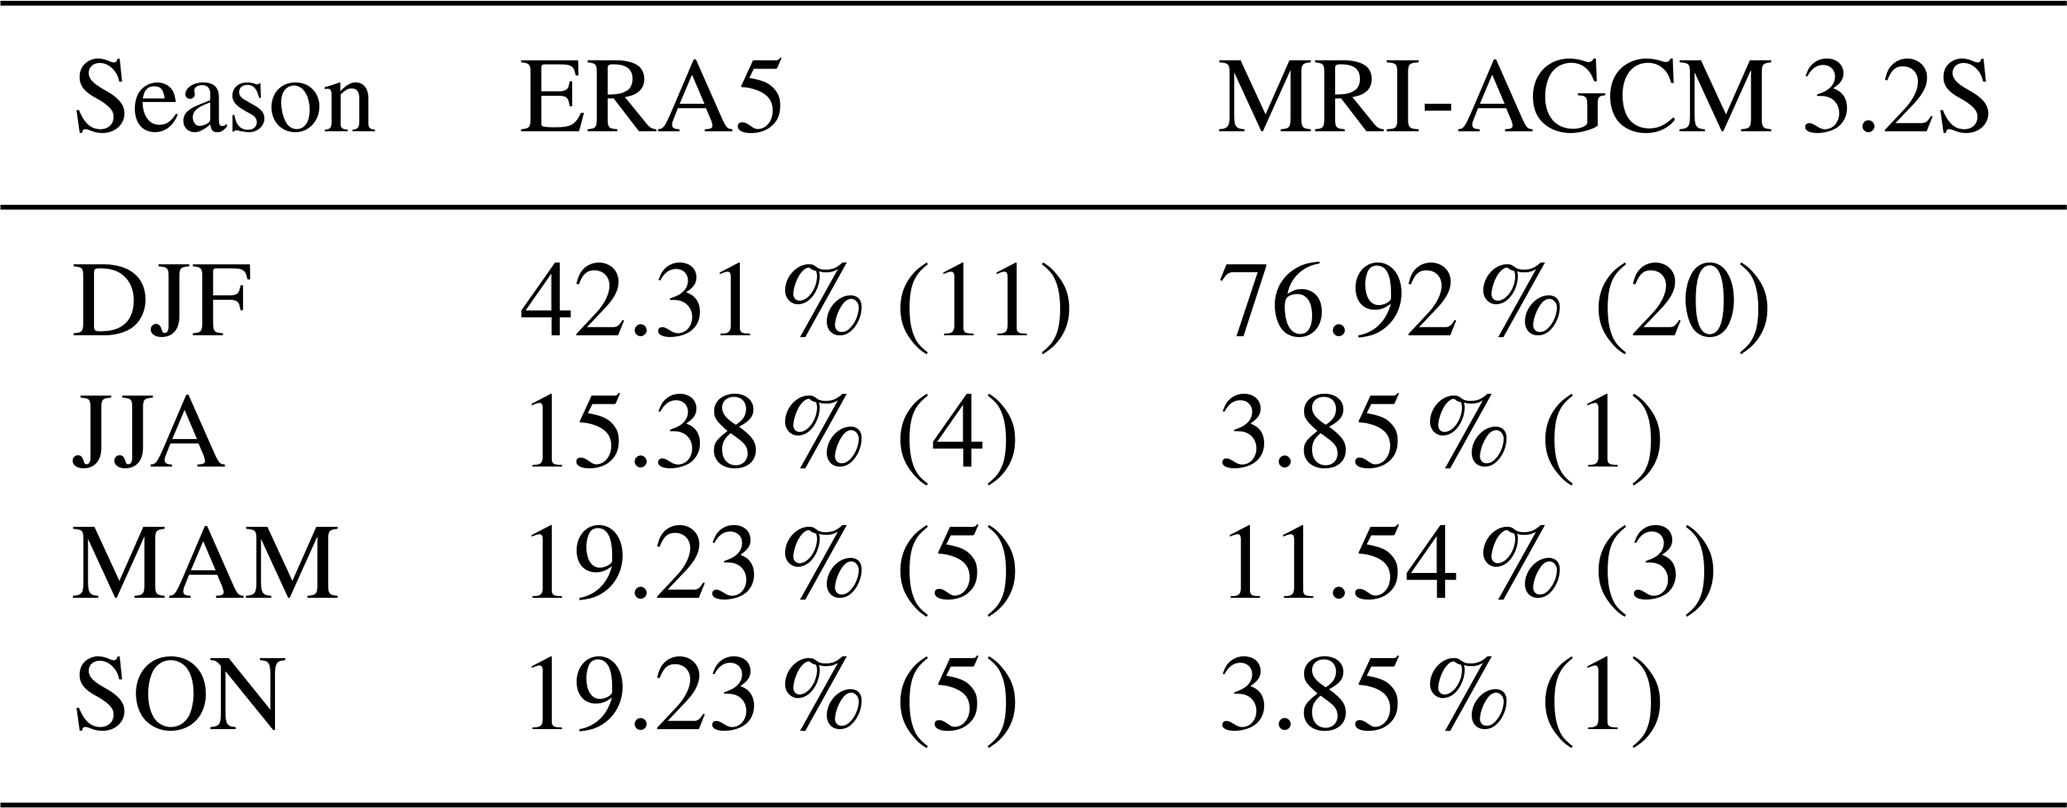
In a similar manner, HREs were calculated for MRI-AGCM 3.2S and was compared against selected HREs from ERA5 using the period 1979–2003. Figure 2b shows that the mean-normalized HRE rainfall of MRI-AGCM 3.2S has comparable interquartile range but shows higher outliers indicated by the wider min-max range of the boxplots. Looking at seasonal frequency of the HREs from MRI-AGCM 3.2S, highest frequency of HREs occur in DJF season with almost twice as much as HREs in ERA5. For JJA season, the seasonal frequency of MRI-AGCM 3.2S is underestimated by 4 times as much as the ERA5 HREs. The higher frequency of DJF seasons of the selected HREs from MRI-AGCM 3.2S indicate that the rainfall magnitude during this season is significantly larger than compared to other seasons. Here, we illustrate that a season specific HREs has significant overestimation bias for DJF season.
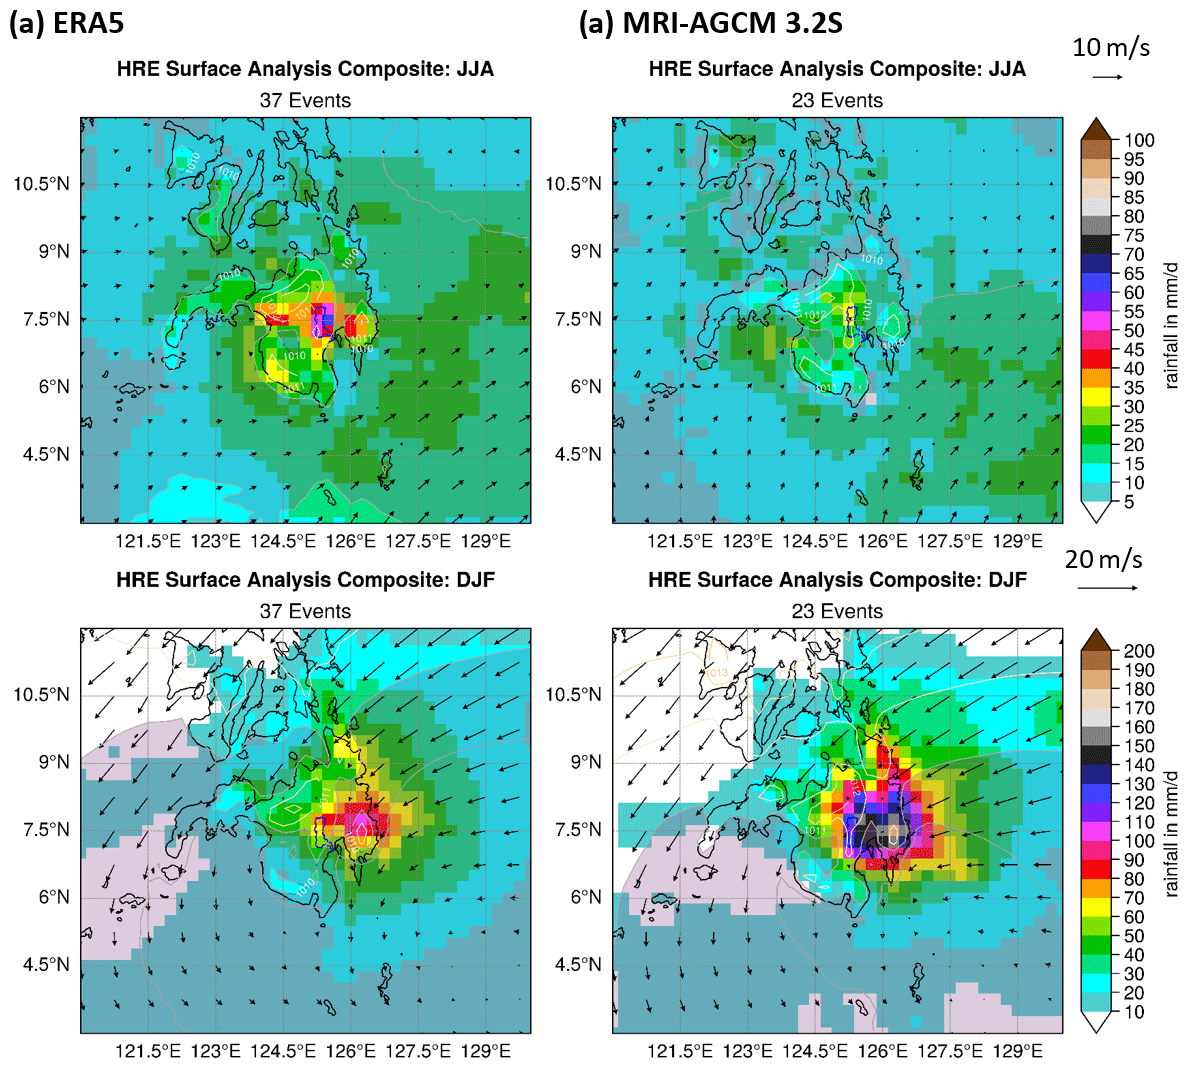
Figure 3HRE composites of surface variables (rainfall, wind in vectors, MSLP in contours) over Mindanao island for (a) ERA5 and (b) MRI-AGCM 3.2S in JJA and DJF seasons.
3.2 Climatology of HREs in ERA5 and MRI-AGCM 3.2S
We focused on the two seasons (DJF, JJA) with dominant seasonal monsoon and have the highest frequency of HREs based on raingauge observations. Additionally, the characteristics of HREs and associated weather patterns of each season can be segregated and frequency bias from AMB/POT selection using the entire period can be avoided. Figure 3 shows the rainfall over Mindanao island of the HRE composites for each season, which shows MRI-AGCM 3.2S under(over)-estimates rainfall magnitude during JJA(DJF) season in comparison with ERA5.
In this section, we describe the climatology of weather patterns associated with HREs during DJF and JJA seasons. A wider analysis area, which is referred here as monsoon region covering 90 to 150° longitude and 10° S to 45° N, is used to show the relevant synoptic conditions and anomalies as shown in Fig. 4. We also discuss how the associated conditions can impact the magnitude of rainfall in the river basin.
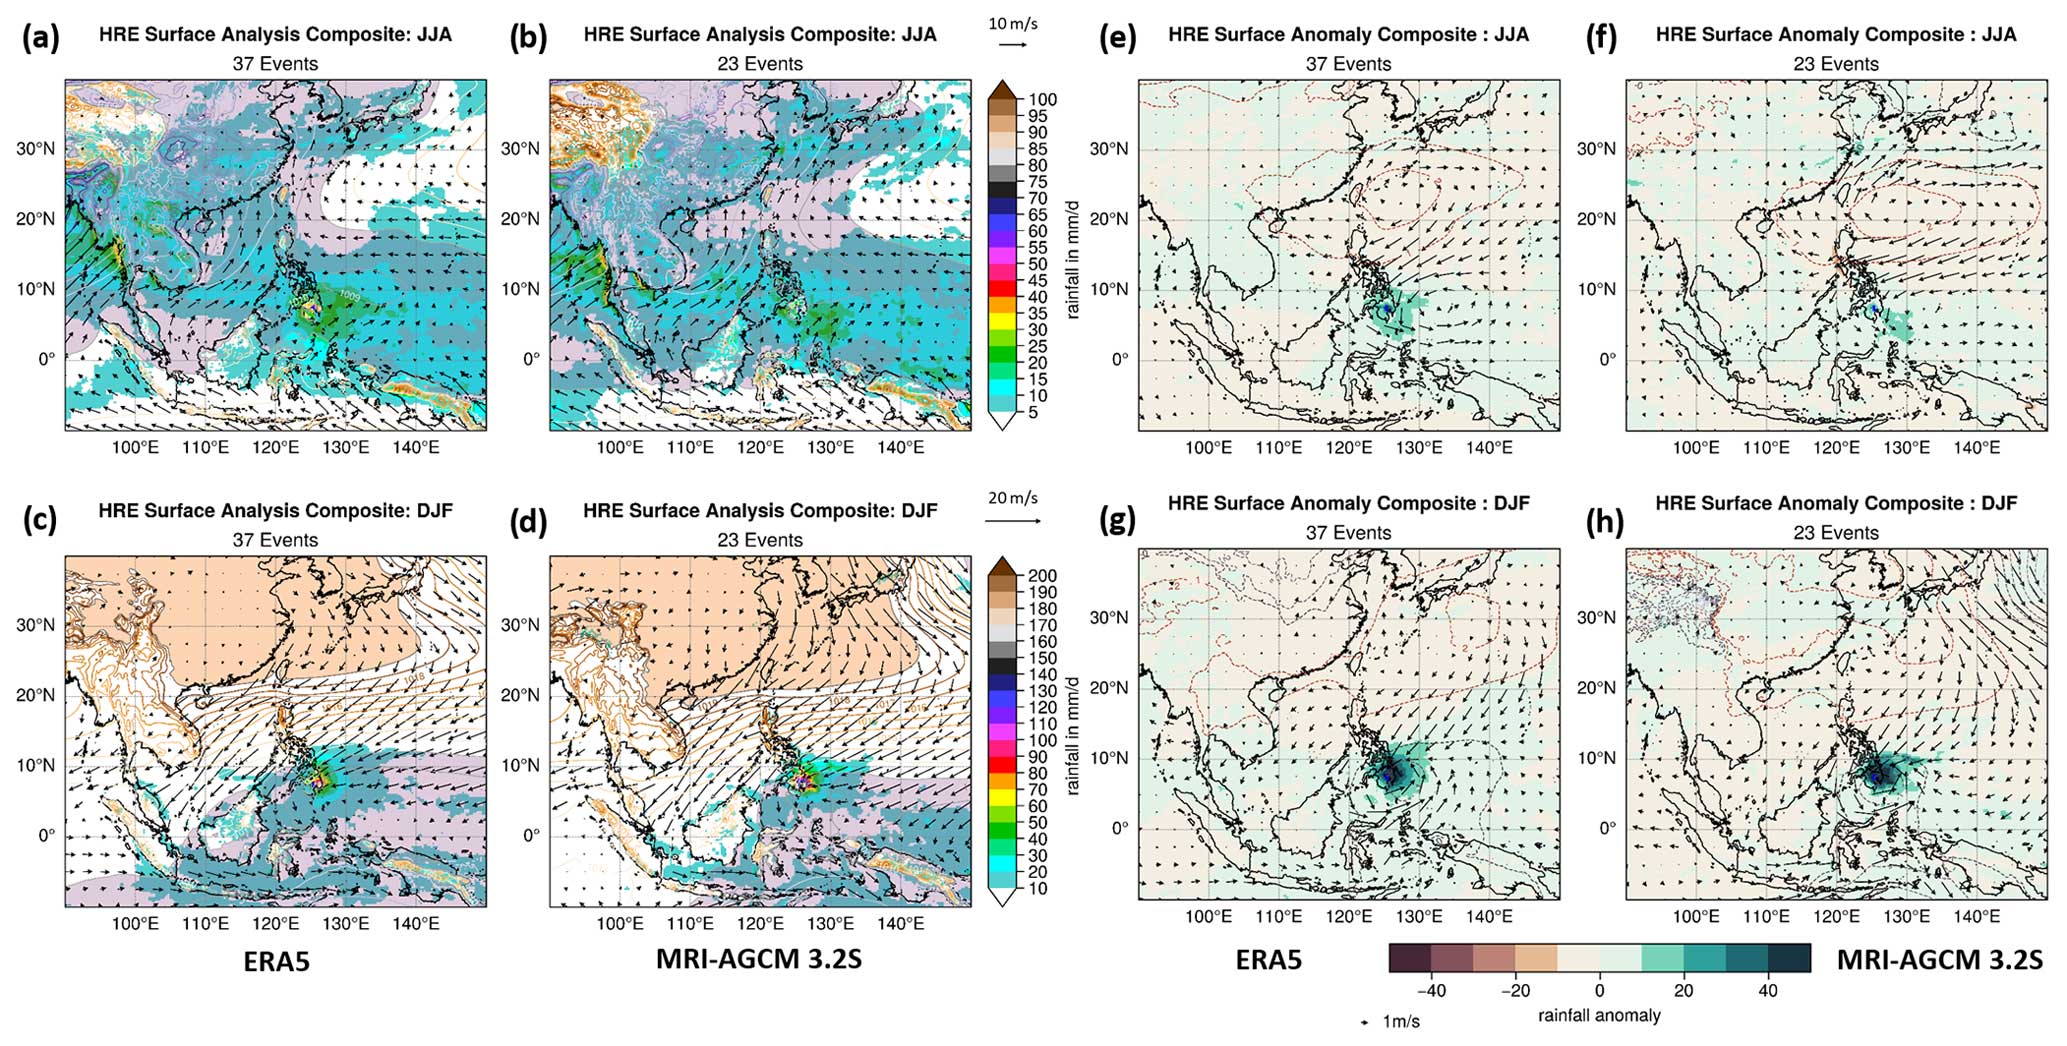
Figure 4Comparison showing composites and anomalies of selected HREs for respective seasons.
3.2.1 Climatology of DJF season HREs
DJF season composites show good correspondence between MRI-AGCM 3.2S (Fig. 4d) and ERA5 (Fig. 4c). The extent of the SH-MCL pressure system and northeast monsoon flow are very similar with ERA5. This is also supported by similar positive pressure anomaly on the north of Luzon Island and negative pressure anomaly located on the Mindanao island as shown in the anomaly composites (Fig. 4g and h).
Despite the similarities, minor differences can be seen on the location and extent of the positive pressure anomalies by MRI-AGCM 3.2S and ERA5 in Fig. 4g and h. ERA5 exhibits a distinct positive pressure anomaly indicated by the +2 Pa contour centered just below Honshu island of Japan, while MRI-AGCM 3.2S shows a more positive pressure anomaly indicated by +3 Pa contours located more landward in the Korean peninsula that protrudes beyond Kyushu Island as shown by the +2 Pa countours.
On both datasets, the positive-negative pressure anomaly system over Philippine archipelago causes an anomalous northeasterly flow that ends on the negative pressure low located in Mindanao island. However, due to the slight difference in the positive pressure anomaly configuration, we can observe a slightly different characteristic of the anomalous northeasterly flow from ERA5 and MRI-AGCM 3.2S. ERA5 exhibits a northeasterly flow induced by the additional positive-negative gradient between north of Luzon and Mindanao island. In comparison, the anomalous northeasterly flow shown by MRI-AGCM 3.2S is slightly stronger due to the higher pressure gradient induced by the positive pressure anomaly located more landward. Comparing the anomalous positive-negative systems, ERA5 shows a 3Pascal difference that is lower than shown by MRI-AGCM 3.2S with 5Pascal difference. Higher-pressure gradient shown by MRI-AGCM 3.2S than ERA5 resulted in higher anomalous rainfall caused by a stronger anomalous cyclonic circulation near Mindanao island.
3.2.2 Climatology of JJA season HREs
JJA season composites (ERA5 in Fig. 4a and MRI-AGCM 3.2S in Fig. 4b) show comparable general pressure system but with distinguishable differences. ERA5 shows an Asiatic Low with some relative high-pressure area over Tibetan Plateau. In contrast, MRI-AGCM 3.2S shows a more extended area of relative high pressure located on the north of Tibetan Plateau. The southwest monsoon flow is evident in both ERA5 and MRI-AGCM 3.2S.
However, ERA5 shows two main rainfall distribution following the southwest monsoon flows, which are situated over Myanmar coasts extending landward and from Gulf of Thailand towards western coast of Philippines. In contrast, MRI-AGCM 3.2S shows a dominant rainfall distribution following the southwest monsoon flow from Bay of Bengal traversing to Gulf of Thailand up to the western coasts in the Philippines, with rainfall maxima located on the southernmost tip of Myanmar. Furthermore, Western North Pacific subtropical high (WNPSH) that usually coincides with relative higher mean-sea-level-pressure located along the 20–30° N latitude band has a more coherent structure in ERA5 than in MRI-AGCM 3.2S composites.
Although both ERA5 and MRI-AGCM 3.2S show a positive pressure anomaly shown by the +2 Pa contours (Fig. 4e and f) acting like a blocking mechanism located on the north of Luzon island, they show slightly different configuration in terms of pressure gradient that translates to slight difference in anomalous circulation leading to a difference in rainfall magnitude as a consequence. In ERA5, the positive pressure anomaly has almost circular configuration that acts like an anticyclone block inducing an anomalous northeasterly flow that eventually feeds into an anomalous cyclonic circulation on the eastern coasts of Mindanao island. The resulting anomalous circulation causes the anomalous rainfall over the Davao River basin. In contrast, MRI-AGCM 3.2S shows a more flattened anomalous anticyclone block located in the North of Luzon that induces a more easterly anomalous flow contributing to a weaker cyclonic circulation near Mindanao island. The weaker anomalous cyclonic circulation causes lower anomalous rainfall in Davao river basin that eventually translates to an underestimation of rainfall amount for JJA HREs as compared with ERA5.
The ability of GCMs to reproduce the statistics of the present climate is considered as a measure of credibility to project potential future scenarios. Based on our analysis, seasonal frequency occurrence of annual HREs in MRI-AGCM 3.2S are overestimated (underestimated) HRE occurrence in DJF (JJA) season compared with ERA5. The relative magnitude of rainfall of HREs determines the seasonal frequency estimated from ABM or POT selected HREs that can impact the basis for extreme events selection for hydrological assessments.
By focusing on dominant monsoon climatology and using POT method for each season, we were able to understand the weather patterns or large-scale/synoptic conditions during the seasonal HREs in the river basin using ERA5 as reference and evaluated the MRI-AGCM3.2S against it. Using composite analysis, we found that MRI-AGCM 3.2S has good ability of reproducing relevant large scale and/or synoptic features on both seasons: monsoon trough or ITCZ, Western North Pacific subtropical High (WNPSH), and converging wind flows of south-westerly to westerly winds from the Bay of Bengal and easterly wind from the Coral Sea in JJA season; and Siberian High-Maritime Continent Low pressure system, ITCZ, and northeasterly to easterly winds associated with cold-surge in DJF season. MRI-AGCM 3.2S has better ability in reproducing large-scale and/or synoptic features during DJF season than JJA season, which resulted in better rainfall magnitude of HREs in Davao river basin. This indicates that projections related to HREs during DJF season has a higher reliability than during JJA season. In addition, the anomaly composite analysis showed MRI-AGCM 3.2S can also reproduce the anomalous conditions in comparison with ERA5. However, it also showed that small differences in the configuration and location of these anomalous conditions can lead to significant differences on the rainfall magnitude and frequency of HRE in Davao river basin. It should be noted that Davao river basin is relatively a small river basin with an area under 2000 km2 so small difference in configuration of the synoptic conditions that lead to anomalous conditions can significantly impact rainfall in the basin. For future work, there is a need to classify the HREs for each season of dominant synpotic features like monsoon, typhoon, and cold surge events. Utility of indices to represent the synoptic conditions or anomalous patterns should also be identified and used to quantify the difference of the GCM with ERA5. In addition, the periods used for the composite analysis for ERA5 and MRI-AGCM3.2S are different which may be sensitive but had not been addressed here.
This study and future work on mechanisms and climatology of HREs in river basin scale are critical information in understanding biases from GCM and its potential impact in characterizing and predicting basin hydro-climatic hazards used in disaster management and climate change assessment studies for adaptation investment planning and decision making. In addition, the framework combines statistics and process oriented evaluation tool for understanding heavy rainfall events in GCMs, which are focused on the GCM's ability to replicate its the seasonal frequency and associated synoptic conditions. It also provides basis for constructing storyline approach (Shepherd et al., 2018; Shepherd, 2019) on both research and science communication aspects of climate change studies.
Data analysis and visualization in the study used the following python packages: xarray (https://doi.org/10.5281/zenodo.598201, Hoyer et al., 2024), Pandas (https://doi.org/10.5281/zenodo.3509134, The pandas development team, 2024), MetPy (https://doi.org/10.5281/zenodo.160750, May et al., 2016), cartopy (https://doi.org/10.5281/zenodo.1182735, Elson et al., 2023), and ProPlot (https://doi.org/10.5281/zenodo.3873878, Davis, 2021).
Data used in the study are ERA5 (Hersbach et al., 2020) and MRI-AGCM 3.2S (Mizuta et al., 2012). Rainfall station data from The Philippine Atmospheric, Geophysical and Astronomical Services Administration (PAGASA) used in this study can be requested directly from their office.
RAA: Conceptualization, Methodology, Software, Validation, Formal analysis, Investigation, Data Curation, Writing – Original Draft, Visualization. TU: Conceptualization, Resources, Writing – Review and Editing, Supervision. TK: Conceptualization, Supervision.
At least one of the (co-)authors is a guest member of the editorial board of Proceedings of IAHS for the special issue “ICFM9 – River Basin Disaster Resilience and Sustainability by All”. The peer-review process was guided by an independent editor, and the authors also have no other competing interests to declare.
Publisher's note: Copernicus Publications remains neutral with regard to jurisdictional claims made in the text, published maps, institutional affiliations, or any other geographical representation in this paper. While Copernicus Publications makes every effort to include appropriate place names, the final responsibility lies with the authors.
This article is part of the special issue “ICFM9 – River Basin Disaster Resilience and Sustainability by All”. It is a result of The 9th International Conference on Flood Management, Tsukuba, Japan, 18–22 February 2023.
The authors would like to acknowledge support from PAGASA for providing the daily rainfall data used and Meteorological Research Institute of Japan for providing MRI-AGCM 3.2S dataset used in this study.
This research has been partly supported by the TOUGOU and SENTAN Program of MEXT, Japan (grant no. JPMXD0717935561).
This paper was edited by Daisuke Harada and reviewed by Tomohito J. Yamada and one anonymous referee.
Breuer, L., Gosling, S. N., Yang, T., Hoffmann, P., Hattermann, F. F., Krysnaova, V., Wada, Y., Su, B., Masaki, Y., Müller, C., Daggupati, P., Stacke, T., Fekete, B., Motovilov, Y., Vetter, T., Flörke, F., Liersch, S., Donnelly, C., and Samaniego, L.: Sources of uncertainty in hydrological climate impact assessment: a cross-scale study, Environ. Res. Lett., 13, 015006, https://doi.org/10.1088/1748-9326/aa9938, 2017. a
Clark, M. P., Wilby, R. L., Gutmann, E. D., Vano, J. A., Gangopadhyay, S., Wood, A. W., Fowler, H. J., Prudhomme, C., Arnold, J. R., and Brekke, L. D.: Characterizing Uncertainty of the Hydrologic Impacts of Climate Change, Current Climate Change Reports, 2, 55–64, https://doi.org/10.1007/s40641-016-0034-x, 2016. a, b, c
Davis, L. L. B.: ProPlot (v0.9.5), Zenodo [code], https://doi.org/10.5281/zenodo.3873878, 2021. a
Elson, P., Sales de Andrade, E., Lucas, G., May, R., Hattersley, R., Campbell, E., Dawson, A., Little, B., Raynaud, S., scmc72, Snow, A. D., Comer, R., Donkers, K., Blay, B., Killick, P., Wilson, N., Peglar, P., lgolston, lbdreyer, Szymaniak, A. J., Berchet, A., Bosley C., Davis, L., Krasting, F. J., Bradbury, M., Kirkham, D., stephenworsley, and Havlin, C.: SciTools/cartopy: v0.22.0 (v0.22.0), Zenodo [code], https://doi.org/10.5281/zenodo.1182735, 2023. a
Fowler, H. J., Blenkinsop, S., and Tebaldi, C.: Linking climate change modelling to impacts studies: Recent advances in downscaling techniques for hydrological modelling, Int. J. Climatol., 27, 1547–1578, https://doi.org/10.1002/joc.1556, 2007. a
Gutowski Jr., W. J., Giorgi, F., Timbal, B., Frigon, A., Jacob, D., Kang, H.-S., Raghavan, K., Lee, B., Lennard, C., Nikulin, G., O'Rourke, E., Rixen, M., Solman, S., Stephenson, T., and Tangang, F.: WCRP COordinated Regional Downscaling EXperiment (CORDEX): a diagnostic MIP for CMIP6, Geosci. Model Dev., 9, 4087–4095, https://doi.org/10.5194/gmd-9-4087-2016, 2016. a
Haarsma, R. J., Roberts, M. J., Vidale, P. L., Senior, C. A., Bellucci, A., Bao, Q., Chang, P., Corti, S., Fučkar, N. S., Guemas, V., von Hardenberg, J., Hazeleger, W., Kodama, C., Koenigk, T., Leung, L. R., Lu, J., Luo, J.-J., Mao, J., Mizielinski, M. S., Mizuta, R., Nobre, P., Satoh, M., Scoccimarro, E., Semmler, T., Small, J., and von Storch, J.-S.: High Resolution Model Intercomparison Project (HighResMIP v1.0) for CMIP6, Geosci. Model Dev., 9, 4185–4208, https://doi.org/10.5194/gmd-9-4185-2016, 2016. a
Hersbach, H., Bell, B., Berrisford, P., Hirahara, S., Horányi, A., Muñoz-Sabater, J., Nicolas, J., Peubey, C., Radu, R., Schepers, D., Simmons, A., Soci, C., Abdalla, S., Abellan, X., Balsamo, G., Bechtold, P., Biavati, G., Bidlot, J., Bonavita, M., De Chiara, G., Dahlgren, P., Dee, D., Diamantakis, M., Dragani, R., Flemming, J., Forbes, R., Fuentes, M., Geer, A., Haimberger, L., Healy, S., Hogan, R. J., Hólm, E., Janisková, M., Keeley, S., Laloyaux, P., Lopez, P., Lupu, C., Radnoti, G., de Rosnay, P., Rozum, I., Vamborg, F., Villaume, S., and Thépaut, J.-N.: The ERA5 global reanalysis, Q. J. Roy. Meteor. Soc., 146, 1999–2049, https://doi.org/10.1002/qj.3803, 2020. a, b
Hoyer, S., Roos, M., Joseph, H., Magin, J., Cherian, D., Fitzgerald, C., Hauser, M., Fujii, K., Maussion, F., Imperiale, G., Clark, S., Kleeman, A., Nicholas, T., Kluyver, T., Westling, J., Munroe, J., Amici, A., Barghini, A., Banihirwe, A., Bell, R., Hatfield-Dodds, Z., Abernathey, R., Bovy, B., Omotani, J., Mühlbauer, K., Roszko, M. K., and Wolfram, P. J.: xarray (v2024.02.0), Zenodo [code], https://doi.org/10.5281/zenodo.598201, 2024. a
Ito, R., Nakaegawa, T., and Takayabu, I.: Comparison of regional characteristics of land precipitation climatology projected by an MRI-AGCM multi-cumulus scheme and multi-SST ensemble with CMIP5 multi-model ensemble projections, Prog. Earth Planet. Sc., 7, 77, https://doi.org/10.1186/s40645-020-00394-4, 2020. a, b
Maraun, D.: Bias Correcting Climate Change Simulations – a Critical Review, Current Climate Change Reports, 2, 211–220, https://doi.org/10.1007/s40641-016-0050-x, 2016. a
Maraun, D., Shepherd, T. G., Widmann, M., Zappa, G., Walton, D., Gutiérrez, J. M., Hagemann, S., Richter, I., Soares, P. M., Hall, A., and Mearns, L. O.: Towards process-informed bias correction of climate change simulations, Nat. Clim. Change, 7, 764–773, https://doi.org/10.1038/nclimate3418, 2017. a, b
May, R., Arms, S., kpozsonyi, Haberlie, A., Marsh, P., deeplycloudy, mmorello1, Goebbert, K., Leeman, J., and Helmus, J. J.: metpy/MetPy: 0.4 (v0.4.0), Zenodo [code], https://doi.org/10.5281/zenodo.160750, 2016. a
Meresa, H., Tischbein, B., and Mekonnen, T.: Climate change impact on extreme precipitation and peak flood magnitude and frequency: observations from CMIP6 and hydrological models, Natural Hazards, 111, 2649–2679, https://doi.org/10.1007/s11069-021-05152-3, 2022. a
Mizuta, R., Yoshimura, H., Murakami, H., Matsueda, M., Endo, H., Ose, T., Kamiguchi, K., Hosaka, M., Sugi, M., Yukimoto, S., Kusunoki, S., and Kitoh, A.: Climate simulations using MRI-AGCM3.2 with 20-km grid, J. Meteorol. Soc. Jpn., 90, 233–258, https://doi.org/10.2151/jmsj.2012-A12, 2012. a, b
Mori, N., Takemi, T., Tachikawa, Y., Tatano, H., Shimura, T., Tanaka, T., Fujimi, T., Osakada, Y., Webb, A., and Nakakita, E.: Recent nationwide climate change impact assessments of natural hazards in Japan and East Asia, Weather and Climate Extremes, 32, 100309, https://doi.org/10.1016/j.wace.2021.100309, 2021. a
Murakami, H., Wang, B., and Kitoh, A.: Future change of western North Pacific typhoons: Projections by a 20-km-mesh global atmospheric model, J. Climate, 24, 1154–1169, https://doi.org/10.1175/2010JCLI3723.1, 2011. a
Murakami, H., Wang, Y., Yoshimura, H., Mizuta, R., Sugi, M., Shindo, E., Adachi, Y., Yukimoto, S., Hosaka, M., Kusunoki, S., Ose, T., and Kitoh, A.: Future Changes in Tropical Cyclone Activity Projected by the New High-Resolution MRI-AGCM*, J. Climate, 25, 3237–3260, https://doi.org/10.1175/JCLI-D-11-00415.1, 2012. a
Neelin, J. D., Martinez-Villalobos, C., Stechmann, S. N., Ahmed, F., Chen, G., Norris, J. M., Kuo, Y. H., and Lenderink, G.: Precipitation Extremes and Water Vapor: Relationships in Current Climate and Implications for Climate Change, Current Climate Change Reports, 8, 17–33, https://doi.org/10.1007/s40641-021-00177-z, 2022. a
Pfahl, S., O'Gorman, P. A., and Fischer, E. M.: Understanding the regional pattern of projected future changes in extreme precipitation, Nat. Clim. Change, 7, 423–427, https://doi.org/10.1038/nclimate3287, 2017. a
Shepherd, T. G.: Storyline approach to the construction of regional climate change information, P. Roy. Soc. A, 475, 834–860, https://doi.org/10.1098/rspa.2019.0013, 2019. a, b
Shepherd, T. G., Boyd, E., Calel, R. A., Chapman, S. C., Dessai, S., Dima-West, I. M., Fowler, H. J., James, R., Maraun, D., Martius, O., Senior, C. A., Sobel, A. H., Stainforth, D. A., Tett, S. F., Trenberth, K. E., van den Hurk, B. J., Watkins, N. W., Wilby, R. L., and Zenghelis, D. A.: Storylines: an alternative approach to representing uncertainty in physical aspects of climate change, Clim. Change, 151, 555–571, https://doi.org/10.1007/s10584-018-2317-9, 2018. a
Teutschbein, C. and Seibert, J.: Regional climate models for hydrological impact studies at the catchment scale: A review of recent modeling strategies, Geography Compass, 4, 834–860, https://doi.org/10.1111/j.1749-8198.2010.00357.x, 2010. a
The pandas development team: pandas-dev/pandas: Pandas (v2.2.1), Zenodo [code], https://doi.org/10.5281/zenodo.3509134, 2024. a
Wood, E. F., Lettenmaier, D., Liang, X., Nijssen, B., and Wetzel, S. W.: Hydrological Modeling of Continental-Scale Basins, Annu. Rev. Earth Planet. Sc., 25, 279–300, https://doi.org/10.1146/annurev.earth.25.1.279, 1997. a