the Creative Commons Attribution 4.0 License.
the Creative Commons Attribution 4.0 License.
 | 19 Apr 2024
An approach to assess sediment disaster risk using soil moisture deficit: A case study about sediment disasters occurred during 2010–2011 in Niigata prefecture, Japan
Takahiro Ogura
Thandar Tun Zin
Shigeaki Oka
Shun-ichi Onitsuka
Naoaki Kawamura
Takahiro Yamamoto
Koichi Komiyama
Most sediment disasters are caused by surface failures, mostly induced by rainfall, and many of them cause extensive damages. Assessment of the risk of such disasters is crucial for the safety and security of society. This is becoming increasingly important in the era of global warming when torrential rains and localized heavy rains are on the increase. Instead of the index such as accumulated rainfall amount, we attempted to make a risk assessment using the soil moisture deficit, i.e., the remained capacity of the soil column to accept rainwater. First, a numerical model was developed to calculate soil moisture deficit in any or all tertiary meshes with existing routine data. The model was then applied to 446 tertiary meshes in Niigata Prefecture within which failures occurred during a period from 2010 to 2011. The model showed that the soil moisture deficit near the failure occurrence became smaller, i.e., the soil column was closer to complete saturation. This suggests that soil moisture deficit could be a good indicator of the risk. Furthermore, a probability distribution model was constructed from the minimum soil moisture deficit data near the failure occurrence. With this probability model, the threshold of soil moisture deficit to put an area on alert, corresponding to the disaster coverage ratio, can be easily calculated. The possibility of early warning is also demonstrated by combining the soil moisture deficit at a certain time with a short-time rainfall forecast for several hours in the future.
- Article
(2763 KB) - Full-text XML
- BibTeX
- EndNote


Most sediment disasters are caused by surface failures, which are mostly rainfall-related phenomena except for large external forces such as earthquakes. Many of these phenomena can cause extensive damage. Assessing the risk of occurrence of such phenomena is extremely important for the safety and security of society.
The ability to predict when, where, how large, and under what conditions (in this case, rainfall, and soil) a sediment disaster will occur is the goal that many researchers have pursued. Many studies have been conducted based on the mechanism of land failure occurrence (e.g. Ono and Kazama, 2013; Danjo, 2017). On the other hand, statistical studies have been intensively conducted to investigate the relationship between factors related to sediment disasters, such as topographic factors, soil properties, and accumulated rainfall (e. g. Hayashi and Yamada, 2017).
Recently, there has been a growing trend to use the amount of water amount in the soil instead of accumulated rainfall (Okada et al., 2001). Okada et al. (2001) defined the amount of water amount in a tank model as the soil water index (SWI) and proposed a method to estimate the degree of danger by comparing it with the disaster history of the past 10 years. In this method, the entire country is divided into evenly spaced grid cells (tertiary meshes, about 1×1 km), and the three-tank tank models (Ishihara and Kobatake, 1979) with fixed parameters are uniformly allocated for all grid cells. However, the creation of the pre-determined critical lines to judge the danger is technically quite difficult and requires advanced knowledge and skills in data collection and fine-tuning.
In this study, instead of accumulated rainfall or similar indexes, we attempt to evaluate the risk of sediment disaster using soil moisture deficit (hereafter referred to as SMD), i.e., the surplus capacity of the soil column to accept rainwater. First, we will develop a numerical model to calculate the SMD and make preparation for the model operation. Then, the model was applied to 446 sediment disasters that occurred in Niigata Prefecture over two years from 2010 to 2011 for each tertiary mesh within which the disaster occurred, and the dynamics of the SMD and its validity as an indicator of sediment disasters were confirmed. The model is then applied to the assessment and prediction of sediment disaster risk.
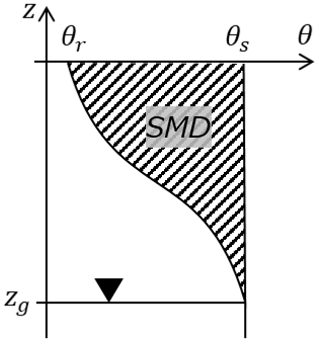
As shown in Fig. 1, the soil moisture deficit for a semi-infinite vertical soil column, SMD, is the moisture deficit up to whole column saturation and is expressed as
where z is coordinate with the vertically upward direction as positive, zg is the coordinate of the groundwater level, θ is the volumetric water content at z, and θs is the saturated volumetric water content, which is constant for homogeneous soils.
The water balance of the soil column can be expressed by
where P, E and R are rainfall, evaporation, and runoff amount per unit of time, respectively, and t is time. Parametrization is required to estimate E and R. As can be seen from Eq. (2), this study does not consider snow-related processes. Attention should be paid to sediment disasters during the snow season in snowy regions.
Since forests, which cover about 70 % of Japan's land area, have very high permeability (Kuraji and Hoyano, 2004), only saturated surface runoff is considered in this study as follows:
For evaporation, we use the evaporation efficiency, β
where Ep is the potential evaporation which is calculated by using the Makkink equation (Nagai, 1993) as described below. There are many studies on evaporation efficiency (e.g. Komatsu, 2003). Many of them use in some form the average saturation of a constant thickness of the surface layer (e.g. Merlin et al., 2016). Ogawa (2022) shows that in relatively quiescent environments, surface saturation can be used.
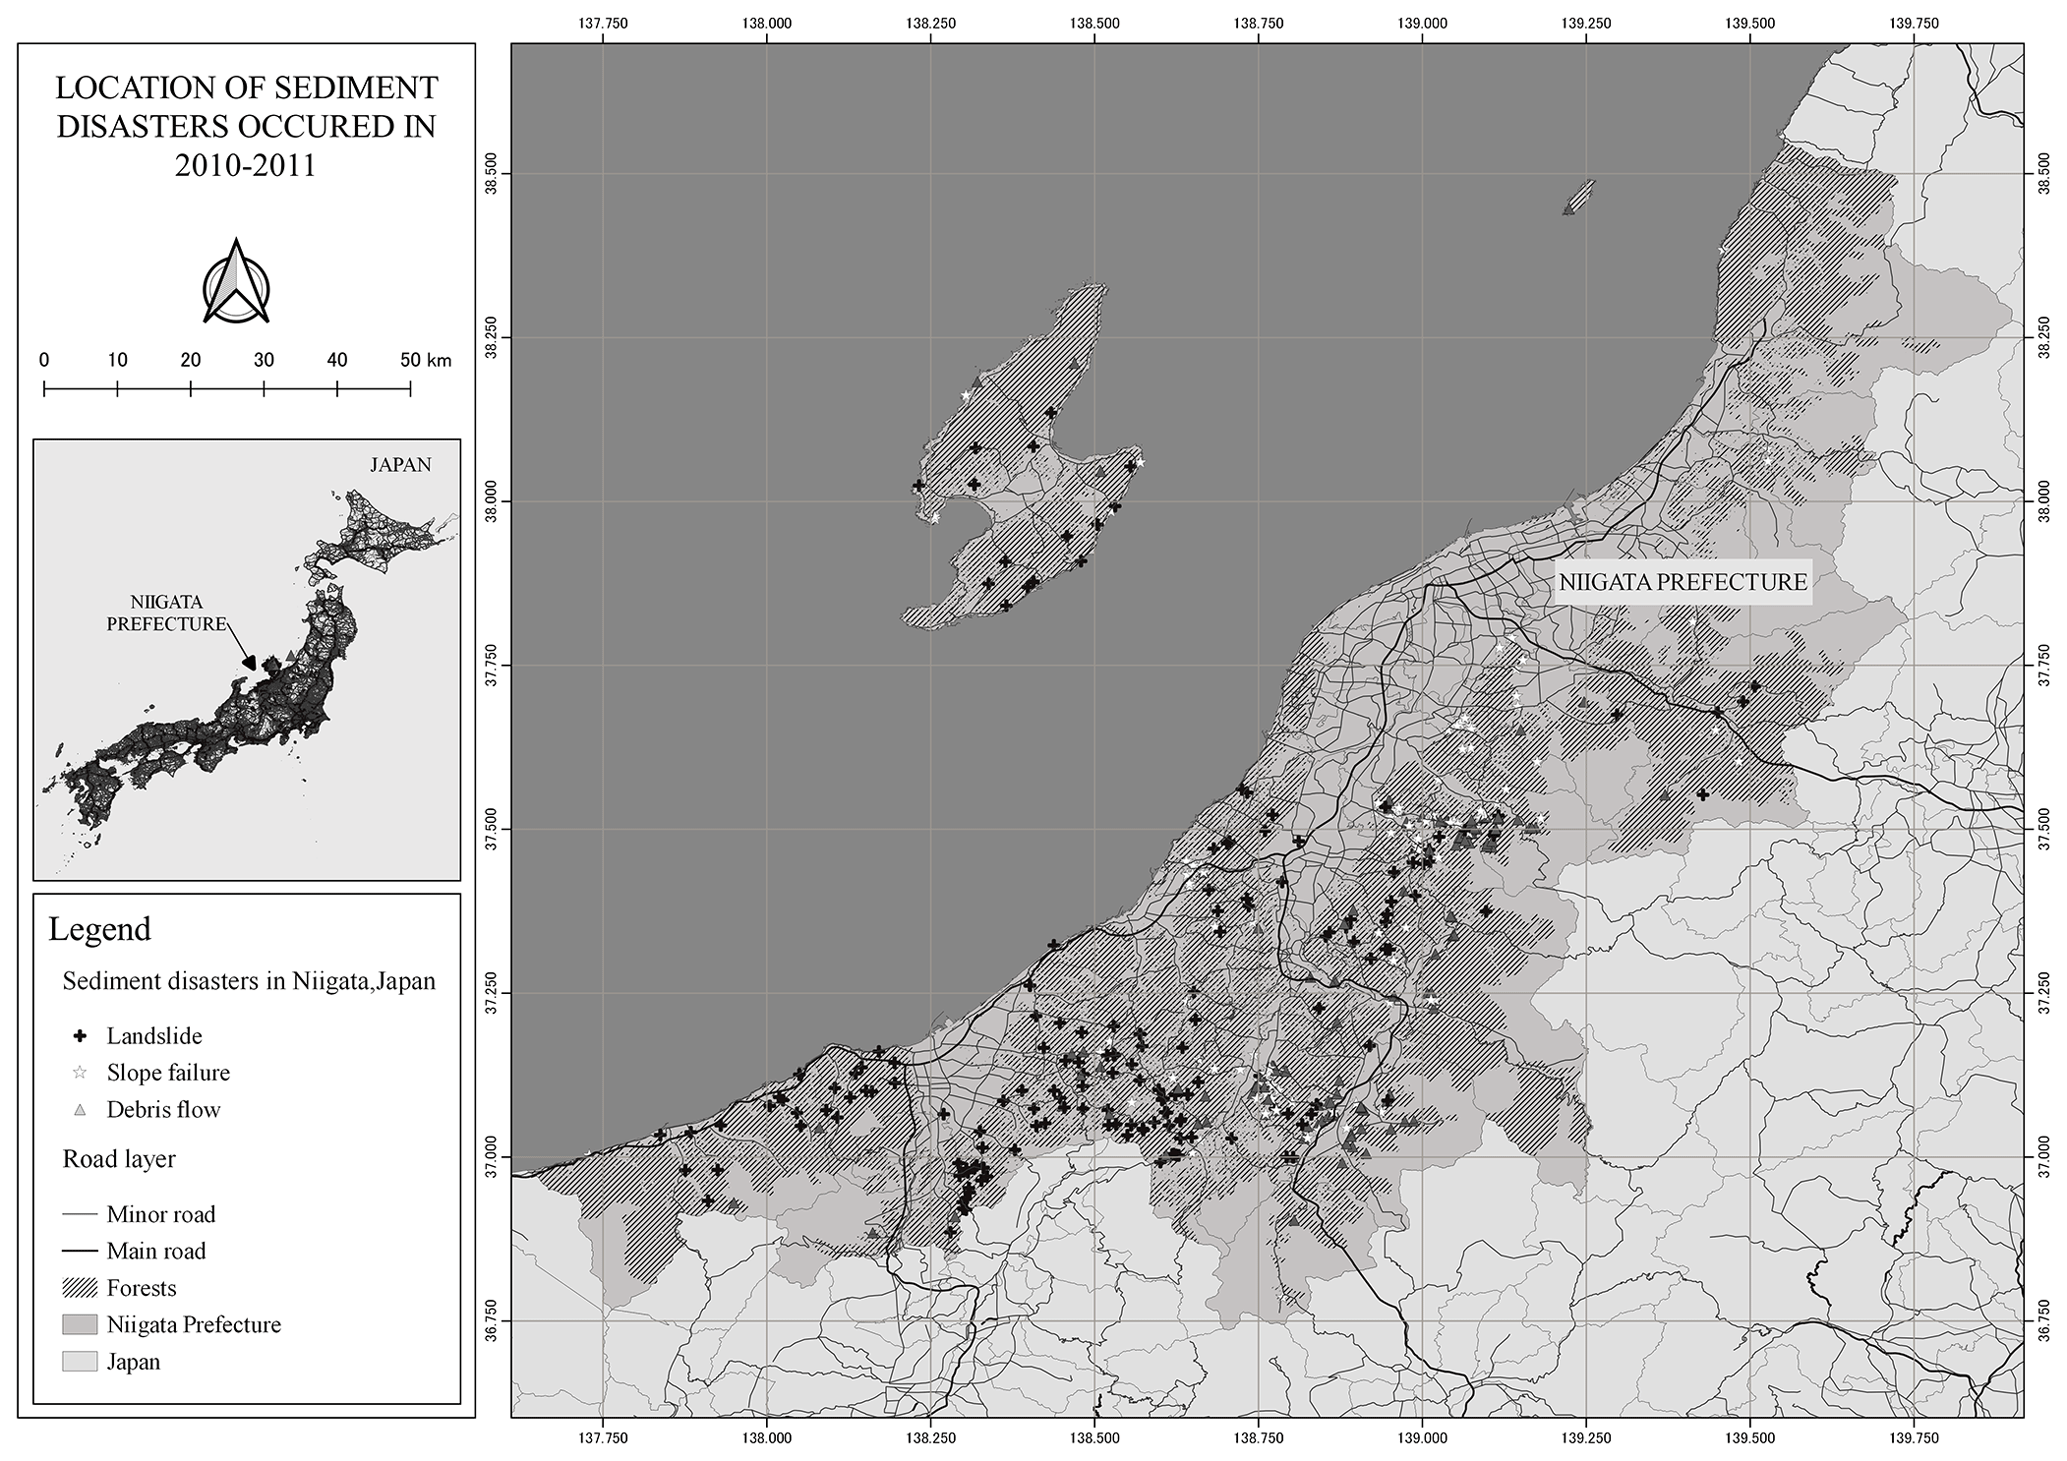
Figure 2Sediment disasters occurring in Niigata prefecture in 2010–2011.
To obtain surface saturation, this study assumes that water infiltrated into the soil layer redistributes to deeper layers and quickly reaches a hydrostatic equilibrium where gravity and capillary forces balance each other. Hydrostatic equilibrium results in
where Ψ is the capillary potential. A moisture retention curve model will determine the soil water content profile and then the SMD in Eq. (1) for a zg. In this study, the following Brooks-Corey model is used due to its simplicity
where Se is the relative soil saturation, θr is the residual volumetric water content, Ψb is the bubbling pressure of the soil, and λ is a parameter. The relative soil saturation at the ground surface, Se,0, can be derived from Ψ=zg as
Also, the state variable SMD can be calculated by
where
are the dimensionless groundwater level and the dimensionless SMD. As can be seen from Eq. (8), it is easy to obtain SMD from zg. However, obtaining zg from SMD requires the solution of nonlinear equations. A numerical solution is instead used to solve the following differential equation
To avoid singularity at in Eq. (9), the following approximation
is directly used when .
3.1 Research area
This study focuses on sediment disasters reported in Niigata Prefecture in the two years from 2010 to 2011, with 100 cases reported in 2010 and 346 cases in 2011. The spatial distribution of these data is shown in Fig. 2.
Sediment disasters are classified into three major categories: landslides, slope failures, and debris flows. In Niigata Prefecture, upon receiving a report, officials conduct a field survey and then classify the disaster and prepare a document. As shown in Table 1, a total of 446 sediment disasters (185 landslides, 127 slope failures, and 134 debris flows) were reported in the two years from 2010 to 2011. The exact time of occurrence cannot be determined in many cases. In such cases, we assume that the failures occurred during the 24 h period before the reporting time and check the analysis results during that period.
3.2 Soil data preparation
To run the above model, the physical properties of the soil, such as the parameters of the Brooks-Corey model, are required. In this study, the model is based on the soil code (hereinafter referred to as the KS code) in Land Classification Grid Data (LCGD) in Digital National Land Information (DNLI) and the Comprehensive Soil Classification Code (hereinafter referred to as the NK code) published by the National Agriculture and Food Research Organization (NARO) of Japan. From NK code and its associated volumetric water contents corresponding to pF0.0, pF1.5, pF2.7, and pF4.2, the Brooks-Corey model parameters (θs, θr, Ψb, and λ) are estimated by Nakayama's method (2020). A nationwide database of these parameters is made based on the relationship between NK and KS codes (Lu et al., 2023).
Table 1Number of sediment disasters in Niigata Prefecture during 2010–2011.

3.3 Meteorological data
We chose to use AMeDAS (Automated Meteorological Data Acquisition System) data from among the available rainfall data because its high observation accuracy, nationwide coverage, and long observation period contribute to stable model calculations and secure cases of sediment disasters.
From sunshine duration data, downward shortwave radiation can be calculated from time and location of AMeDAS stations (Shimazaki et al., 1995). Then the potential evaporation is calculated from the downward shortwave radiation by using Makkink's equation (Nagai, 1993). Its two parameters, am and bm which are constants varying from region to region are set to am=0.95 and bm=0 (Nagai, 1993).
4.1 Calculation results
In this study, we implemented the SMD model on 446 grid cells of the DNLI tertiary meshes, within which the sediment disaster occurred, using the data described above. Since the initial value of soil moisture affects the results for a considerably long time (Rahman and Lu, 2015), we concatenate two years of data to its end to form four years of data and used the results of the last two years to reduce the influence of the initial value.
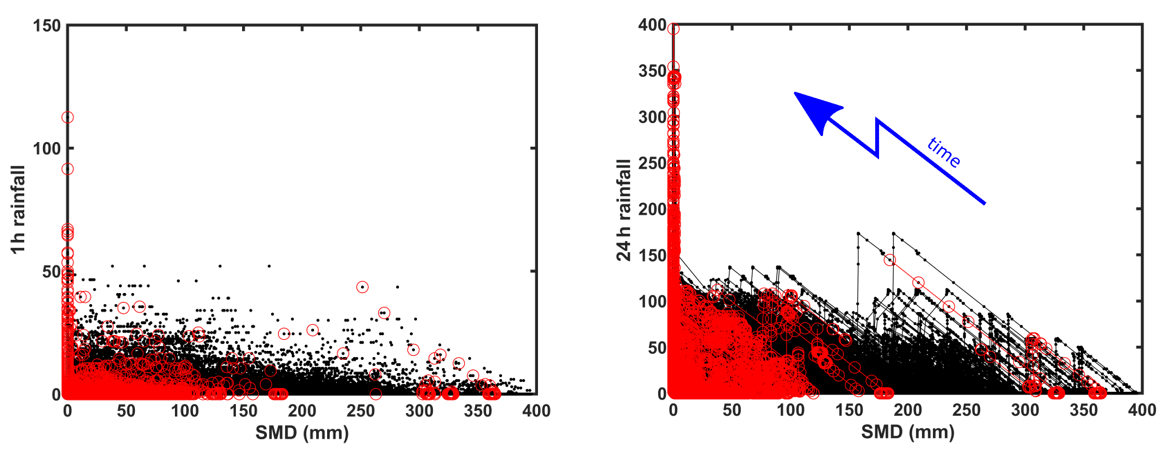
Figure 3 shows the relationship between the calculated SMD and the 1 and 24 h accumulated rainfall. As mentioned before, it is difficult to determine the exact time of occurrence of a sediment disaster. In this study, the 24 h before the time of reporting is referred to as the occurrence period, the rest the non-occurrence period, and the points in the occurrence period are indicated by red circles and those in the non-occurrence period by black dots. The data points of the same grid cell are connected by a line in time order to show the time development which is also shown schematically by blue lines and arrows in the figure. From this figure, it can be seen that SMD decreases with the increase of the accumulated rainfall. Many red points are concentrated at SMD = 0 at which sediment disasters are more likely to occur.
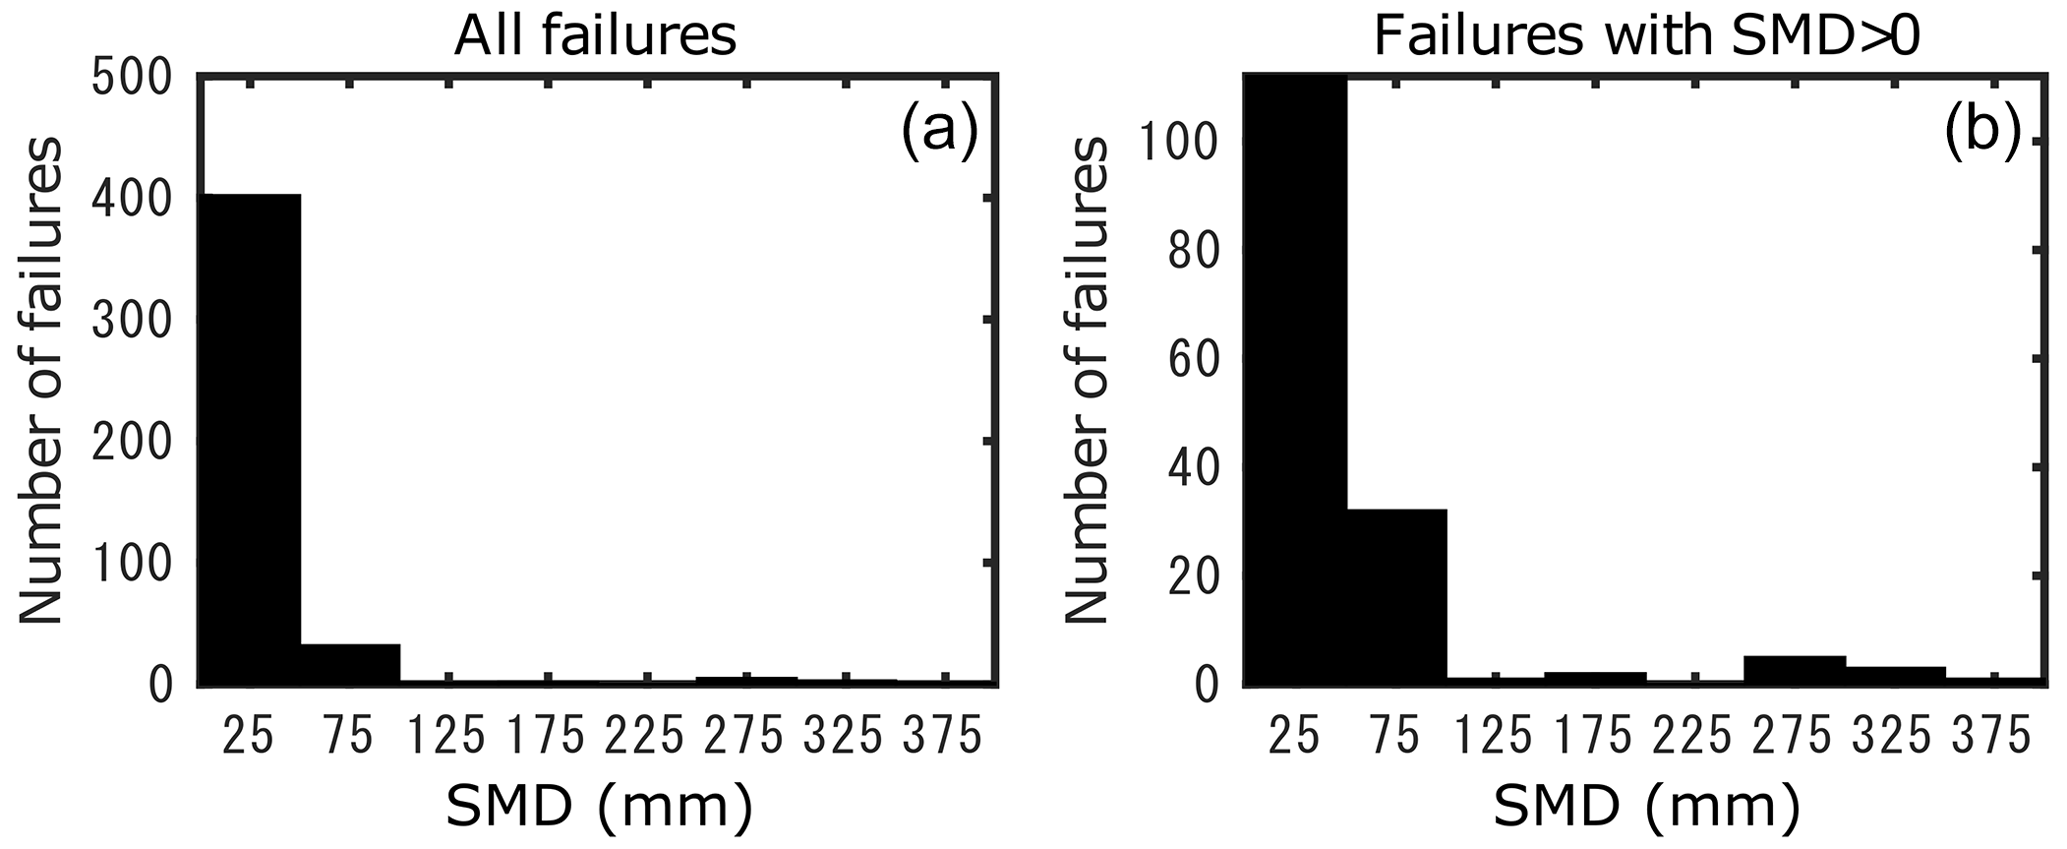
Figure 4 shows a histogram of the minimum SMD values during the occurrence period. The histogram bins are 50 mm wide, and the median value of each bin is indicated on the horizontal axis. The left shows all data and the right the data excluding SMD = 0. Similar results are also confirmed for the summer sediment disasters from May to November. Therefore subsequent analyses and discussions in this study will be conducted using year-round data.
Figure 4 shows that about 90 % of sediment disasters occur at SMD ≤ 50 mm. To understand the distribution of the data other than SMD = 0, a histogram of the data excluding SMD = 0 is shown on the right panel. The occurrence of sediment disaster is mostly observed in wet conditions, namely small SMD. This shows that SMD is a good indicator of sediment disaster risk. The same trend is observed for all types of sediment disasters.
4.2 Probability distribution of SMD minima for disaster occurrence and its application
The density function of the probability distribution of the minimum SMD values within the occurrence period is proposed as follows:
where p0 is the probability of sediment disaster occurring at saturation, SMDm is the average SMD of sediment disaster occurring before saturation is reached, and δ is the Dirac function. Therefore, the distribution function becomes
From this, the SMD threshold, SMDc corresponding to the disaster capture ratio, pc becomes
when pc≤p0, SMDc=0. If the alarm is issued when the SMD is smaller than SMDc, the probability to capture the disaster occurrence is pc.
Table 2 shows the distribution parameters obtained for each type. From this table, it can be seen that debris flows and landslides have similar characteristics of occurring when unsaturated, but debris flows tend to occur more frequently after being saturated. This difference may be due to the fact that debris flows need flow conditions in the river channel besides the failures on the slope. On the other hand, the occurrence probability of landslides after saturation is similar to that of slope failures, but the occurrence characteristics when unsaturated are quite different. They also occur in relatively large SMDs. All of the 10 cases on the right side of Figs. 3 and 4 (SMD >200 mm) are slope failures. However, even if these 10 cases are excluded, SMDm is still quite large. In the future, it may be necessary to consider different criteria for the alerting system. In the case of the disaster capture ratio, pc=0.95, SMDc is 88.7 mm, and when SMD is below this value, we will be on alert.
Table 2Parameters of probability distribution models for sediment disasters of all types.

Figure 5 shows the derived statistical distribution function of minimum SMD Also the procedure to calculate warning threshold SMDc using this distribution is illustrated.

Figure 5Derived statistical distribution function of minimum SMD and warning threshold SMDc.
As can be seen from Fig. 3, as accumulated rainfall increases, SMD decreases along the inverted 45° line. This means that the evaporation calculations in the model contribute to the formation of the initial SMD before rainfall, but are negligible during heavy rainfall events that induce sediment disasters. By utilizing these characteristics, it is possible to combine the current SMD with the Ppred of the short-time rainfall forecast for several hours in the future and use to establish an early warning system.
In this study, we attempted to evaluate the risk of a sediment disaster using the SMD, i.e., the surplus capacity of the soil column to accept rainwater. First, a numerical model was developed to calculate the SMD. Datasets necessary for model operation are prepared. Then, the model was applied to 446 sediment disasters that occurred in Niigata Prefecture over two years from 2010 to 2011 for each tertiary mesh, and the SMD within the disaster occurrence period was confirmed to have decreased towards zero, namely saturation. It is suggested that the SMD can be a good indicator of the risk of sediment disaster.
A probability distribution model of the SMD was constructed based on the minimum value of SMD within the disaster occurrence period. This model can be used to easily calculate the threshold value of the SMD to be on alert, which corresponds to the disaster capture ratio. The possibility of combining the current SMD with short-time rainfall forecasts for several hours in the future to provide early warning is demonstrated.
Data sets used in this manuscript are available upon request.
ML conceived the presented research. ML, TO and TTZ carried out coding, data manupilation and manuscript drafting. SOs, NK, TY and KK discussed research direction and results. All authors contributed to the final manuscript.
The contact author has declared that none of the authors has any competing interests.
Publisher’s note: Copernicus Publications remains neutral with regard to jurisdictional claims made in the text, published maps, institutional affiliations, or any other geographical representation in this paper. While Copernicus Publications makes every effort to include appropriate place names, the final responsibility lies with the authors.
This article is part of the special issue “ICFM9 – River Basin Disaster Resilience and Sustainability by All”. It is a result of The 9th International Conference on Flood Management, Tsukuba, Japan, 18–22 February 2023.
The authors would like to thank Department of Public Works, Niigata Prefecture, Japan for providing data and other assistance in conducting this study.
This paper was edited by Kensuke Naito and reviewed by Dimitrios Fytanidis and one anonymous referee.
Danjo, T.: Slope failure mechanism and prediction method by rainfall, J. Japan Soc. Saf. Eng., 56, 463–469, https://doi.org/10.18943/safety.56.6_463, 2017.
Hayashi, S. and Yamada, T.: Setting method of the factor and the scale of heavy rainfall caused sediment-related disasters, J. Japan Soc. Nat. Disaster Sci., 36, 307–320, https://doi.org/10.24762/jndsj.36.3_307, 2017.
Ishihara, Y. and Kobatake, S.: Runoff model for flood forecasting, Bull. Disaster Prev. Res. Inst., 29, 27–43, 1979.
Komatsu, T. S.: Toward a robust phenomenological expression of evaporation efficiency for unsaturated soil surfaces, J. Appl. Meteorol., 42, 1330–1334, https://doi.org/10.1175/1520-0450(2003)042<1330:TARPEO>2.0.CO;2, 2003.
Kuraji, K. and Hoyano, H.: Green dams – forests, rivers, water cycle and disaster prevention, Tsukiji Shokan, Tokyo, 260 pp., ISBN: 978-4806713005, 2004.
Lu, M., Ogura, T., Zin, T. T., Oka, S., Onitsuka, S., Kawamura, N., Yamamoto, T., and Komiyama, K.: Sediment disaster risk assessment using soil moisture deficit, J. Japan Soc. Hydrol. Water Resour., 36, 118–128, https://doi.org/10.3178/jjshwr.36.1752, 2023.
Merlin, O., Stefan, V. G., Amazirh, A., Chanzy, A., Ceschia, E., Er-Raki, S., Gentine, P., Tallec, T., Ezzahar, J., Bircher, S., Beringer, J., and Khabba, S.: Modeling soil evaporation efficiency in a range of soil and atmospheric conditions using a meta-analysis approach, Water Resour. Res., 52, 3663–3684, https://doi.org/10.1002/2015WR018233, 2016.
Nagai, A.: Estimation of pan evaporation by Makkink equation, J. Japan Soc. Hydrol. Water Resour., 6, 238–243, https://doi.org/10.3178/jjshwr.6.3_238, 1993.
Nakayama, K.: Study on landslide risk assessment using soil moisture deficit, Nagaoka University of Technology, 136 pp., 2020.
Ogawa, K.: Relationship between evaporation efficiency and groundwater surface position in bare ground, Nagaoka University of Technology, 102 pp., 2022.
Okada, K., Makihara, Y., Shimpo, A., Nagata, K., Kunitsugu, M., and Saito, K.: Soil water index, Tenki, 47, 36–41, 2001.
Ono, K. and Kazama, S.: Assessment of rainfall-induced shallow landslides using a statistically-based and physically-based model, J. Japan Soc. Civ. Eng. Ser. B1, 69, I_925–I_930, https://doi.org/10.2208/jscejhe.69.I_925, 2013.
Rahman, M. M. and Lu, M.: Model spin-up behavior for wet and dry basins: A case study using the xinanjiang model, Water, 7, 4256–4273, https://doi.org/10.3390/w7084256, 2015.
Shimazaki, H., Lu, M., and Koike, T.: Investigation of a nation-wide real-time solar radiation calculation method based on AMeDAS sunshine duration data, in: Proceedings of the 50th Annual JSCE Conference, 200–201, 1995.