the Creative Commons Attribution 4.0 License.
the Creative Commons Attribution 4.0 License.
 | 19 Apr 2024
Investment decision support for business sustainability improvement based on flood inundation simulations with a variety of extreme rainfall scenarios
Saki Nonaka
Kazuki Suzuki
Nobuyuki Iwamae
Daisuke Nohara
Yoriyuki Yamada
In recent years, heavy rainfall disasters have occurred frequently in Japan, which increases the importance for private companies to take flood countermeasures to prepare improved business continuity plans (BCPs). Although river authorities have published flood hazard maps for design rainfall and probable maximum rainfall in Japan, hazard information for floods with other return periods is also required for the target business facilities to make cost-effective plans and investment decisions based on flood risk assessment. In order to overcome the situation where public flood hazard maps do not provide enough information for risk-based business continuity planning, we developed a method to provide tailored flood risk information for a business site based on a series of flood inundation simulations for rainfall scenarios with various return periods in the expected inundation area of the Tama River, Tokyo, Japan. Calculated results showed that the inundation characteristics highly depend on the topographic features of the flood plain, suggesting the importance of assessment at a respective business site. We also present an example of the application of the proposed method of simulation results in designing the BCP.
- Article
(5927 KB) - Full-text XML
- BibTeX
- EndNote


In recent years, extreme rainfall has become more frequent and severe. Japan Meteorological Agency (JMA) reported that the frequency of heavy rainfall (>50 mm h−1) has increased at a rate of 27.5 times per decade in the past 45 years (JMA, 2021). Corresponding to intensified heavy rain, severe flood inundation disasters have occurred and caused enormous damages in Japanese river basins in recent years, namely, Kinu River basin in 2015 (Nagumo et al., 2016), Oda River basin in 2018 (Nohara et al., 2020), Chikuma River basin in 2019 (Fan et al., 2020), Kuma River basin in 2020 (Ministry of Land, Infrastructure, Transport and Tourism (MLIT), 2021), and Rokkaku River basin in 2021 (Yamamoto et al., 2022). In some of those cases, the magnitude of rainfall exceeds that for the river planning (design rainfall). In response to these backgrounds, the Flood Fighting Act was amended by the Japanese national government in May 2015 to oblige local governments to publish expected inundation areas (flood hazard maps) for probable maximum rainfall (PMR), in addition to that for design rainfall (MLIT, 2015a). Accordingly, information on the expected flood inundation area or depth is now available both for design rainfall and PMR. The design rainfall generally has a return period of 100 to 200 years for most major river systems in Japan, while the return period of PMR is typically around or over 1000 years (MLIT, 2015b).
In designing flood countermeasures such as construction of flood walls at business facilities, the maximum inundation depth is often used as hazard information at the site. Feasible height of flood walls is usually up to three meters due to constraint of cost and social reasons (land use, landscape, etc.). On the other hand, expected inundation depth of PMR is often much greater than the feasible height of walls in floodplains. This does not mean that construction of flood walls is useless for extreme floods, because it can be effective against extreme floods with smaller return periods (but greater than that of design rainfall) where expected maximum inundation depth can be smaller than the feasible wall height.
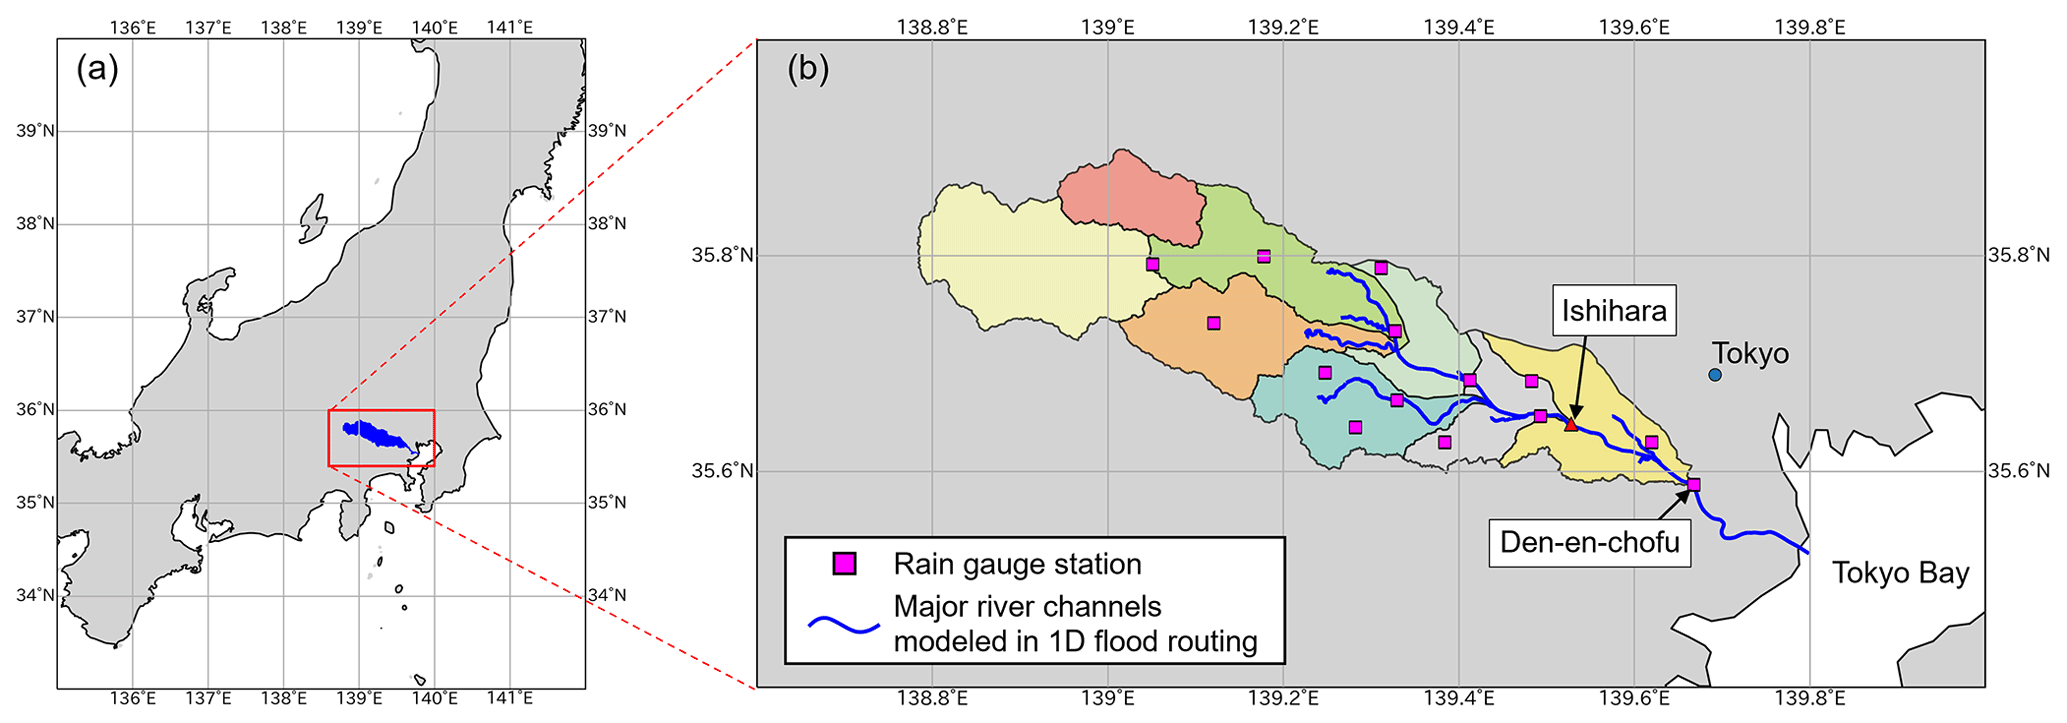
Figure 1(a) Location of the Tama River basin (filled in blue). (b) Watershed subdivision map for the upstream of Den-en-chofu used in the runoff analysis.
To take cost-effective measures and investment decisions based on flood risk assessment, it is therefore important to consider possible floods with return periods between the designed level and probable maximum, which occurs more frequently than the probable maximum. However, hazard maps for floods with an intermediate magnitude between the design rainfall and PMR have not been provided to the public. Business entities or companies, therefore, need to prepare such intermediate-scale hazard information to design measures for improved business continuity against floods.
In order to overcome the problem described above, we developed a method to estimate comprehensive flood risk information based on a series of flood inundation simulations for rainfall scenarios with a wide range of magnitudes and spatiotemporal distributions for a business site located in the expected inundation area of the Tama River, Tokyo, Japan. First, we examined the effect of the difference in rainfall scenario on the simulated river discharge and inundation depths in the study area. A risk analysis for examining optimal flood protection measures was then applied to an individual site located in the floodplain of the Tama River. Finally, we discussed how the proposed framework could provide useful information for decision-making regarding flood countermeasures.
2.1 Study area
The Tama River is located in the western part of Tokyo, Japan, and flows down from west to east (Fig. 1). The basin area is 1240 km2, and the estimated basin population is 4.14 million as of 2020 (MLIT, 2023a). The upper stream area is mountainous, and the urban area spreads out within the expected inundation area from the midstream to the downstream.
2.2 Framework
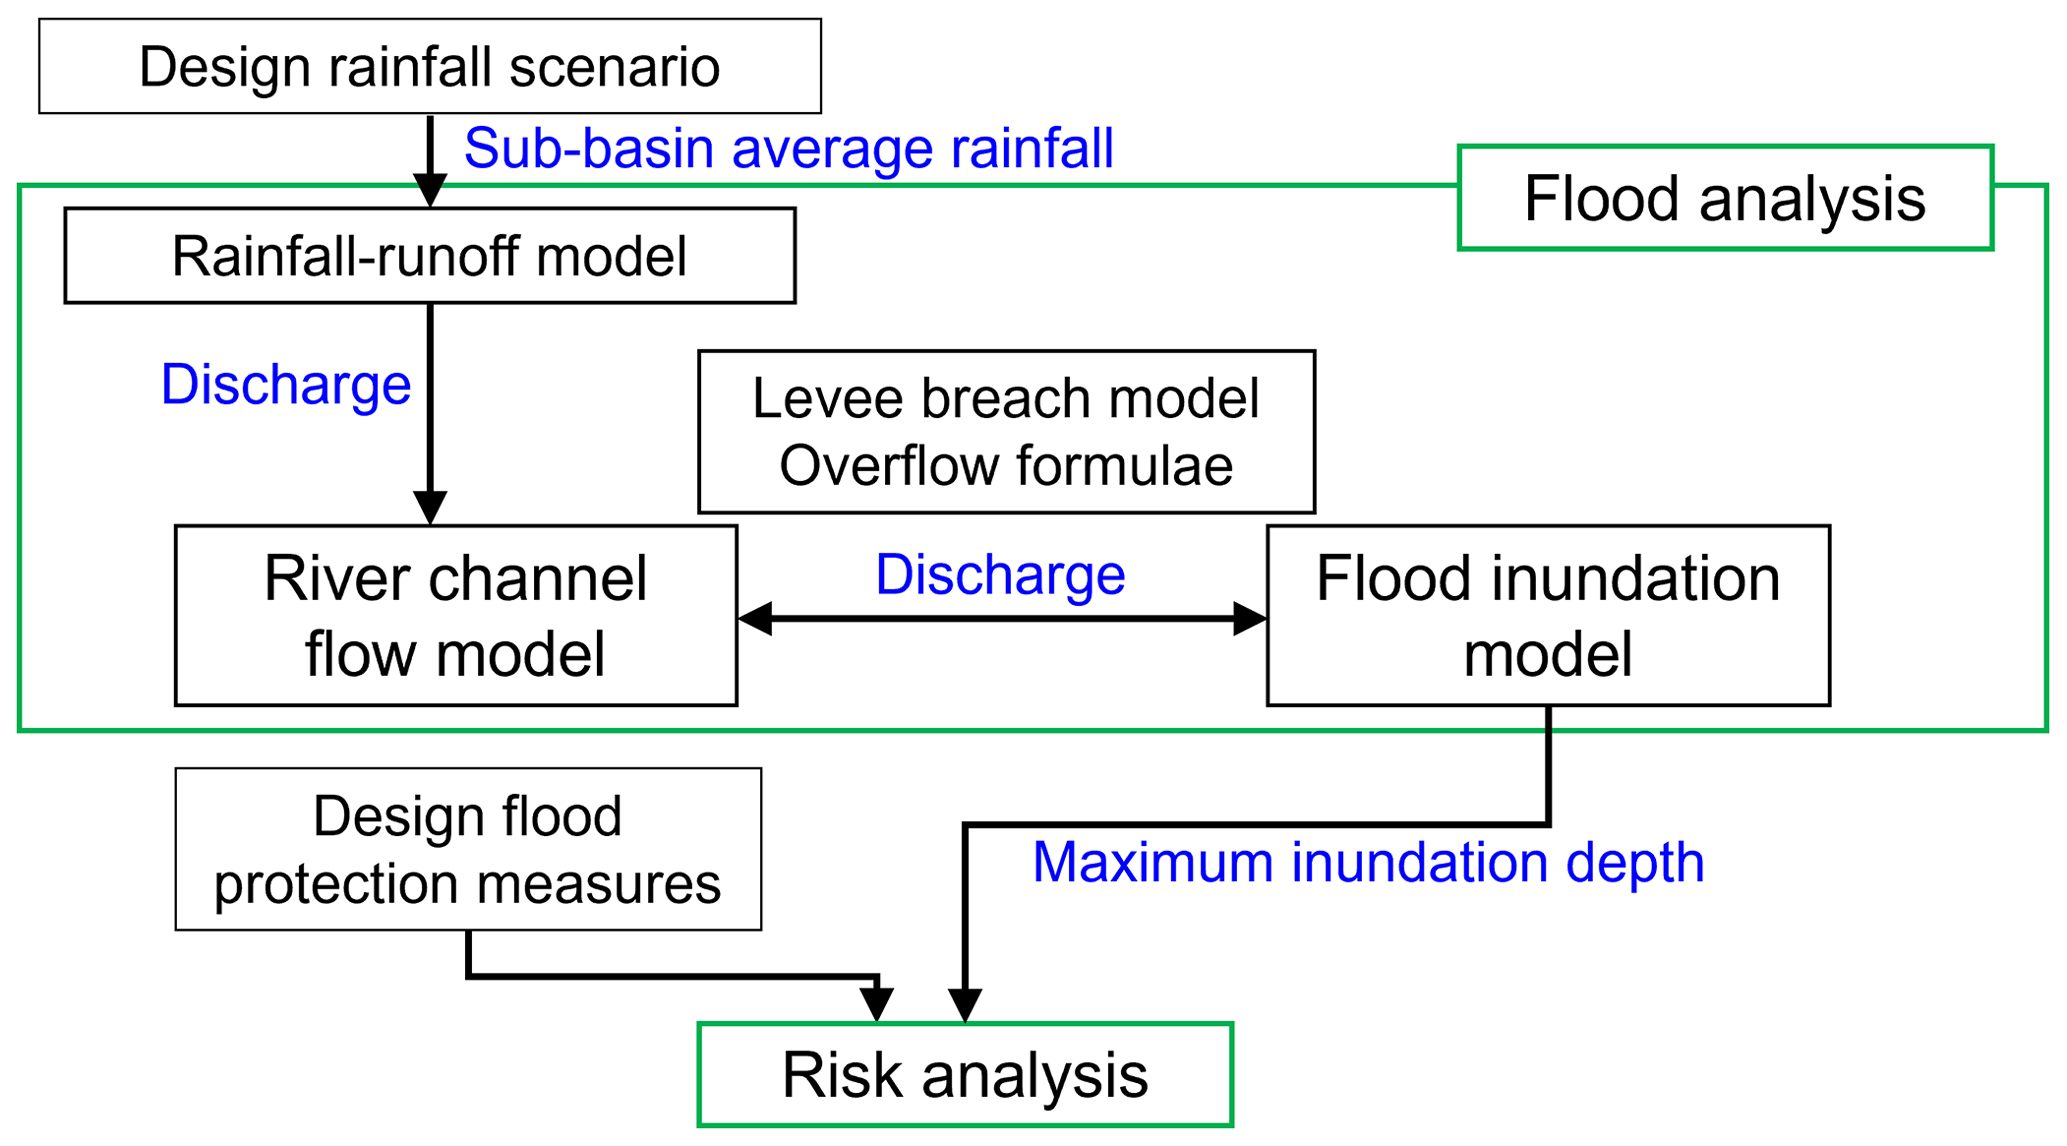
Figure 2 shows the framework for decision support employed in this study, which consists of two parts: a flood analysis and a risk analysis.
In the flood analysis, the distribution of inundation depth on floodplain is obtained by using rainfall-runoff model and flood inundation model. The rainfall-runoff model is based on the storage function method with two parameters and lag time proposed by Kimura (1961). The flood inundation model consists of a one-dimensional (1D) unsteady flow model to simulate river channel flow and a two-dimensional (2D) unsteady flow model for inundation flow on land. In the integrated model, the water exchange between land and river is determined by overflow formulae when the water level exceeds the levee top. The risk analysis was conducted based on the maximum inundation depth at the target site obtained from the flood analysis and the designed flood protection plan.
2.3 Simulation condition
In the rainfall-runoff simulation, the Tama River basin (upstream of Den-en-chofu) was divided into eight sub-basins (Fig. 1b). The runoff discharge calculated by the rainfall-runoff model for each sub-basin was used as the boundary condition (discharge at the upper-end or lateral inflow of the target river channel section) of the river channel flow model. The calculation domain of the river channel flow model was from 0.0 to 61.8 km upstream from the river outlet and parts of tributaries as shown by the blue lines in Fig. 1b, and discretized only in the longitudinal direction (1D model) with 200 m spacing. The reservoir operation and river upstream overflow are not considered when simulating river channel flow.
For the flood inundation simulation, only inundation from the river channels was considered in this study, assuming that no inundation occurs from the sewage systems or rain water in the calculation domain of the flood inundation model. The calculation domain of the flood inundation model was set large enough so that the flooded water did not reach the boundary. Grid spacing is 25 m, uniform in the whole calculation domain. The roughness coefficients are set according to land use. The effects of buildings and other land structures preventing flood flow are considered as porosity and transmissivity. The river levee breach can also be considered.
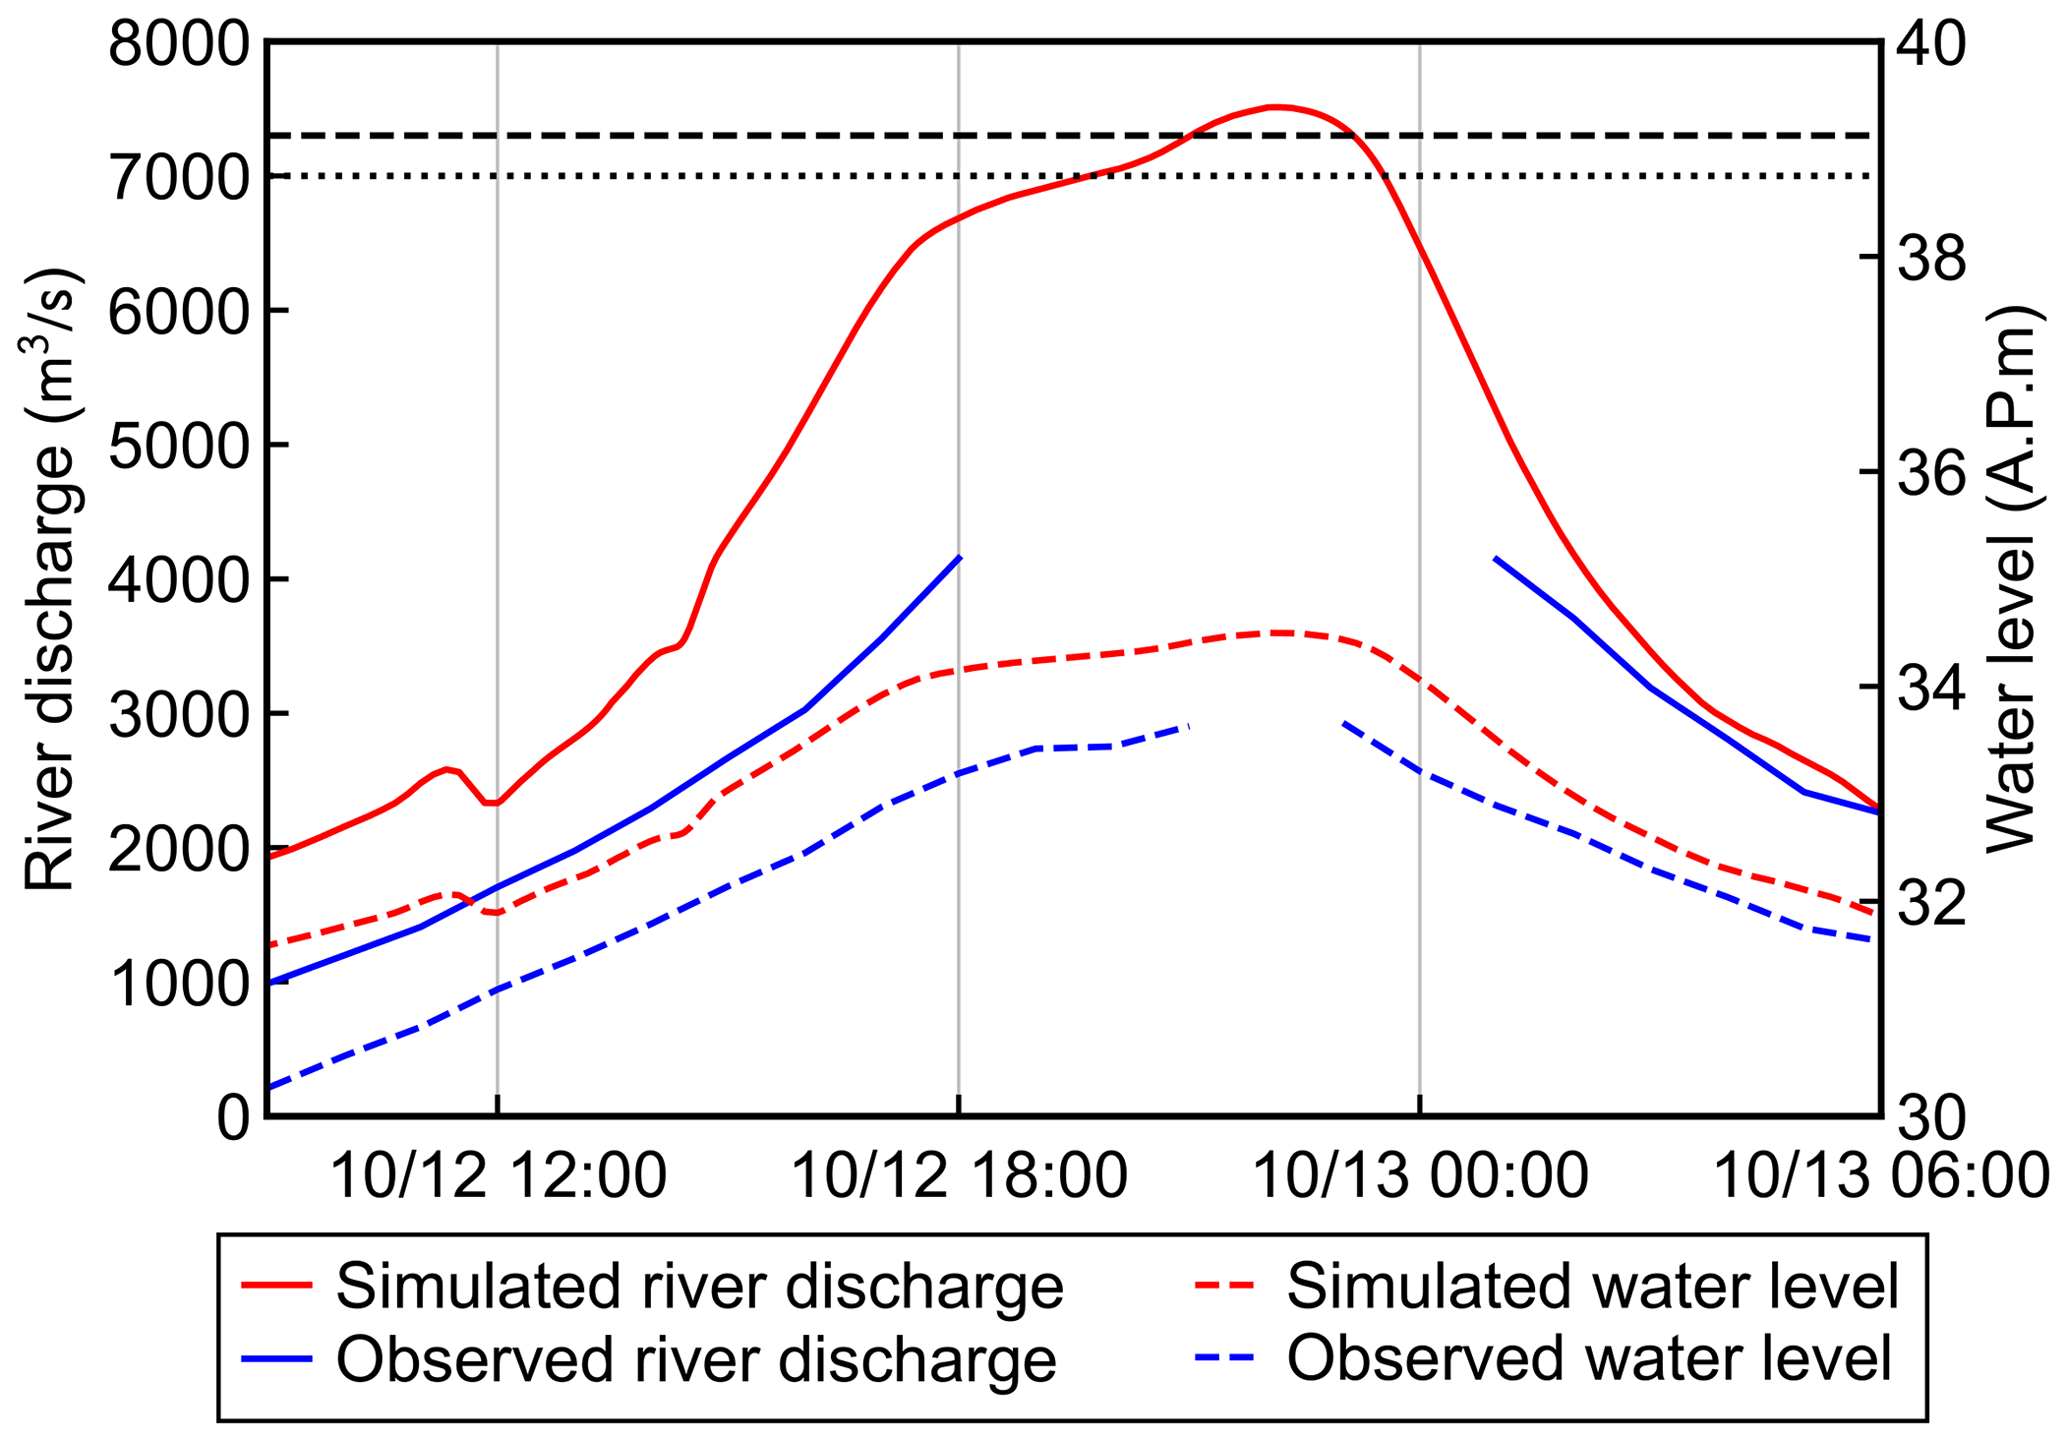
Figure 3Observed and simulated river discharge and water level at the Ishihara station for typhoon No. 19 event in 2019 (black dashed horizontal line is the estimated peak river discharge without overflow and dam operation, and black dotted horizontal line is the estimated peak river discharge with overflow and dam operation).
2.4 Validation of the analysis model
The validation of the analysis model is described in this section. Since there was no large-scale flood inundation due to river overflow in this study area, the rainfall-runoff model and the river flow model were validated against the river water level and discharge at Ishihara station for the heaviest rainfall recorded by typhoon No. 19 event in 2019. The observed data are derived from the Water Information System managed by MLIT. The simulated and observed data at the Ishihara station (see Fig. 1b for its location) is shown in Fig. 3. The sub-basin averaged rainfall input for the rainfall-runoff model was calculated from the radar-AMeDAS composite rainfall of JMA in the simulation. Observation of river water level was missing around the peak at Ishihara station in this flood event, so we also referred to water level data observed by the simplified water level gauge (denoted by SWLG hereafter) installed nearby Ishihara station as a backup (MLIT, 2022). It was seen in Fig. 3 that although the simulated water level tends to be excessive throughout, it generally shows the same trend as the observed water level. The time series of simulated and observed water levels are also consistent in that both of them have two peaks with the second peak being larger.
The observed discharge was also missing during flooding, and the peak discharge estimated from the observation data by the SWLG was 7000 m3 s−1 (black dotted horizontal line in Fig. 3, MLIT, 2022). According to the hypothetical reanalysis, assuming there was no reservoir operation or river upstream overflow, the peak river discharge was estimated to be 7300 m3 s−1 in that condition (black dashed horizontal line in Fig. 3, MLIT, 2023b). As described in Sect. 2.3, reservoir operation and river upstream overflow are not considered in this study when simulating river flow in the target area. When comparing the peak river discharge, which is a key variable for maximum inundation depth in the flood plain, the simulated peak river discharge (7500 m3 s−1) showed good agreement with the reanalyzed peak river discharge when overflow and dam operation was neglected in the upstream (7300 m3 s−1), with overestimation by 2.7 %. The difference between the simulated peak river discharge and that estimated from the observed water level (7000 m3 s−1) is also not very large, which also shows that the simulated results by the model are not far from the actual condition even though the model neglected the effects of dam operation and upstream overflow.
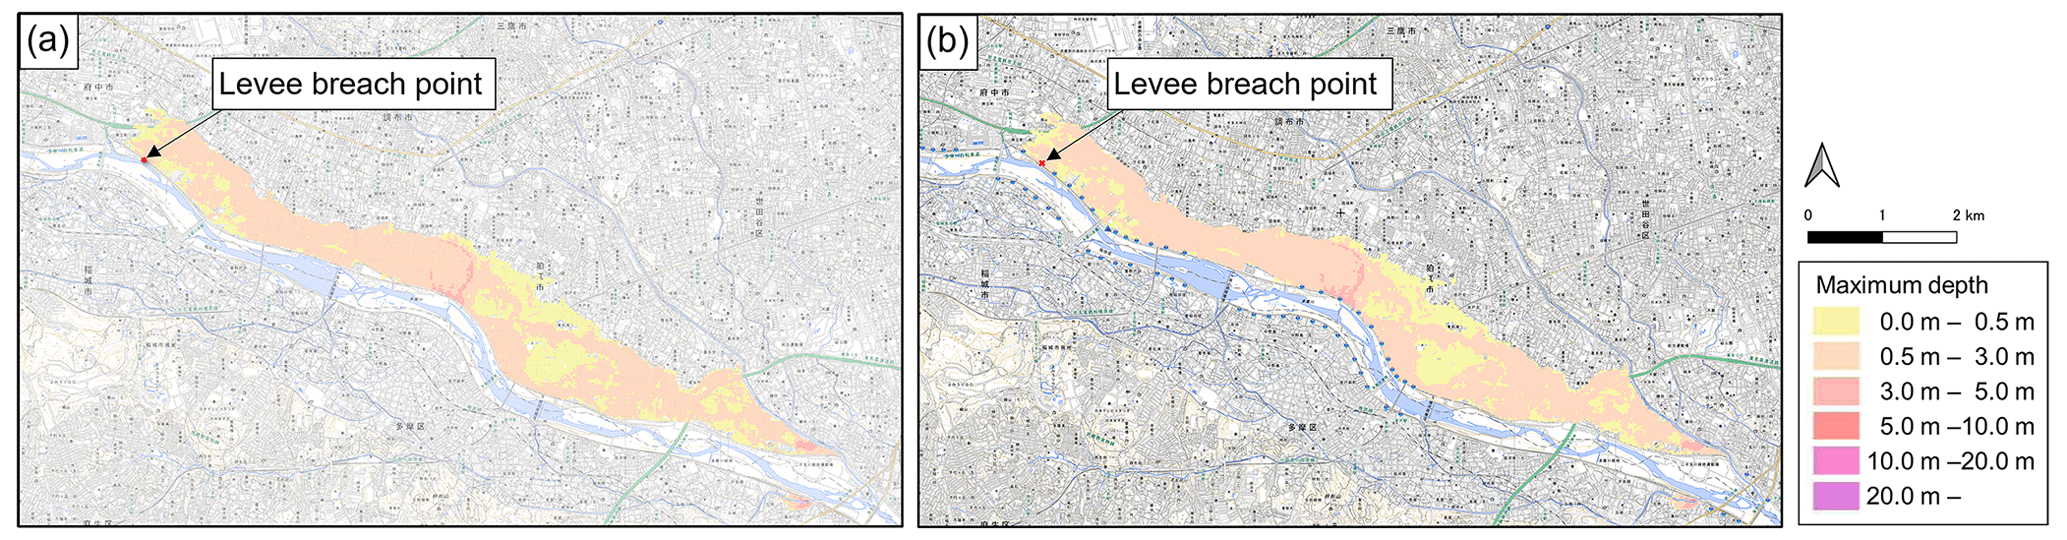
Figure 4(a) Simulated maximum inundation depth. Background map is sourced from GSI Tiles (https://maps.gsi.go.jp/development/ichiran.html, last access: 10 March 2024) created by Geospatial Information Authority of Japan. (b) Published expected inundation depth (MLIT, 2015d).
The flood inundation model used in this study was constructed in accordance with the guidelines for making expected inundation area maps published by MLIT (2015c). Since there is no record of large-scale inundation in the Tama River in recent years, this model was verified using the expected inundation area published by MLIT (2015d). Comparing the simulated maximum inundation depth with published data when the same levee breach point was selected for the design rainfall, it was confirmed that the distribution of inundated water was similar (Fig. 4). Therefore, this series of analysis models employed in this study is considered acceptable for estimating hazard of large-scale flooding for the Tama River.
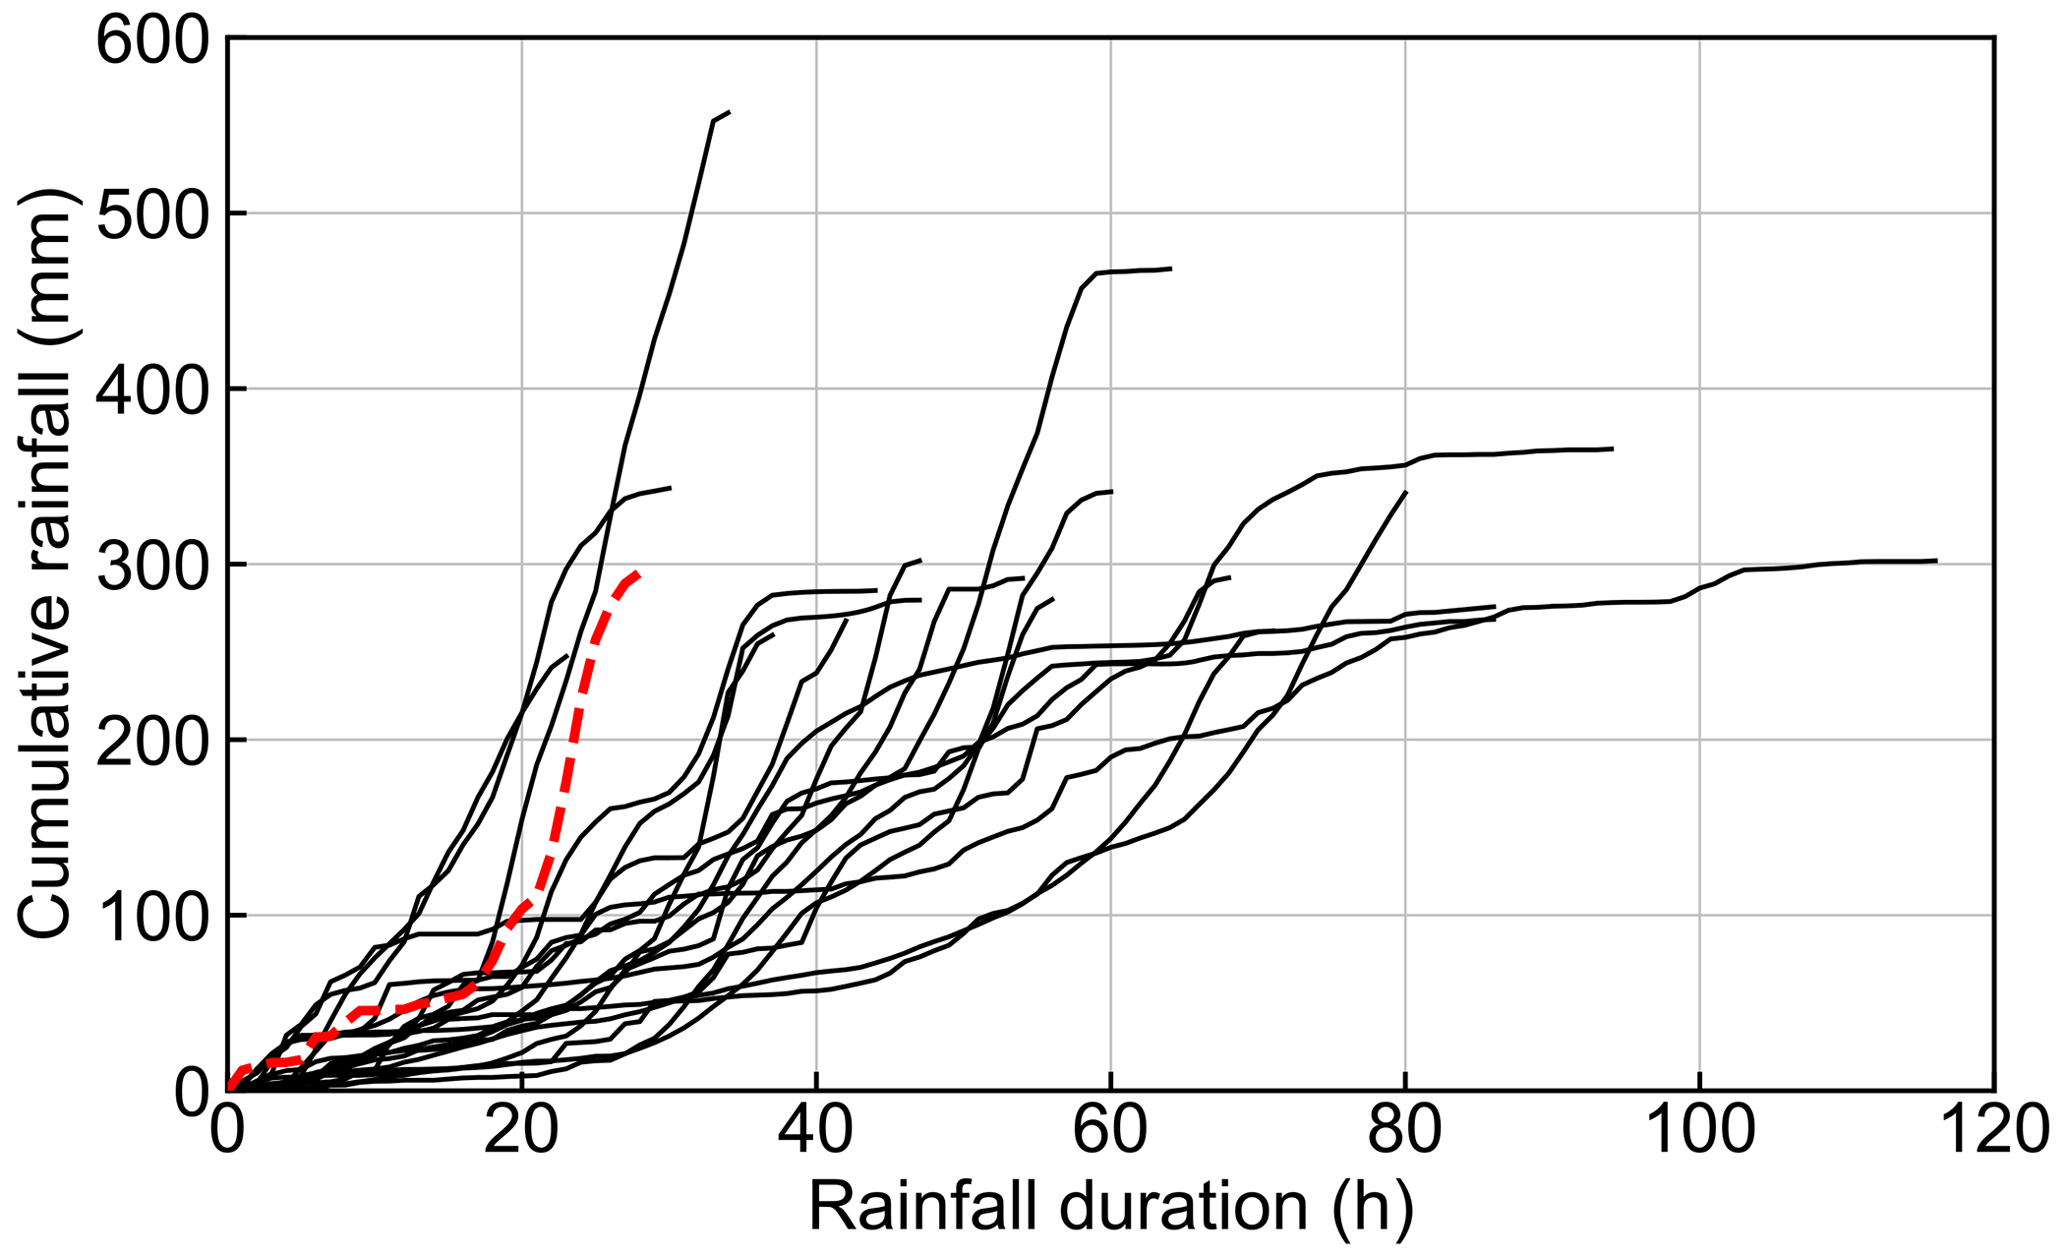
Figure 5Selected 20 rainfall events waveform (the red dashed line is the event used in the case of Fig. 6).
3.1 Rainfall scenarios
This study used hourly rainfall data from 14 stations: 11 rainfall stations from the Water Information System managed by MLIT and three Automated Meteorological Data Acquisition System (AMeDAS) rainfall stations provided by JMA. The period of obtained rainfall data was for 62 years, from 1958 to 2019. The top 20 rainfall events were selected in terms of total basin average rainfall (Fig. 5). The selected events have a wide range of intensity and duration.
The design rainfall for the Tama River basin is 457 mm in 48 h rainfall with return periods of 200 years (MLIT, 2016a), and the PMR is 588 mm in 48 h rainfall with return periods of over 1000 years (MLIT, 2016b). However, no information on estimated inundation has been published for an intermediate magnitude of floods between the two. In order to identify estimated inundation processes of such floods, each of 20 rainfall events was stretched so that maximum 48 h rainfall was identical to 457, 460–580 (10 mm intervals), and 588 mm, respectively. By this operation, 300 rainfall scenarios with different scales and patterns were generated (20 rainfall waveforms from different events ×15 different stretching factors). The Thiessen method was used to generate time series of sub-basin average rainfall as input for the rainfall-runoff model.
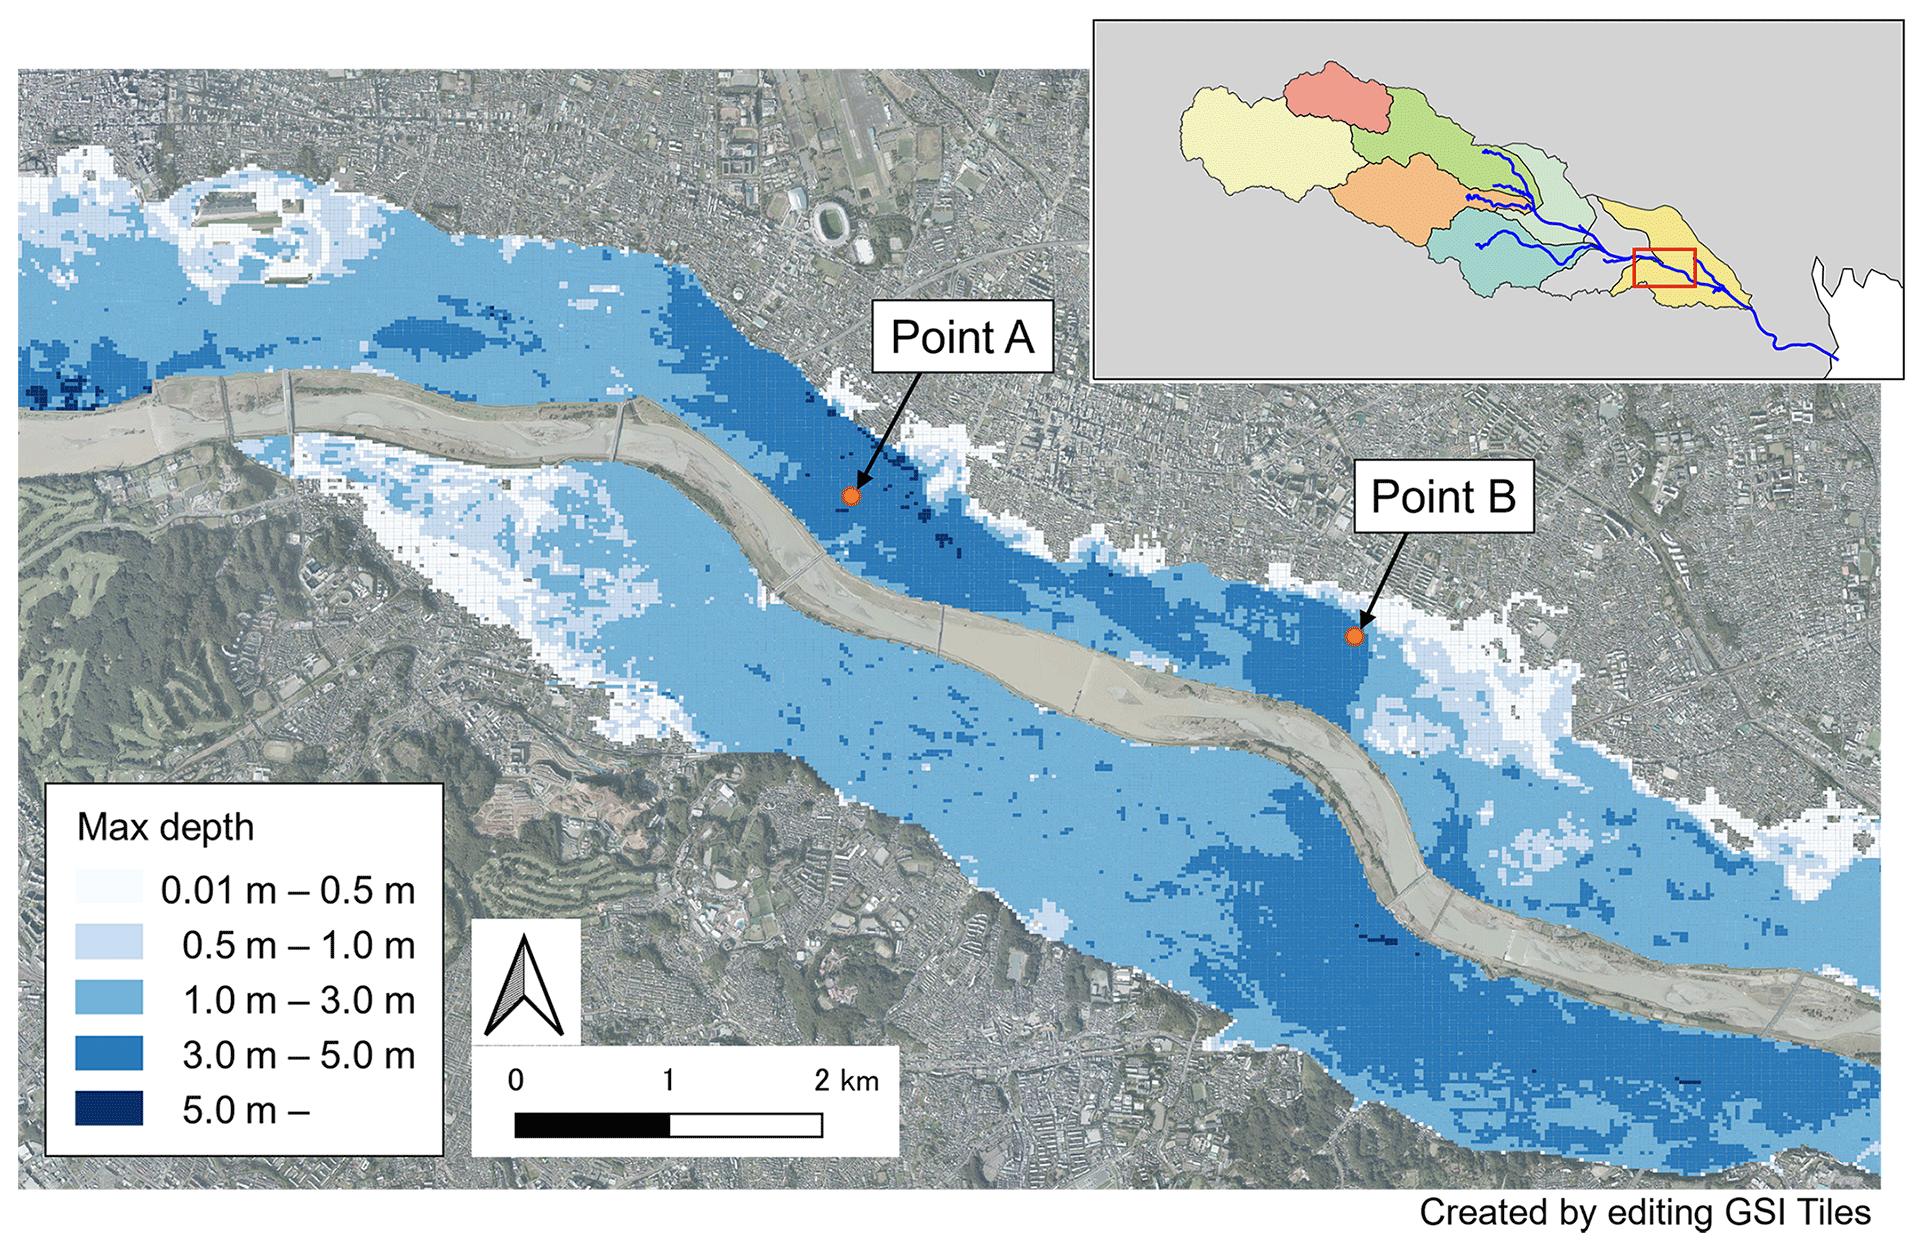
Figure 6Model calculated maximum inundation depth distribution. Background aerial photo is sourced from GSI Tiles (https://maps.gsi.go.jp/development/ichiran.html, last access: 10 March 2024) created by Geospatial Information Authority of Japan. The main map shows the area within the red square in the upper right.
3.2 Inundation scale
In this section, the effect of difference in rainfall scenario on estimated river discharge and inundation depths in the study area was investigated. Only overflow from the levee top was considered as the cause of flood inundation, assuming that no levee breach occurs. As an example of the result from the flood inundation simulation, Fig. 6 shows the distribution of the maximum inundation depth in the midstream estimated by using a rainfall scenario, which was derived by stretching the one shown by the red dashed line in Fig. 5 to be 588 mm in 48 h. Overflow occurred at several locations on both sides of the river, resulting in widespread inundation.
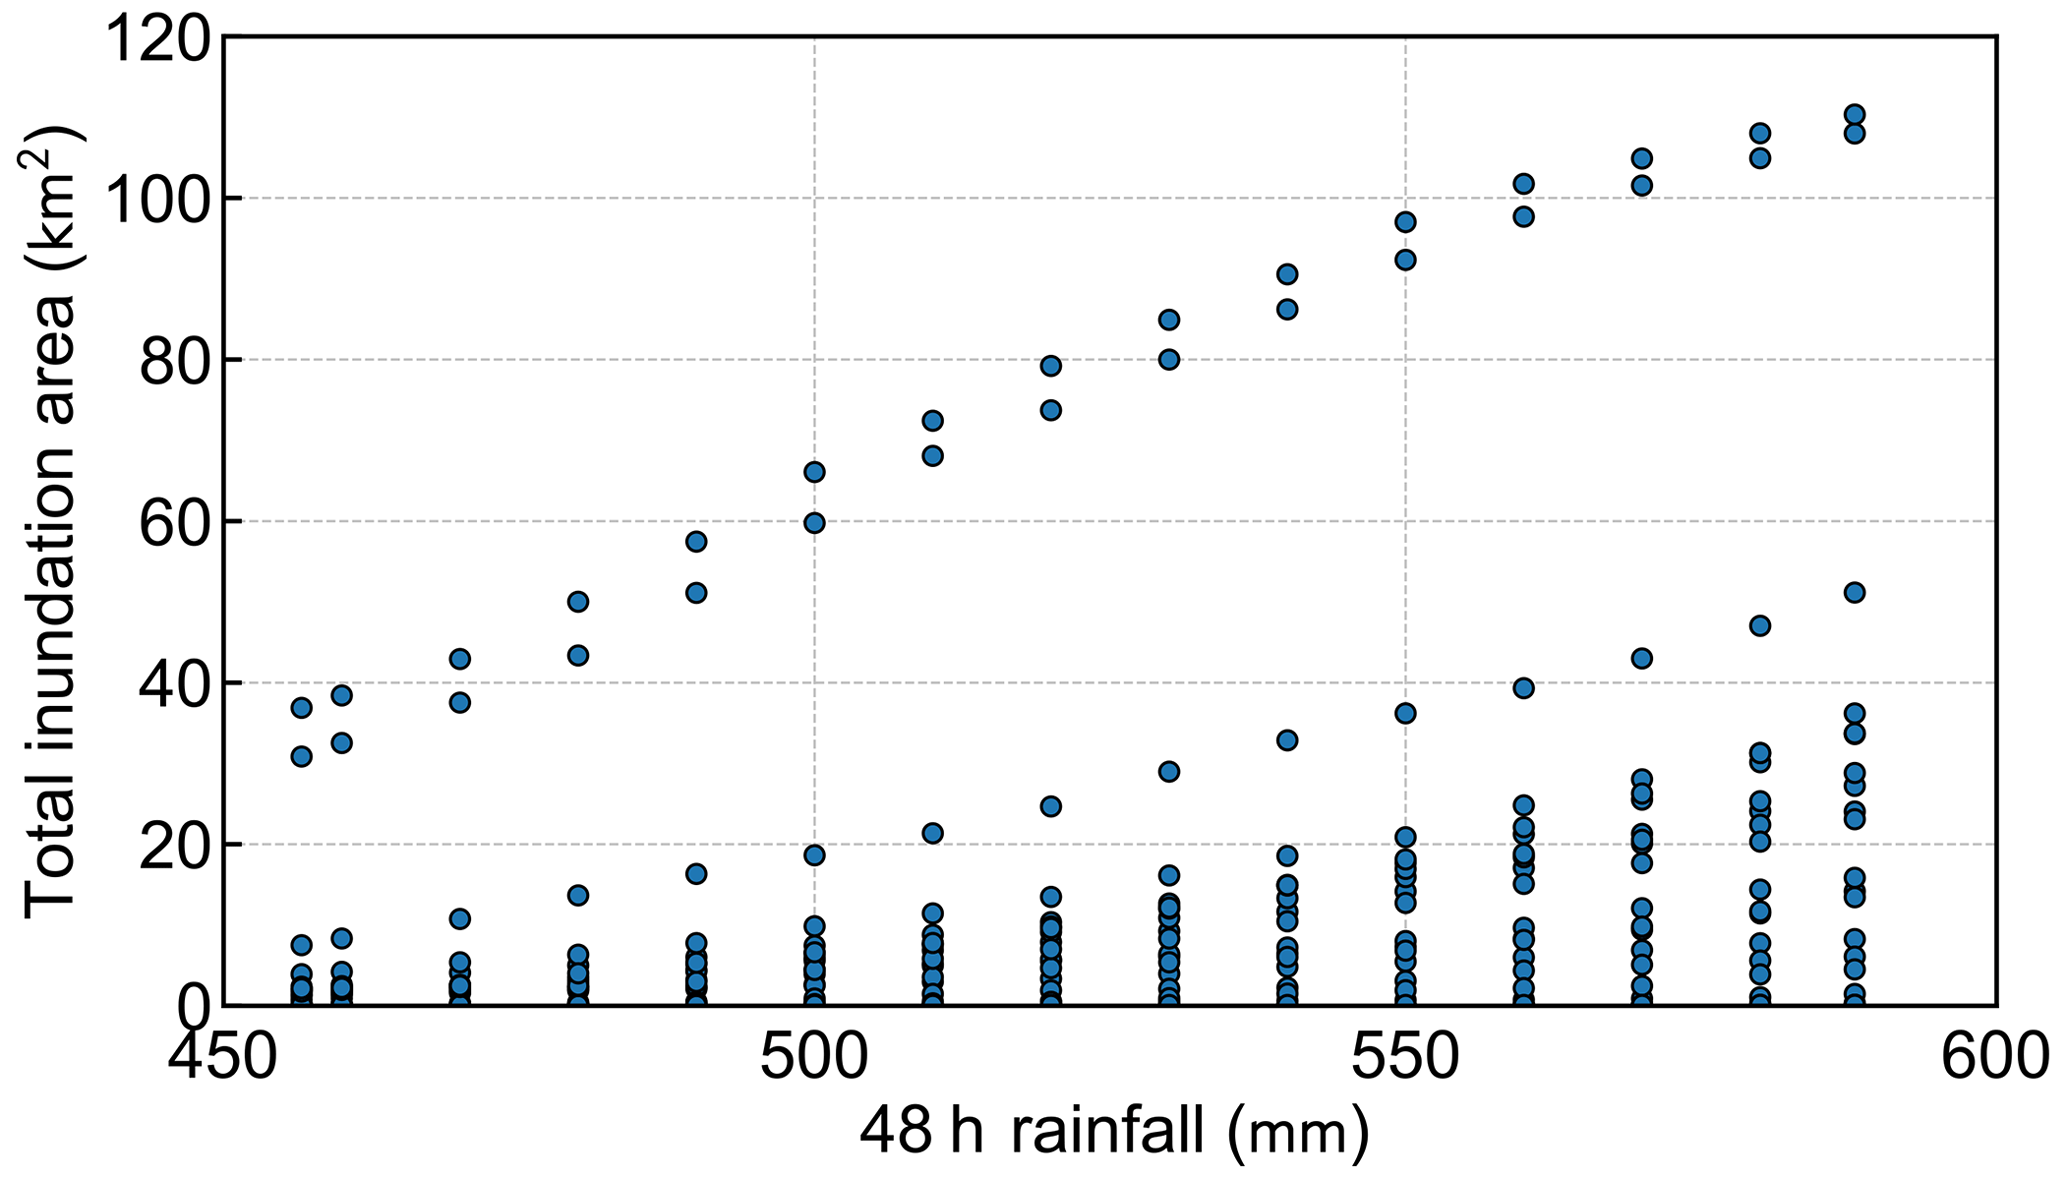
Figure 7 shows the relationship between 48 h rainfall and total inundation area. Even though rainfall scenarios with maximum 48 h rainfall with the same return period were applied, total inundation area varies widely because of their different rainfall pattern and peak intensity.
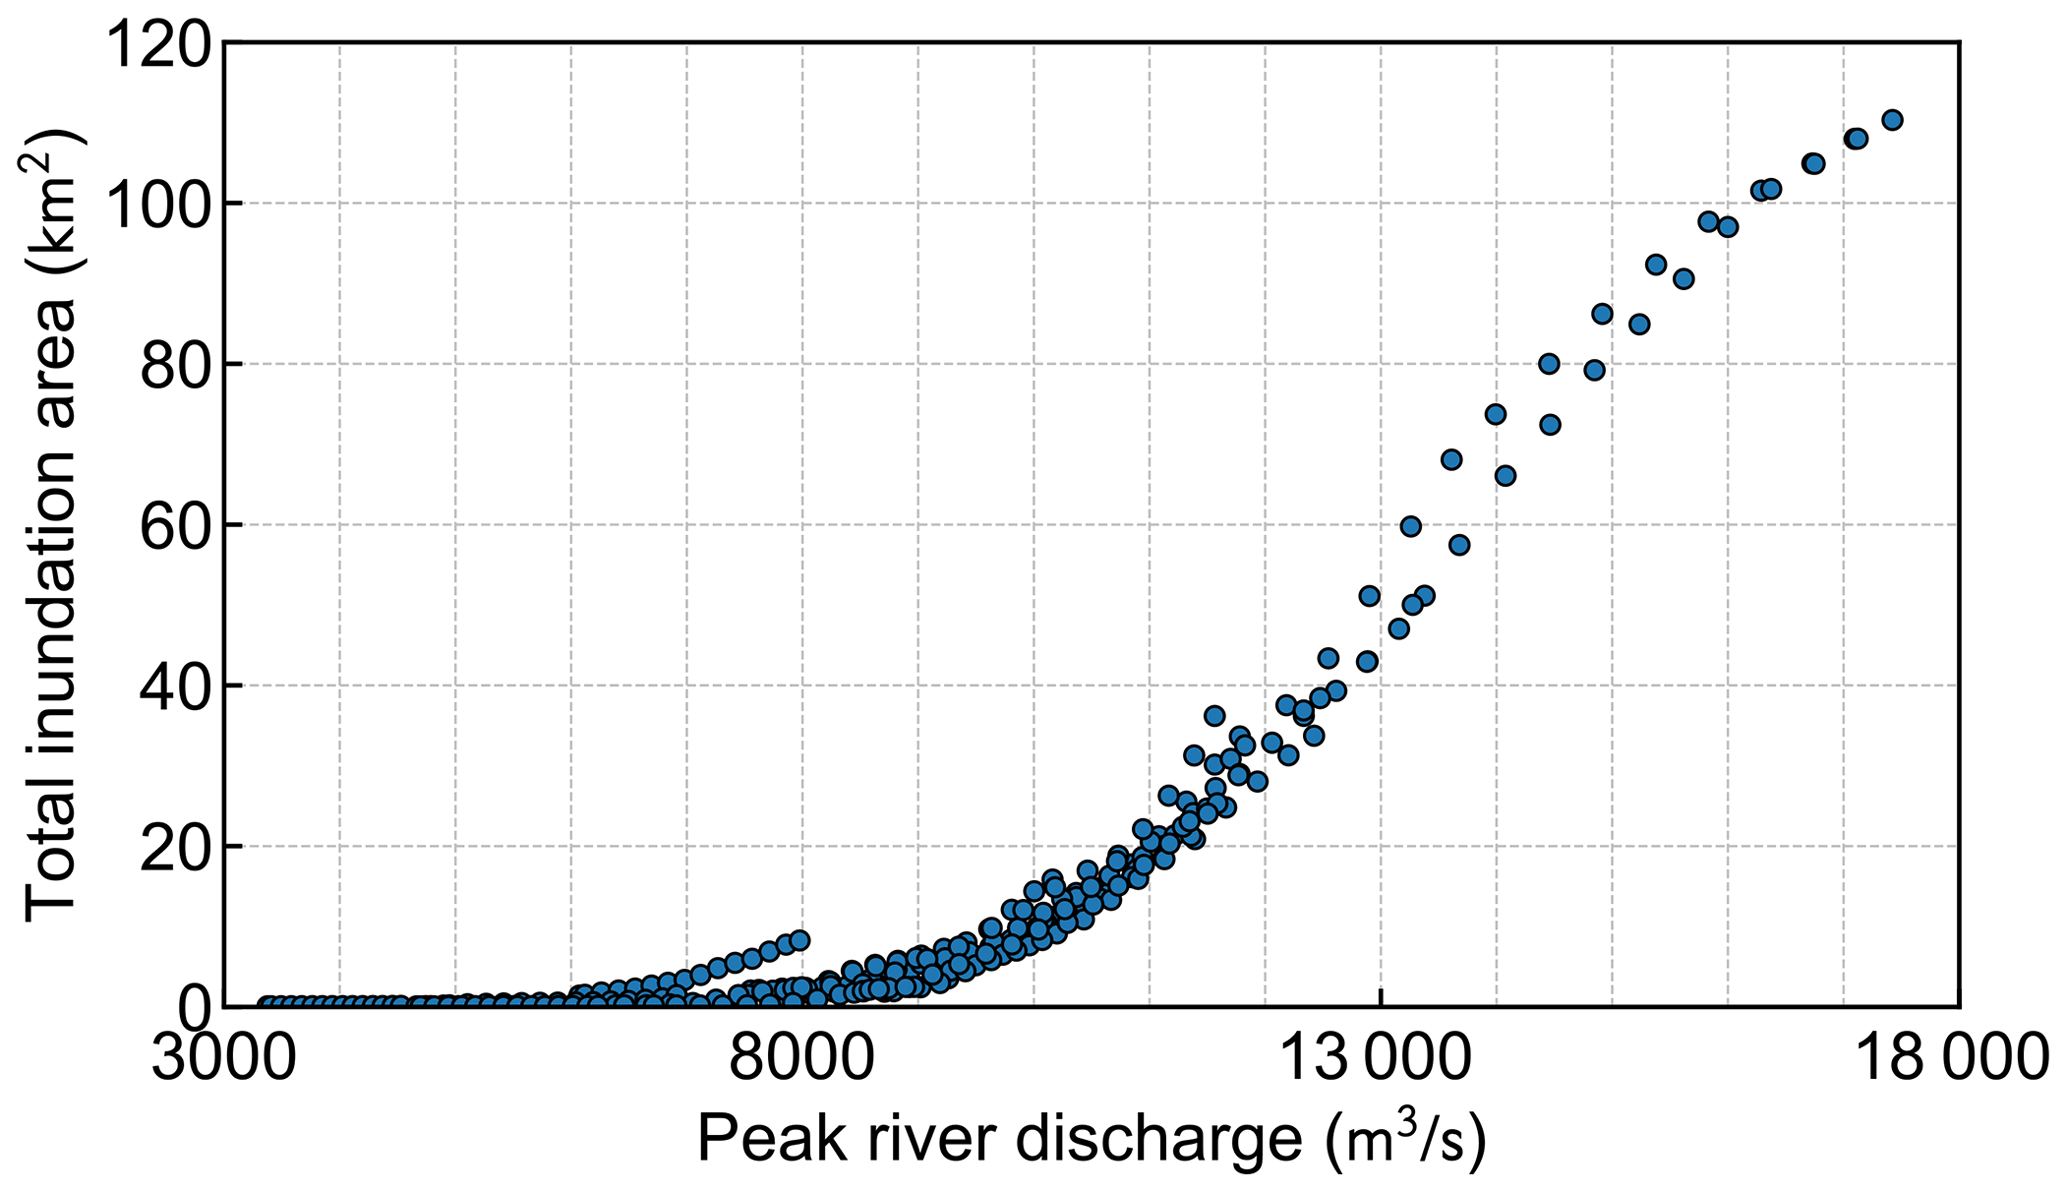
Figure 8 shows the relationship between the peak river discharge at Den-en-chofu station (see Fig. 1 for its location) and the total inundation area. Here, the values of peak river discharge were obtained from the rainfall-runoff analysis where overflow was not permitted to see the maximum potential river discharge at the river section, while the river bank overtop process in the target area was considered to calculate the inundation area. There is a correlation between the peak discharge and inundation area, regardless of the rainfall waveform.
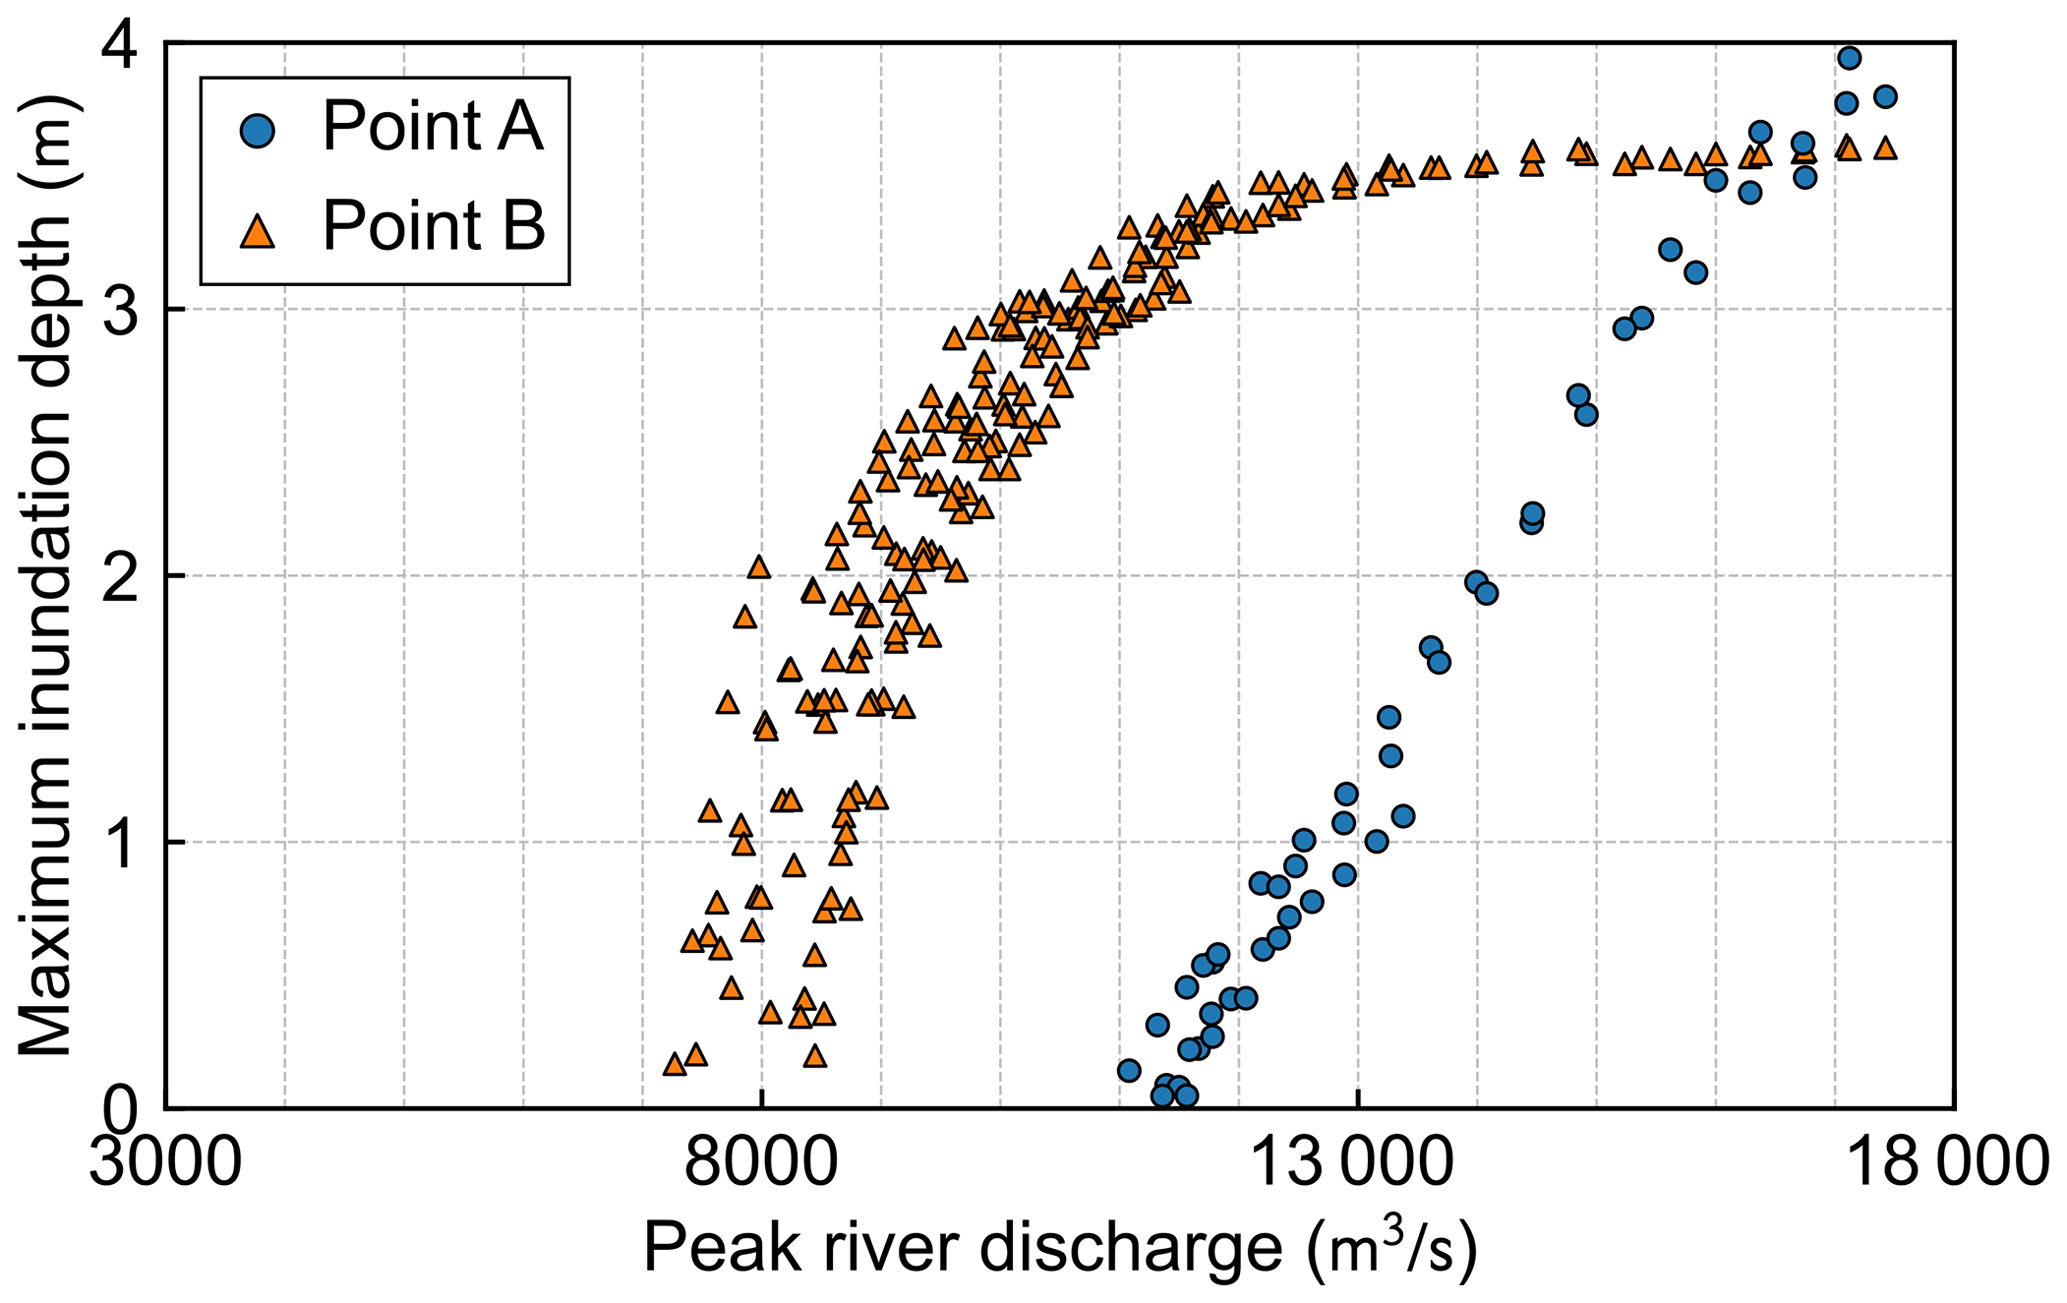
Figure 9Relationship between peak flow rate and maximum inundation depth at Point A and B (see Fig. 4 for location).
3.3 Inundation characteristics at individual site
Effects of peak discharge on flood inundation depth at the individual site were then analyzed. Figure 9 shows the relationship between peak discharge and maximum inundation depth at two sites, Points A and B (Fig. 6). We examined it at all inundated points and selected two locations with different features under the condition that the maximum inundation depth of 300 cases is the same level (3.5–4.0 m). At Point A, the maximum inundation depth increases linearly, with the peak discharge exceeding 11 000 m3 s−1. On the other hand, at Point B, the maximum inundation depth rapidly increases as the peak discharge exceeds 7000 m3 s−1, and it then approaches a constant depth. This difference in characteristics of increase in the maximum inundation depth can attributed to the difference in topography around the two sites. Point A is located in the middle of floodplain, where elevation gradually decreases along the river and inundated water smoothly flows down to the adjacent areas with lower elevation. On the other hand, since Point B is located in the lowest end of the floodplain surrounded by the terraces, inundated water tends to concentrate around there.
The tendency of increase in the maximum inundation depth with increasing peak river flow rate differs greatly for each location even in the same floodplain. It is therefore important to conduct flood simulations with various extreme rainfall scenarios to assess the vulnerability and risk of inundation at an individual business site. The measures to be taken against flood inundation can differ between sites where the inundation depth increases rapidly when the peak flow rate exceeds a certain level and those where the inundation depth increases linearly with the increase in the peak flow rate.
4.1 Procedure of flood risk analysis
Flood risk analysis was conducted based on the method proposed by Morita (2008). Construction of flood walls surrounding the target business site was considered as a flood protection measure. For simplification, the following assumptions were made regarding the relationship between inundation depth and the damage cost in this work:
-
No damage cost occurs when the inundation depth around the target site is less than the design height of the flood wall.
-
When the inundation depth exceeds the design height, a constant amount of damage (α JPY) occurs regardless of flood depth.
Under the above assumptions, the damage cost for floods with a return period T, D(T) [JPY], is expressed as follows:
where Tp is the flood protection level, which is identical to the return period of floods that can be protected by the designed protection measure (flood walls in this work). In this case study, damage cost is used in which damage reaches its maximum value as soon as inundation occurs, assuming an ideal site where there are highly expensive facilities vulnerable to submergence located on the ground or underground. In this case, flood damage largely depends on whether or not inundation occurs at the target site, no matter how deep the site is inundated. This characteristic of flood damage curve is often the case in the business site where heavy experimental or factory equipment is installed on the ground or underground. However, This assumption is not appropriate for estimating flood damage for the business site with facilities where the vertical distribution of assets is not concentrated below or on the ground. In that case, damage cost would vary depending on the flood depth in accordance with the vertical distribution of assets. The relationship between the maximum inundation depth and return period if floods can be obtained by the assessment of flood inundation characteristics described in the Sect. 2.
The expected annual damage (EAD) can be calculated by the following equation:
where p(t) is the probability density of flood occurrence at return period t. As an indicator of the effectiveness of flood protection measures, the degree of risk reduction (RR) by construction of flood walls with the flood protection level Tp can be defined as the following equation:
where is the EAD expected with no protection measure taken, and is that expected when a measure with protection level Tp is taken.
The construction cost is assumed to be proportional to the wall height. This assumption can be applied when the wall height is not too high, and the construction costs do not increase significantly with respect to the wall height. If the wall height exceeds several meters, the design of the foundation or temporary structure might be changed, so it is necessary to consider the detailed structure. Based on the above assumption, the construction cost is expressed as the following equation:
where β is a construction cost for a unit height of the walls, and h is the wall height, respectively. Note that in actual situations, fixed costs need to be included, and variable costs are not necessarily proportional to wall height.
Since can be considered as the benefit of the protection measure, the optimal plan for the structural measure (height of flood walls in this work) can be obtained by maximizing the benefit-cost ratio, which is given by the following equation:
where X is the useful life.
4.2 Example for application of the proposed method
A case study of flood risk analysis is conducted targeting Point A (Fig. 6) based on the assumptions explained in the Sect. 4.1. Three plans for construction of flood walls were considered as a case study. Height of walls in three plans correspond to expected inundation depth in floods with return periods of 200 years (in Plan 1), 500 years (in Plan 2), and 1600 years (in Plan 3) in terms of 48 h rainfall, respectively. In this case study, we selected the rainfall scenario that resulted in the largest inundation area at the design scale (456 mm in 48 h rainfall) among those described in Sect. 3.1. The temporal distribution of rainfall was then adjusted so that the peak river discharge calculated from the selected rainfall scenario became identical to the peak river discharge used in the actual public flood hazard map for design rainfall for the Tama River basin. This rainfall pattern was also employed to generate rainfall scenarios for the other target return periods of 48 h rainfall. It has been confirmed that this rainfall scenario is one of the scenarios that provide the greatest inundation depth for the target site. We compared the maximum inundation depths at the target site when the levee was breached every 200 m for the design rainfall. We selected the levee breach point that resulted in the largest maximum inundation depth. The risk analysis was performed using the maximum inundation depths obtained from the flood inundation analysis considering the levee breach condition.
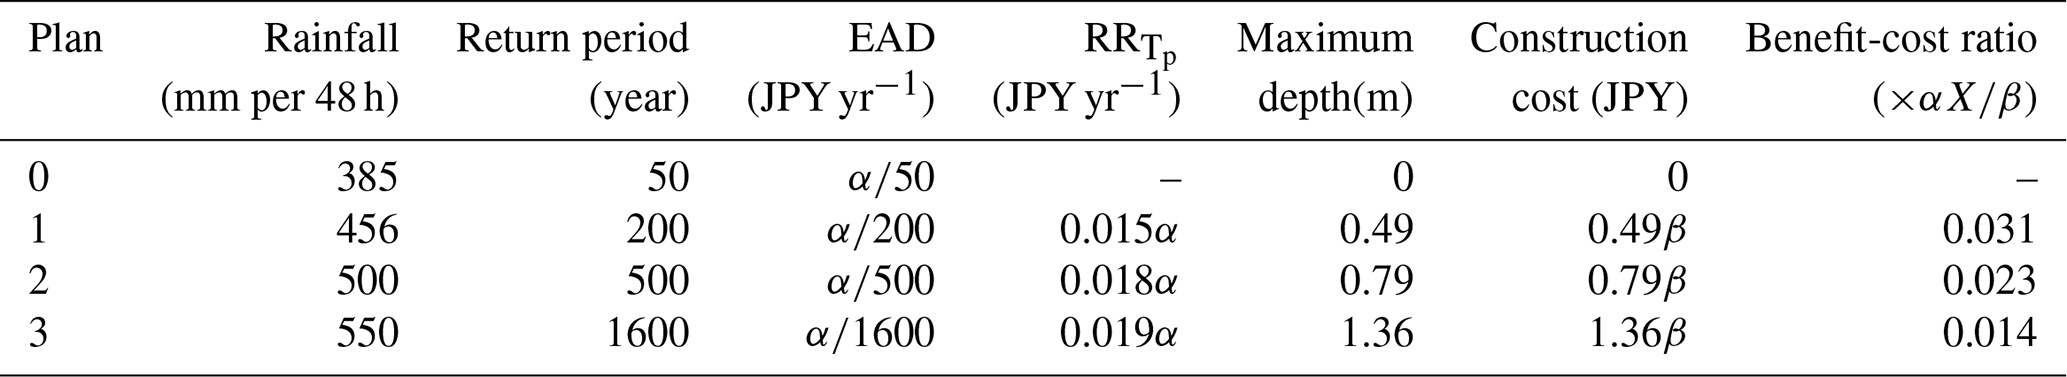
The results are summarized in Table 1. Note that Plan 0 In Table 1 is the case without construction of walls, and the flood protection level corresponds to 50 years in that case. According to Eq. (5), the optimal plan was Plan 1 which maximized the benefit-cost rate among the plans. This case study used a considerably simplified model for damage and construction costs. If the damage costs and flood countermeasures costs can be properly modeled according to the actual situation of the target business site, we can make more realistic examinations in the same procedure. Like this way, one can derive science-based information on benefit-cost relationships for each of considered flood protection measures, which can be considered useful for investment decision for increased flood protection capability of business entities.
In this work, a method to estimate comprehensive flood risk information for a business site was developed based on a series of flood inundation simulations for various rainfall scenarios. It was shown that the total inundation area is greatly different even for the same return period of rainfall when using rainfall scenarios with various spatiotemporal patterns. Characteristics of increase in maximum inundation depth with peak discharge varied greatly depending on the topography around the sites, which shows importance to analyze expected inundation processes in detail site by site in order to design robust flood protection measures. Combined with the risk analysis approach presented in Sect. 4, the proposed method can help decision-makers develop flood protection plans for individual business sites based on the hazard information derived from numerical simulations.
Several assumptions were made in this case study. By using a similar framework, it is possible to propose a reasonable level of countermeasures based on the simulations, taking into account the balance between the cost of implementing flood countermeasures and the risk reduction effect of the countermeasures. Depending on the actual situation of flood risk at the target location, it is possible to consider arbitrary scales of external forces that are insufficient from publicly available information. In this case study, we used rainfall patterns and levee breach points that gave the most severe flood inundation for the target site. However, in actual investment decisions, there are also other constraints such as budget, other rainfall patterns that give less flood inundation may also be considered in flood protection planning for private companies if they can accept risks caused by the relaxed assumption.
Although potential effectiveness was shown, there are still things to be improved in the proposed method, such as consideration of inundation from sewer systems or use of extreme rainfall scenarios derived from future climate experiments with consideration of climate change effects. Further studies are therefore needed to establish a comprehensive approach on investment decision support for improved BCPs against floods.
The data that support the findings of this study are available from the corresponding author, upon reasonable request.
SN, KS, and NI designed the research framework. SN analyzed the data and prepared the draft. SN and DN improved the research design, academic objectives, literature review, and interpretation of simulation results. KS, NI, DN and YY contributed to improve the manuscript.
The contact author has declared that none of the authors has any competing interests.
Publisher's note: Copernicus Publications remains neutral with regard to jurisdictional claims made in the text, published maps, institutional affiliations, or any other geographical representation in this paper. While Copernicus Publications makes every effort to include appropriate place names, the final responsibility lies with the authors.
This article is part of the special issue “ICFM9 – River Basin Disaster Resilience and Sustainability by All”. It is a result of The 9th International Conference on Flood Management, Tsukuba, Japan, 18–22 February 2023.
This paper was edited by Mamoru Miyamoto and reviewed by two anonymous referees.
Fan, J. and Huang, G.: Evaluation of Flood Risk Management in Japan through a Recent Case, Sustainability, 12, 5357, https://doi.org/10.3390/su12135357, 2020.
JMA: Number of occurrences of hourly precipitation exceeding 50 mm in Japan (AMeDAS), https://www.data.jma.go.jp/cpdinfo/extreme/extreme_p.html, last access: 15 November 2022.
Kimura, T.: The Flood Runoff Analysis Method by the Storage Function Model, The Public Works Research Institute, Ministry of Construction, 1961 (in Japanese).
MLIT: Flood fighting act amendment, https://www.mlit.go.jp/river/suibou/suibouhou.html (last access: 17 October 2023), 2015a.
MLIT: Manual of determining probable maximum precipitation for making expected inundation (river and inland floods), https://www.mlit.go.jp/river/shishin_guideline/pdf/shinsuisoutei_honnbun_1507.pdf (last access: 17 October 2023), 2015b.
MLIT: Manual for making estimated flood inundation area map, 4th edn., https://www.mlit.go.jp/river/shishin_guideline/pdf/manual_kouzuishinsui_1710.pdf (last access: 17 October 2023), 2015c.
MLIT: Map viewer for estimated inundation at an arbitrary point, https://suiboumap.gsi.go.jp/ (last access: 17 October 2023), 2015d.
MLIT: Expected inundation area for Tama River system (design rainfall), https://www.ktr.mlit.go.jp/ktr_content/content/000647024.pdf (last access: 17 October 2023), 2016a.
MLIT: Expected inundation area for Tama River system (probable maximum rainfall), https://www.ktr.mlit.go.jp/ktr_content/content/000647812.pdf (last access: 17 October 2023), 2016b.
MLIT: Kuma River flood archive, Chapter 1. Weather overview, https://kumariver-r0207archive.jp/overview/detail/chapter1-1.html (last access: 17 October 2023), 2021.
MLIT: Measures based on the 2019 East Japan Typhoon (typhoon No. 19), https://www.ktr.mlit.go.jp/ktr_content/content/000840783.pdf (last access: 17 October 2023), 2022.
MLIT: Basic river management policy for Tama River system (Overview of basin and rivers for Tama River system), https://www.mlit.go.jp/river/basic_info/jigyo_keikaku/gaiyou/seibi/pdf/tama_3.pdf, last access: 17 October 2023a.
MLIT: Explanatory materials regarding changes in the basic river management policy for the Tama River system, https://www.mlit.go.jp/river/basic_info/jigyo_keikaku/gaiyou/seibi/pdf/tama_7.pdf, last access: 17 October 2023b.
Morita, M.: Flood risk analysis for determining optimal flood protection levels in urban river management, J. Flood Risk Manage., 1, 142–149, 2008.
Nagumo, N., Ohara, M., Kuribayashi, D., and Sawano, H.: The 2015 Flood Impact due to the Overflow and Dike Breach of Kinu River in Joso City, Japan, Journal of Disaster Research, 11, 1112–1127, https://doi.org/10.20965/jdr.2016.p1112, 2016.
Nohara, D., Takemon, Y., and Sumi, T.: Real-time flood management and preparedness: Lessons from floods across the western Japan in 2018, in: Advances in Hydroinformatics, edited by: Gourbesville, P. and Caignaert, G., Springer Water, Springer, Singapore, 287–304, https://doi.org/10.1007/978-981-15-5436-0_22, 2020.
Yamamoto, H., Kanemitsu, N., Koba, A., Tsujimoto, H., Shimai, K., Sakamoto, K., and Iwaya, K.: Damage Investigation of Flood Disaster in Rokkaku River, Saga Prefecture by Heavy Rainfall of Autumnal Rain Front of August, 2021, Journal of Japan Society for Natural Disaster Science, 41-2, 145–175, 2022.