the Creative Commons Attribution 4.0 License.
the Creative Commons Attribution 4.0 License.
 | 19 Apr 2024
Development of model predictive controls for flood control and power generation of reservoir cascade in Mahaweli basin, Sri Lanka to mitigate energy and economic crisis provoked by the COVID-19 pandemic
Ranapura Dewage Thilini Kaushalya
Sajana Pramudith Hemakumara
Selvarajah Hemakanth
Seenipellage Chaminda Sugeeshwara
Mahaweli basin is the largest river basin in Sri Lanka which receives high-intensity rainfall reasoned to frequent flooding. Mahaweli River passes through Victoria, Randenigala and Rantambe reservoirs which cater for drinking, irrigation, hydropower, and environmental water requirements. These reservoirs contribute to 63 % of the hydropower production of the country. The development of flood control methods for this cascade will mitigate flash floods and lower the risk of reservoir spill during peak hours. Therefore, a system dynamic model is developed using VENSIM software to analyse the complex correlation between flood storage and power flow considering short-term weather prediction. Model predictive controls are applied to analyse the system to enhance power generation through storage optimization. This brings direct economic benefits and be a sustainable solution for the energy crisis provoked by the economic loss that occurred during the COVID-19 pandemic.
- Article
(1891 KB) - Full-text XML
- BibTeX
- EndNote


Sri Lanka is a water-rich tropical country that receives rainfall through the monsoon, convection, and depression. The mean annual rainfall of the country varies from 900 mm in the dry zone to 5000 mm in the wet zone (Department of Meteorology, 2016). The water resources system of Sri Lanka comprises groundwater sources and surface water sources such as rivers, lakes and reservoirs and small tank cascades.
Although Sri Lanka has a radial type of river network which starts at the central highlands and flows all over the island before reaching the sea, currently it faces diverse problems when addressing water issues. The frequent occurrence of high-intensity short duration rainfall cause floods in the wet climatic zone of the country and prolonged hot weather in the dry zone cause significant water deficiencies in the dry zone. Therefore, it is noted that the water management practices in both dry and wet zones need to be carefully analysed and revise appropriately.
Energy generation in Sri Lanka mostly depends on the use of hydropower and coal. The share of electricity production by hydropower, coal, crude oil, and wind energy are 45 %, 43 %, 9 %, and 3 % respectively (Ceylon Electricity Board, 2022). However, due to the impact of the Covid-19 pandemic, the country underwent several periods of lockdown to prevent the spread of the virus. Therefore, Sri Lanka could limit the death count to 16 774 (Health Promotion Bureau, 2022) which is a relatively lesser amount compared with world statistics. As a result of the Covid-19 pandemic, the economy of Sri Lanka experienced a drastic downturn and currently, the whole country is suffering due to the economic crisis as well as the energy crisis. Considering the current situation of the country, it is noted that the optimization of hydropower production will bring direct benefits to the economy. But it should be carried out carefully to avoid any disruption to domestic and irrigation water supply because the food supply also plays a key role in the economy.
Therefore, the optimization of reservoir storage to cater for additional flood storage was assessed for the reservoir cascade located in the upper watershed of the Mahaweli river basin. A System Dynamic (SD) model is developed using the VENSIM software to analyse the complex correlation between flood storage, irrigation, drinking, environmental and power flow requirements considering short-term weather prediction.
Mahaweli basin is the largest river basin in Sri Lanka covering 10 327 km2 (Survey Department, 2012) area which is about 16 % of the total land area of the country. Mahaweli river is the largest and longest river in the country which is 335 km (Survey Department, 2012) in length and passes through all three climatic zones namely wet, dry, and intermediate zones. The river originated at the Hatton Plateau of Sri Pada Mountain and flows to the sea at Koddiyar Bay in Trincomalee.
The basin receives rainfall by North-East and South-West monsoon rainfall periods. The upper catchment of the basin receives rainfall during the Southwest monsoon from May to September. The wet climatic zone of the country usually receives high-intensity rainfall during this season, and it causes extreme floods in the wet zone. However, the downstream reaches of the Mahaweli river lie within the dry zone and more water can be released to downstream for optimal flood control during this period. Therefore, the establishment of an efficient water management system in the Mahaweli river basin is vital to store a portion of flood discharge for future use.
The upper catchment of the Mahaweli river basin comprises a series of multi-purpose reservoirs which cater for the drinking, irrigation, hydropower, and environmental water requirements. At the upstream reach, the river passes through Victoria, Randenigala, and Rantambe reservoirs generating hydroelectric power at each location. These three reservoirs contribute to 63 % (Ceylon Electricity Board, 2022) of the hydropower production of the country. The cascade system supplies irrigation water for agricultural areas during both Maha and Yala seasons which are the two main cultivation seasons of Sri Lanka. The location of the selected reservoir cascade is shown in Fig. 1.
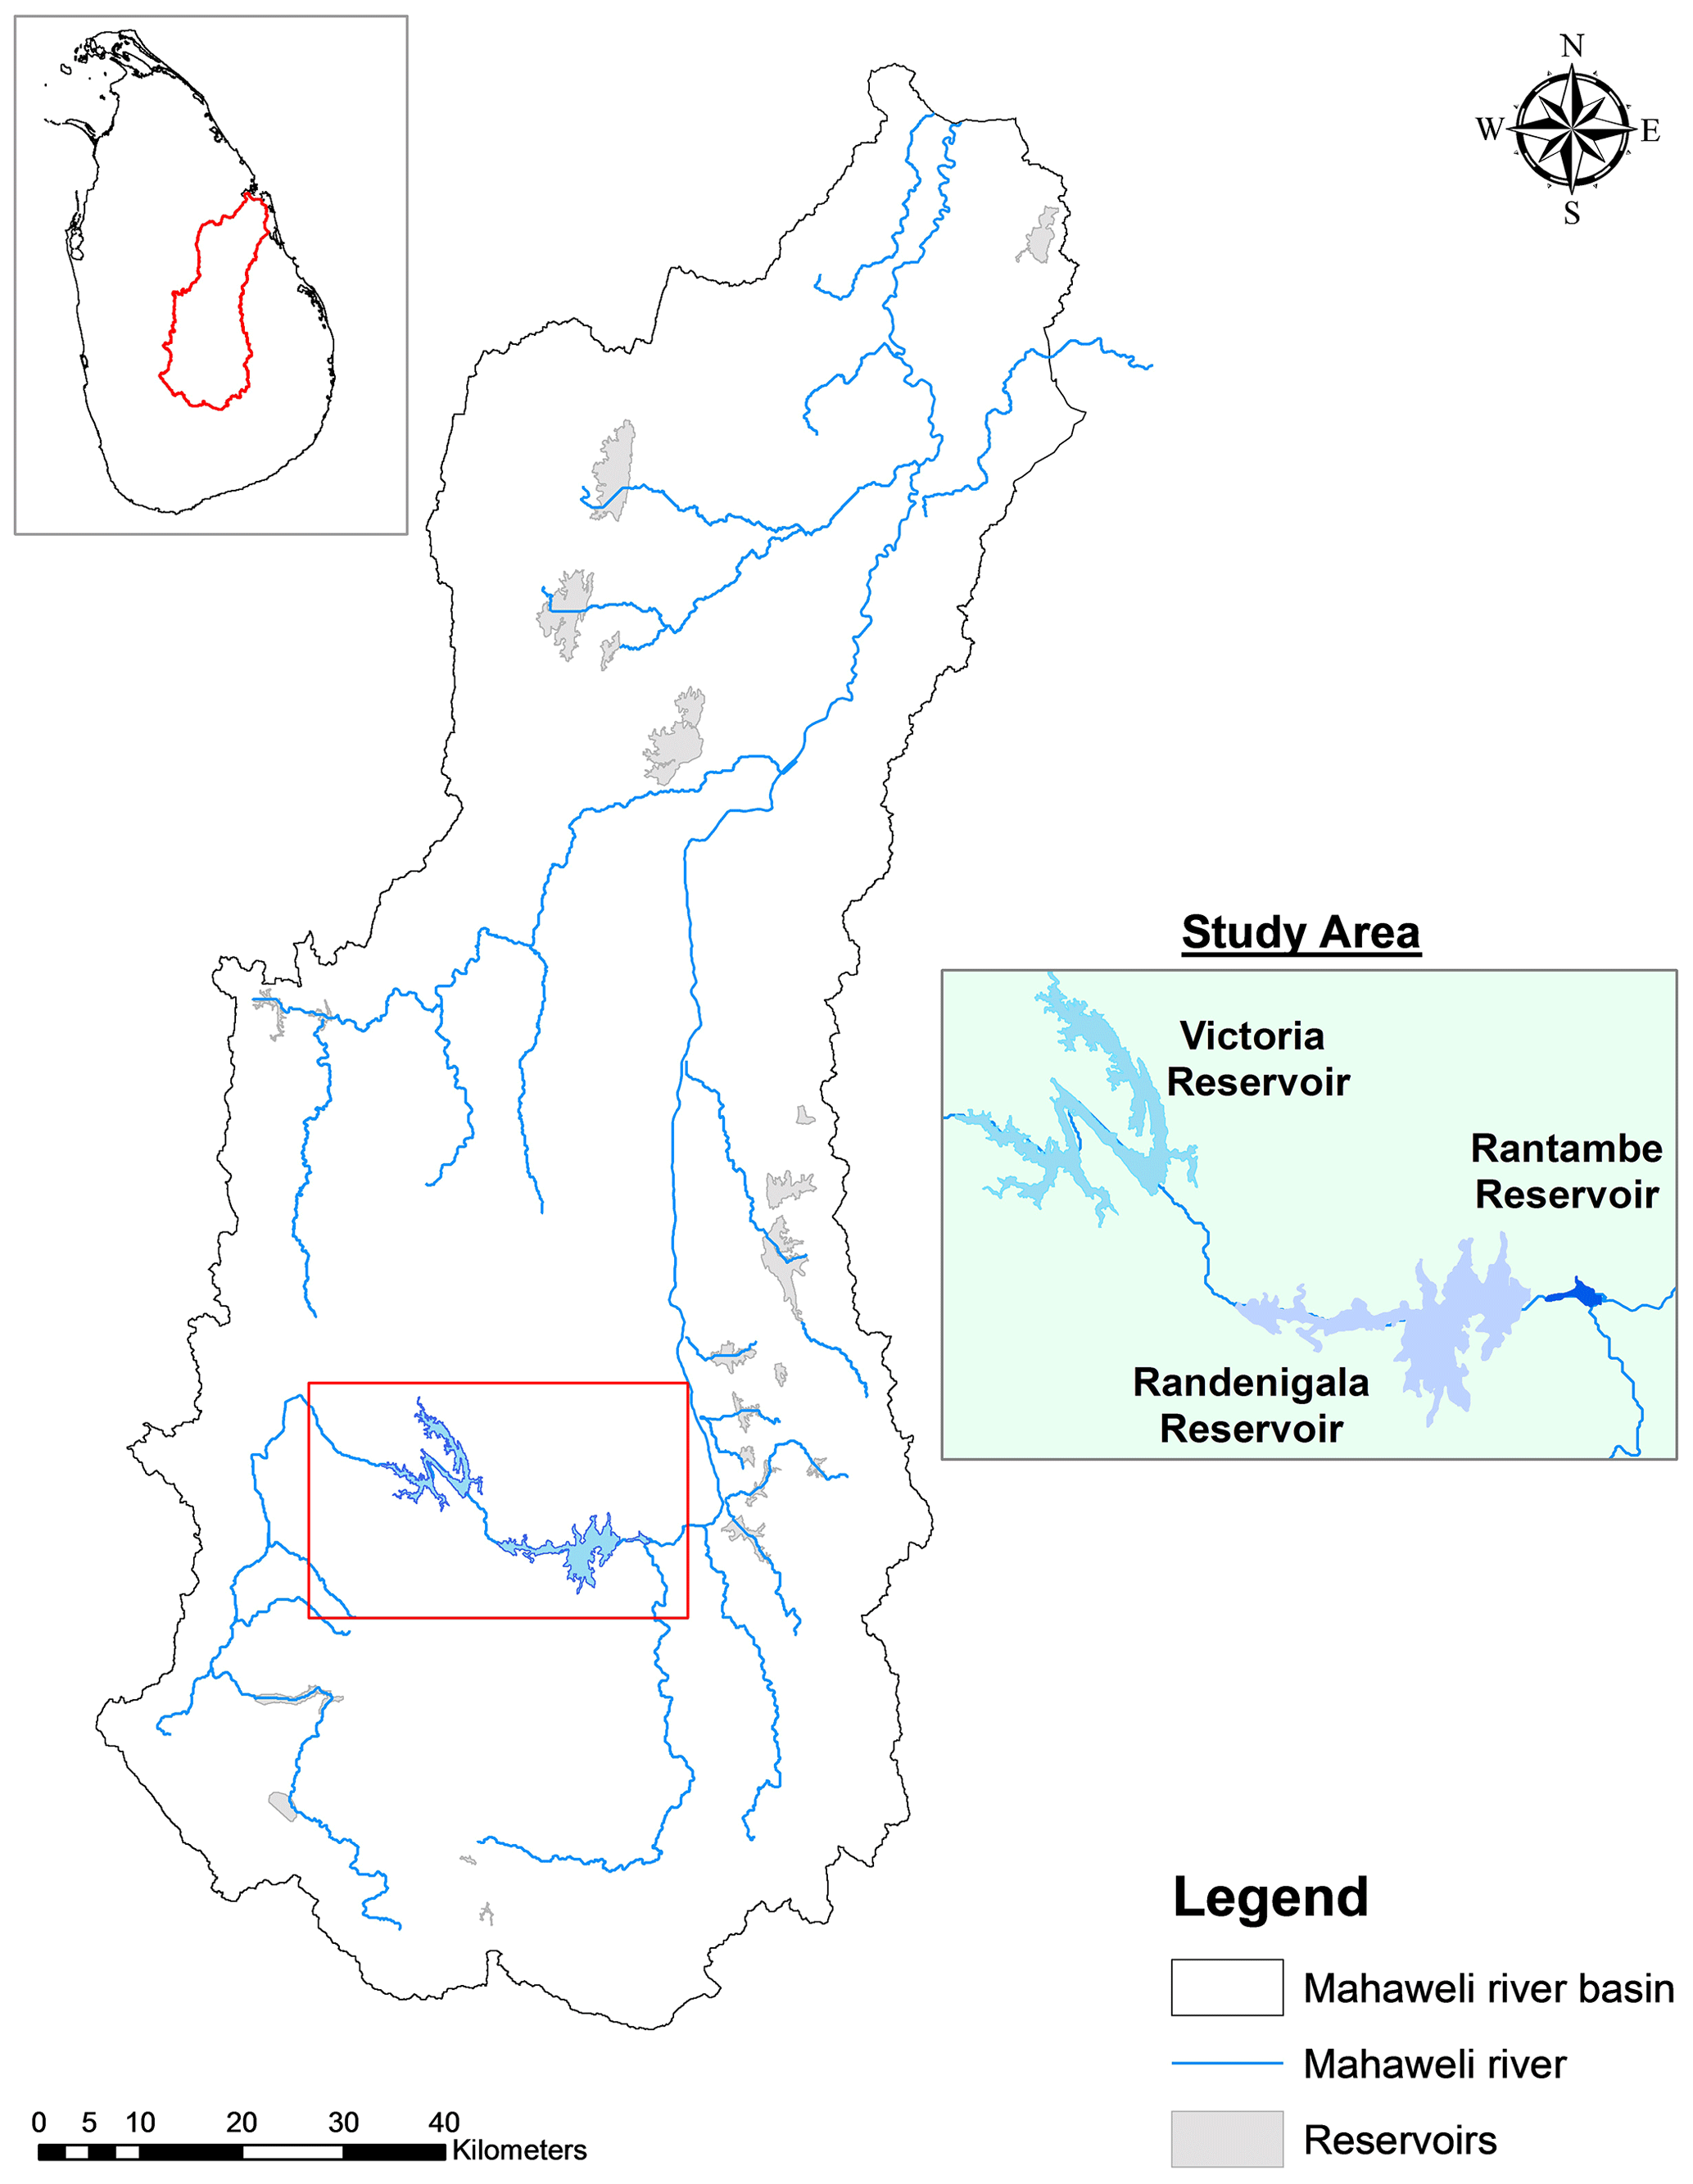
Figure 1Study area of the research.
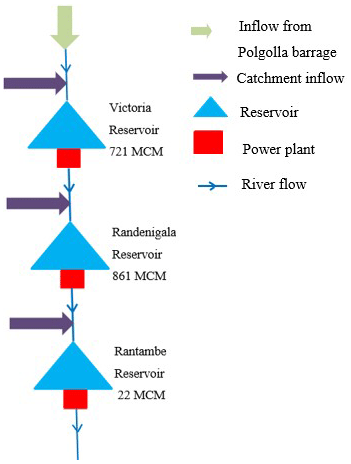
Victoria reservoir receives inflows from the Polgolla barrage and its own catchment. The outflow from Victoria reservoir flows into Randenigala reservoir which is situated immediately downstream. This reservoir acts as a regulating reservoir. Rantambe reservoir which is comparatively the smallest in this cascade receives reservoir releases from Randenigala and inflows from its own catchment. The schematic diagram of the study area is shown in Fig. 2.
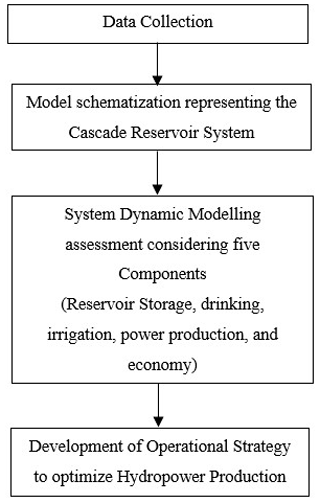
The three main reservoirs namely, Victoria, Randenigala and Rantambe which are in the upper reaches of Mahaweli river basin were selected as the study area for this research. A system dynamic model is developed for this reservoir cascade using VENSIM software PLE 9.3.1 platform to analyse the complex interrelationship between the storage and hydropower production of this cascade system. The main purpose of developing this type of model is to check the ability to optimize power generation from these reservoirs by optimizing the reservoir storage during rainfall events as a solution to the current energy and economic crisis. The methodology of this research is depicted in Fig. 3.
3.1 Development of System Dynamic (SD) Model
The SD-based Mahaweli cascade system model comprises five sectors, namely, reservoir storage, drinking, irrigation, power production, and environmental release. The reservoir storage sector of the Mahaweli cascade system is the main component of the model. The interrelationships among the five sectors were modelled considering feedback in a dynamic environment. The model was simulated from 2000 to 2020 period on daily basis.
3.2 Reservoir storage component of the model
The water balance assessment was carried out for three reservoirs to compute the reservoir storage. The water balance equation applied for each reservoir depicts in Eq. (1).
where ΔS is the change in reservoir storage and R, I, O, Sp and L are rainfall, inflow, outflow, spill flow and losses respectively.
The “Outflow” in the above equation represents the water release from the reservoir for hydropower, irrigation, drinking, and environmental water demands. The schematised Reservoir storage component of Victoria reservoir is illustrated in Fig. 4.
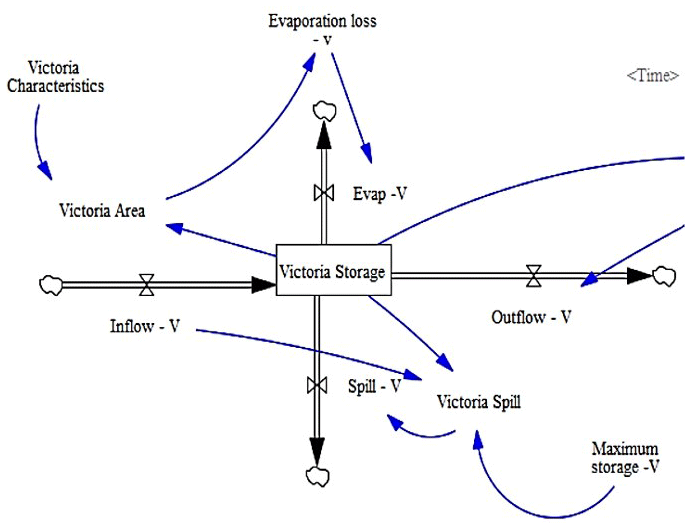
Figure 4Schematisation of the reservoir storage component in the VENSIM graphical interface.
3.3 Drinking water component model
In this component of the SD model, the emphasis is placed on the population that is served by each water supply intake. It considers both the per capita water consumption and the size of the served population.
3.4 Hydropower component model
This is one of the major components in this model as the reservoir cascade is mainly generating hydropower. The power flow, power production, and power pricing were considered in this component.
3.5 Irrigation component model
The irrigation water requirements on daily basis were considered in this component of the model. Paddy is the major crop grown in this basin during the Maha season which is the main agricultural season. Various types of cash crops along with paddy are grown during the Yala season, which is the second agricultural season. The agricultural water requirements for land preparation and crop growth were modelled corresponding to each cultivation period.
3.6 Environmental flow component model
The mandatory environmental releases for downstream reaches were modelled under this component.
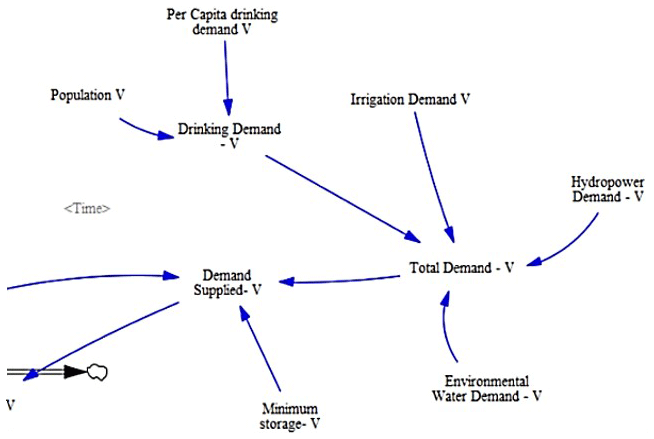
The schematic view of the demand components of the Victoria reservoir model is illustrated in Fig. 5.
Firstly, SD model was developed for the Victoria reservoir system. The aim of the research is to examine variation of the power generation of Victoria reservoir with respect to the operational scenarios of reservoir. In this study, the receipt of short-term rainfall forecast for 5 d in advance was used analyse the optimization of energy production with respect to the variations of Victoria reservoir capacity. The reservoir storage was optimized in such a way to cater for maximum power production while releasing water for other water requirements. Accordingly, the spill flow from the reservoir was minimized in this scenario. The optimized daily energy production was compared with the original daily energy production (in GWh) of the Victoria reservoir for the period from 2000 to 2020 and shown in Fig. 6.
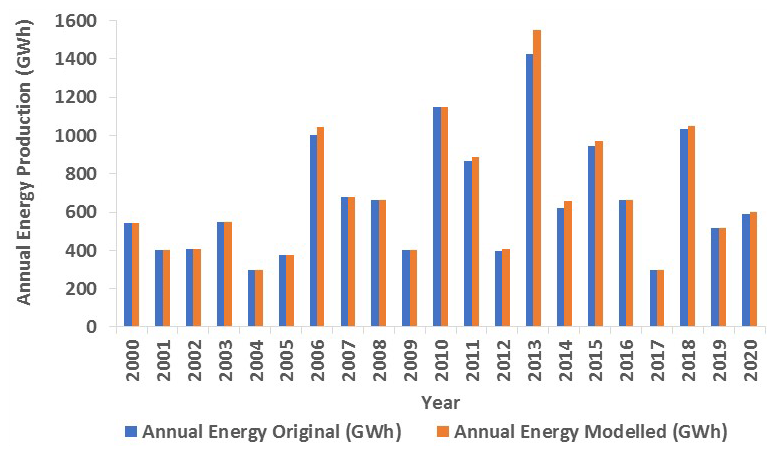
Figure 6Comparison of the annual energy production: original (blue) and modelled (orange) scenarios.
The highest annual energy production was observed in the year 2013, where it produced 1426 and 1553 GWh for the original and modelled scenario respectively. A decreasing trend in energy production is noted for the periods 2000–2009, 2010–2012 and 2013–2020.
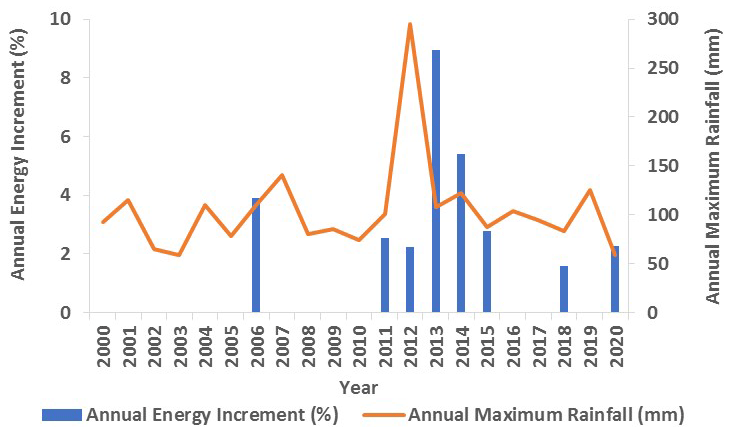
The difference in modelled and original annual energy production depicts the effect of the optimized reservoir storage on energy production in each specific year. This difference was presented as a percentage of annual energy increment which was evaluated with the annual maximum rainfall (mm) in Fig. 7. As annual maximum precipitation signifies extreme wet events, the variation of energy increment with the flood events is evaluated.
The increment in energy production was reflected in the years 2006, 2011–2015, 2018, and 2020. The annual maximum rainfall was higher than 100 mm in these specific years. The highest increment in energy production was observed in 2013. A decreasing trend was observed in energy increment from this year onwards as well as the maximum precipitation. On the other hand, the annual maximum rainfall is highest in 2012 whilst the energy production increment is fairly less. This maximum precipitation occurred in late December and that event couldn't progress for a few days in this particular year might be the reason for it.
As it is also mentioned previously, the Victoria reservoir was optimized in order to maximize power production by minimizing the spillage of the reservoir. The original and optimized spill volumes (in Million Cubic Meters (MCM)) were assessed with the annual rainfall (mm) in Fig. 8.
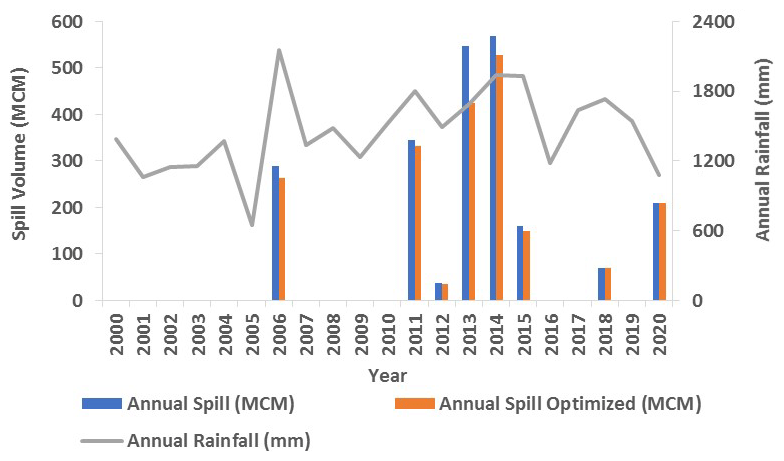
Figure 8Annual spill volume (MCM) for original and optimized scenarios and annual maximum rainfall (mm).
The spill volume was optimized for the years 2006, 2011–2015, 2018 and 2020. The annual rainfall was over 1500 mm for every year mentioned above except in 2020. The highest spill volume optimization can be seen in 2013 and the lowest in 2012. According to the model results, the spill volume can be utilised for power production up to 122 MCM depending on the intensity of the rainfall and the reservoir storage. The increment in hydropower production with this optimization causes additional production costs. Assuming this increment in hydropower production would have been done with thermal (coal and diesel) power, the increment in energy production costs for hydro, coal, and thermal power are calculated and illustrated in Fig. 9. The unit prices (in Sri Lankan Rupees (LKR)) for hydro and thermal (coal and diesel) power for producing 1 kWh electricity are considered as LKR 1.5, LKR 6.78, and LKR 38.88 respectively (Ceylon Electricity Board, 2022).
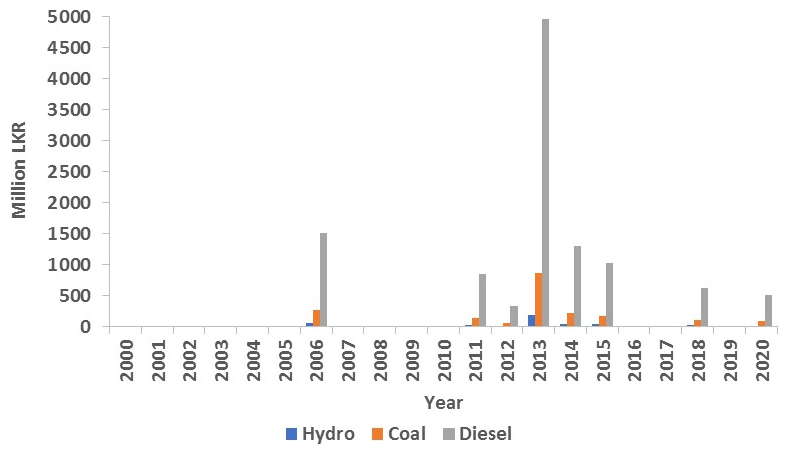
Figure 9Comparison of electricity production costs (million LKR) for energy increment using hydro, coal, and diesel.
The energy production is highest in the year 2013 and the cost is about LKR 192 million, LKR 866 million and LKR 4964 million for hydro, coal, and diesel energy sources respectively. Therefore, it is observed that if the reservoir operated in this pattern, the energy production costs will be reduced by a significant amount as the hydropower production cost is the least out of the other two sources.
The volume of the spill in Victoria reservoir was optimized for a 5 d short-term rainfall prediction in order to maximize the hydropower production without varying any other water requirements. Under the scenario developed for this research, the continuous agricultural water supply for both Maha and Yala seasons, uninterrupted supply of drinking water even during dry months and environmental water supply were considered as the first priority. The optimization of power production through the change of reservoir operations was introduced as the second priority focusing on reduction of spill flow, which will further reduce the existing downstream flood risk. The spill volume optimization is highest in the wet years. As spill volume is minimized, more water allocation can be provided for power production. The higher the minimization of the spillage, greater the hydropower is produced and lesser the downstream flood inundation. On the other hand, harnessing hydropower for electricity production is the cheapest among coal and diesel as coal and diesel power production are 5 and 26 times more costly than hydropower. Higher the increment of energy production by spill optimization, the greater the difference in production costs among the energy sources.
The Victoria reservoir storage was optimised by minimizing its spillage to obtain maximum power production by keeping the other water requirements constant. Although power production will add production charges, hydropower is the cheapest energy source compared with coal and diesel. It is observed that maximizing hydropower production makes direct economic benefits and is a sustainable solution for the energy crisis provoked by the economic loss that occurred during the COVID-19 pandemic. The same approach can be followed for the entire cascade system considering Rantambe and Randenigala reservoirs as well. Further, it is expected to develop a few scenarios to evaluate the energy production of this cascade by optimizing irrigation water usage by introducing irrigation modernization techniques to reduce water consumption.
The data supporting the findings of this study are available from the corresponding author on request.
RDTK, SPH, SH and SCS designed the methodological and conceptual frameworks of the study. SH and SCS provided hydro-meteorological data. RDTK performed the simulations, and SPH analysed the results. RDTK and SPH prepared the manuscript.
The contact author has declared that none of the authors has any competing interests.
Publisher’s note: Copernicus Publications remains neutral with regard to jurisdictional claims made in the text, published maps, institutional affiliations, or any other geographical representation in this paper. While Copernicus Publications makes every effort to include appropriate place names, the final responsibility lies with the authors.
This article is part of the special issue “ICFM9 – River Basin Disaster Resilience and Sustainability by All”. It is a result of The 9th International Conference on Flood Management, Tsukuba, Japan, 18–22 February 2023.
This paper was edited by Mamoru Miyamoto and reviewed by two anonymous referees.
Ceylon Electricity Board: Electricity Generated, https://ceb.lk/electricity-generated/en (last access: 24 October 2022), 2022.
Department of Meteorology: Climate of Sri Lanka, http://www.meteo.gov.lk/ (last access: 24 October 2022), 2016.
Health Promotion Bureau: COVID-19: Live Situational Analysis Dashboard of Sri Lanka, https://hpb.health.gov.lk/covid19-dashboard/ (last access: 24 October 2022), 2022.
Survey Department: National Atlas, Colombo: Survey Department, Sri Lanka, ISBN 9559059041, 2012.