the Creative Commons Attribution 4.0 License.
the Creative Commons Attribution 4.0 License.
 | 19 Apr 2024
Estimating the rate of change in heavy rainfall intensity for flood control planning in Japan
Yuta Maeda
Tetsuya Takeshita
Masaki Kawasaki
Heavy rainfall leading to disasters is projected to intensify and become more frequent as the average global temperature continues to rise. To manage flood risk, flood control plans that account for future climate change are urgently needed in Japan. We have estimated the ratio of the intensity of heavy rainfall in the future to that in the past (hereinafter referred to as “rainfall change rate”), using large-ensemble climate model predictions. The results show that the average rainfall change rate across Japan is 1.1, with an increase in temperature of 2 °C. This phenomenon is higher in Hokkaido, the northernmost island in Japan. This seems to be due to the large increase in sea surface temperature around Hokkaido as well as the high rate of increase in vapour pressure in lower-temperature areas, based on the Tetens equation. The Japanese government has set the target rainfall change rate for the flood control planning to 1.15 in Hokkaido and 1.1 for Japan excluding Hokkaido.
- Article
(1147 KB) - Full-text XML
- BibTeX
- EndNote


Heavy rainfalls leading to disasters are projected to intensify and become more frequent as the average global temperature continues to rise. To manage flood risk, flood control plans that account for future climate change are urgently needed in Japan. In recent years, an ensemble climate-prediction database has been developed, in which perturbations are applied to the boundary conditions of climate models in order to perform a large number of calculations. Utilizing this database, it is possible to evaluate probabilistically extreme events such as heavy rains in the future.
For this reason, the National Institute for Land and Infrastructure Management (NILIM) is conducting research on future changes in rainfall by analysing large-ensemble climate model predictions from the perspective of developing flood control planning methods that take climate change into account.
As part of that research, NILIM calculated the rainfall change rate, which plays an important role in flood control planning based on climate change, clarified the distribution trend of values by regional divisions, and provided the technical data to the advisory committee of the Ministry of Land, Infrastructure, Transport and Tourism (MLIT) (hereinafter referred to as “the committee”). The results were analysed in terms of the relationship between temperature and saturated water vapour pressure, sea surface temperature, and other factors, and the technical data were provided to the committee. Then, based on these and other data, the committee set the target rainfall change rates to be used in flood control planning based on climate change (MLIT, 2021).
This paper describes the method for calculating the technical data prepared by NILIM that were provided to the committee, from the perspective of the provider.
2.1 Characteristics of rainfall change rate
Climate change is projected assuming different levels of impacts depending on socio-economic development and radiative forcing scenarios. Therefore, in developing flood control plans based on climate change, it is not possible to rely solely on historical data; instead, climate-change predictions based on models that take various scenarios into account must also be considered.
However, the predictions of such models are known to contain some biases. In utilizing climate-change prediction models for flood control planning, there are several possible ways to address these biases.
One method is to directly evaluate the forecast outputs from climate-change prediction models with bias correction. Another method is to extract climate-change impacts as indices from the forecast results and apply them as changes to existing planning methods.
The rainfall change rate addressed in this paper belongs to the latter method. One drawback of this approach is that it cannot fully utilize changes such as spatiotemporal rainfall patterns, but it is advantageous in that it provides a stable indicator by capturing the global change trend due to climate change, and the factors of change can be easily explained.
2.2 Calculation of rainfall change rate
2.2.1 Large-ensemble climate model predictions
Large-ensemble climate model predictions, which are known as the database for policy decision-making for future climate changes (d4PDF, 2015), are computed at a horizontal resolution of 20 km under the representative concentration pathways (RCP) 8.5 scenario, which is a high-emissions scenario that assumes no policy mitigation measures.
In this paper, we used two different outputs derived from d4PDF, which were further dynamically downscaled to a horizontal resolution of about 5 km, using the Nonhydrostatic Regional Climate Model of the Meteorological Research Institute.
One, the dataset (Yamada, 2021) we refer to as d4PDF (5 km, Yamada), is the downscaled output for Hokkaido as the target area in the Social Implementation Program on Climate Change Adaptation Technology (SI-CAT) of the Ministry of Education, Culture, Sports, Science and Technology (MEXT), using the Earth Simulator of the Japan Agency for Marine-Earth Science and Technology (JAMSTEC) (Yamada et al., 2018; Hoshino et al., 2020). The other, the dataset (Sasai, 2019) we refer to as d4PDF (5 km, SI-CAT), is the downscaled output for Japan excluding Hokkaido in SI-CAT, also using the Earth Simulator (Sasai et al., 2019).
2.2.2 Calculation process
The following is the process for calculating the rainfall change rate.
-
Japan was divided into 15 areas, considering the possibility that the rainfall change rate may differ from region to region.
-
Among the ensemble climate-prediction data, the relationships among accumulated rainfall, rainfall area, and rainfall duration were organized for each year for the data of past experiments (corresponding to climate change from 1981 to 2010) and those of future experiments (corresponding to a point in time when the global average temperature rises 2 and 4 °C above the pre-industrialization level in the mid-18th century). The number of years of data is 360 years of past experiments (30 years × 12 perturbations) and 360 years of future experiments (30 years × 6 sea surface temperature [SST] patterns ×2 perturbations).
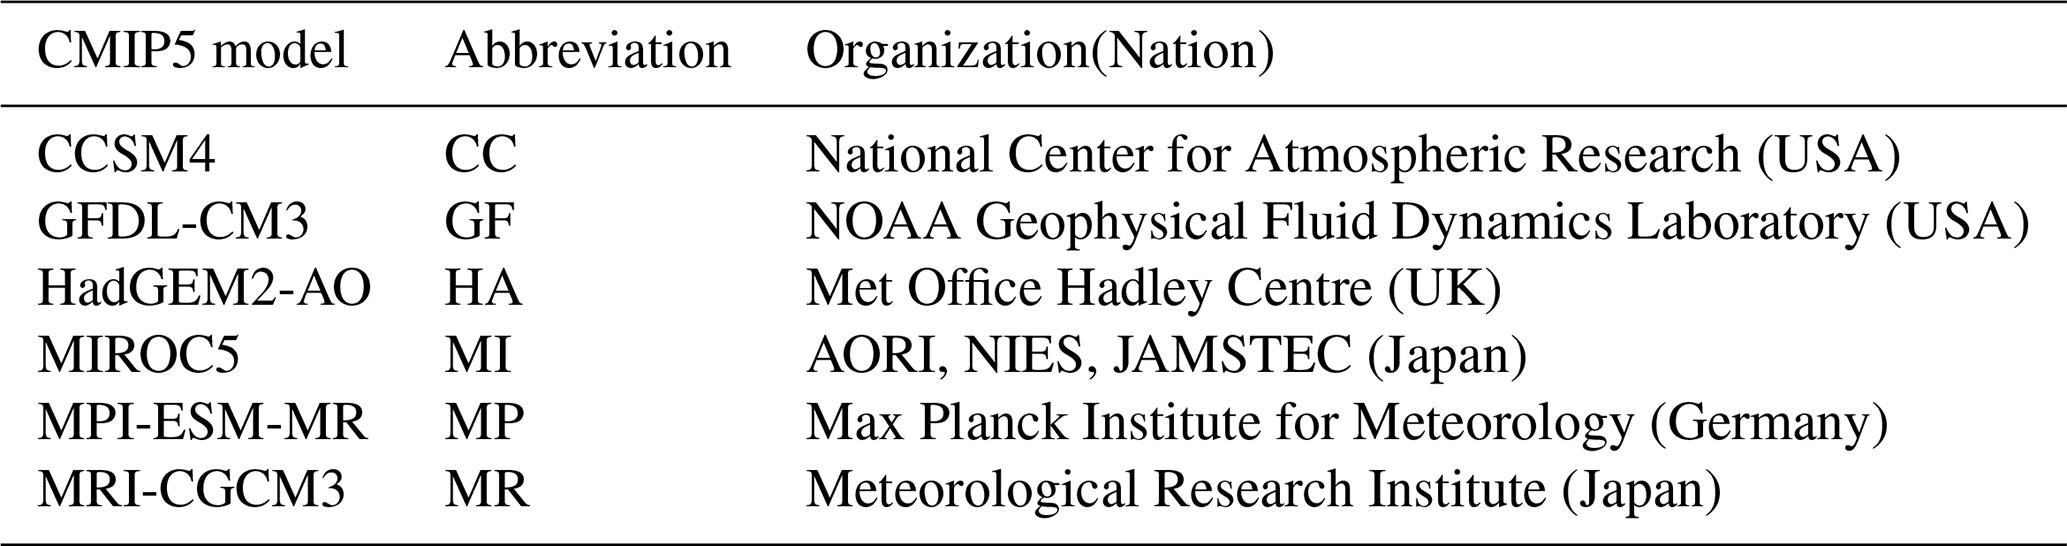
Here, 6 SST patterns refers to the six SST patterns (denoted CC, GF, HA, MI, MP, and MR) selected to avoid similarity among them, based on a cluster analysis of 28 models among the coupled atmosphere–ocean models submitted to the Fifth Coupled Model Intercomparison Project (CMIP5) of the Global Climate Research Program.
-
We conducted a statistical analysis of the maximum annual accumulated rainfall corresponding to the rainfall area and duration obtained in (2) above and calculated the ratio between the future and past experiments for rainfall with a 1/100 annual exceedance probability. The free software R was used to compute the statistical parameters. In organizing the data above, the average values were calculated for a total of nine patterns, including three rainfall area patterns (400, 1600, 3600 km2) and three rainfall duration patterns (12, 24, 48 h), assuming a large river basin. In addition, we studied the case of a small rainfall area (less than 400 km2) and the case of a short rainfall duration (less than 12 h), assuming a small river basin.
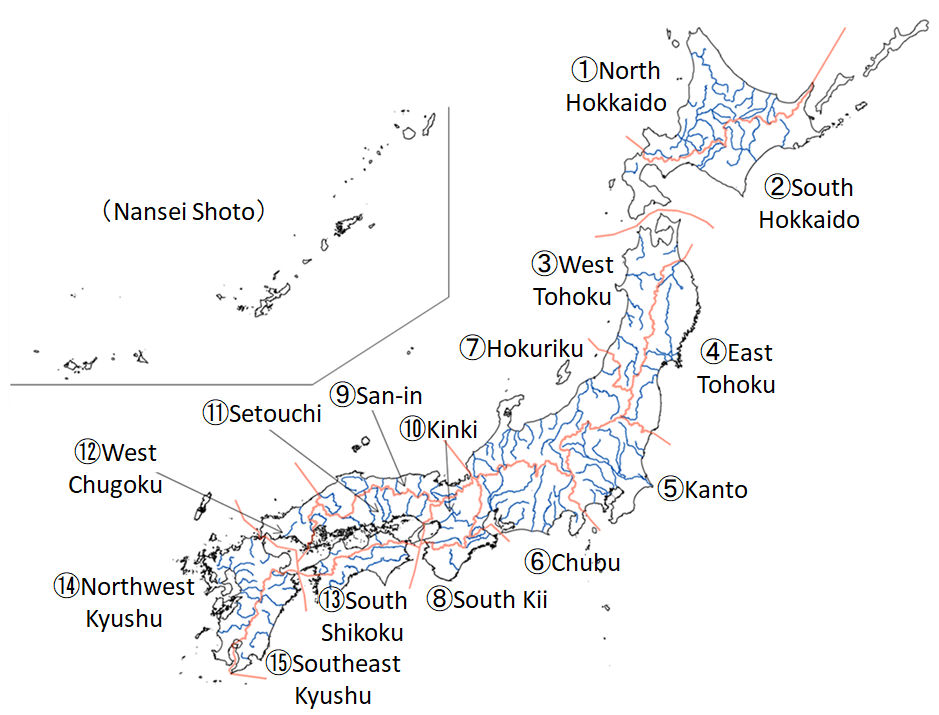
Figure 1Regional division.
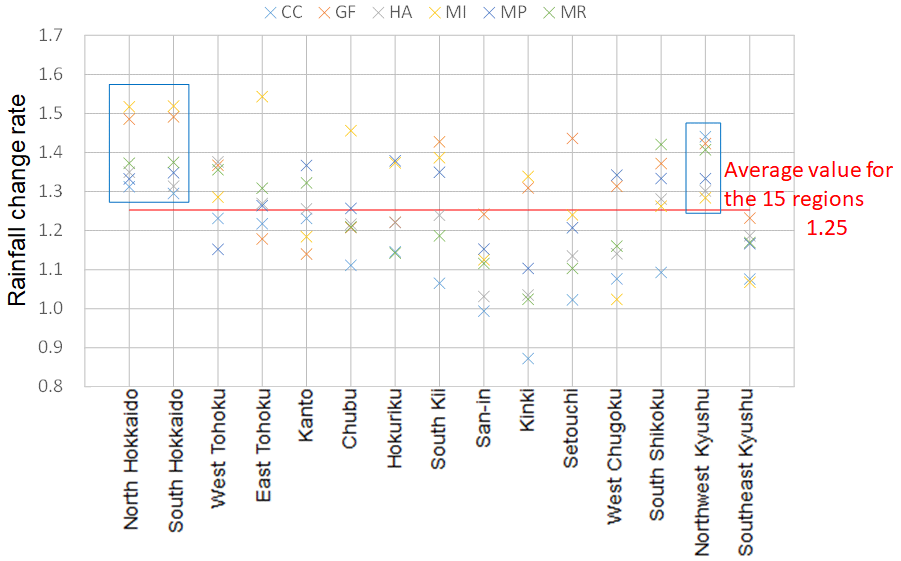
3.1 Rainfall change rate for large river basin
The results averaged for 9 different rates – for rainfall durations of 12, 24, and 48 h and rainfall areas of 400, 1600, and 3600 km2 – are shown in Figs. 2 and 3. At a 4 °C increase in the global average temperature, the arithmetic mean for all regional divisions is about 1.25×, but the results for north and south Hokkaido and Northwest Kyushu exceed the national average in each of the 6 SST cases.
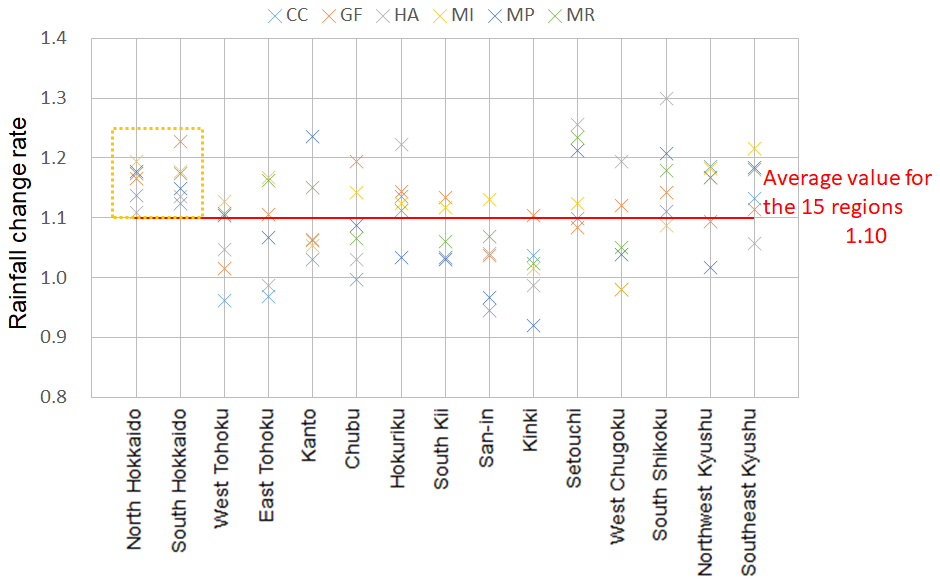
At a 2 °C increase in the average global temperature, the arithmetic mean for all regional divisions is about 1.10×, but the results for north and south Hokkaido exceed the national average in each of the 6 SST cases.
3.1.1 Discussion of sea surface temperature
The high value of the rainfall change rate for Hokkaido at both a 4 and 2 °C increase in the average global temperature is discussed from the perspective of SST.
The SSTs in the d4PDF future projections are calculated by adding the future SST change pattern based on the 6 main SST models of the CMIP5 to the observed SSTs minus the trend component. Figure 4 show the temperature increase for each SST model in d4PDF (20 km) for summer (June–August) when the average global temperature increases by 4 and 2 °C, respectively.
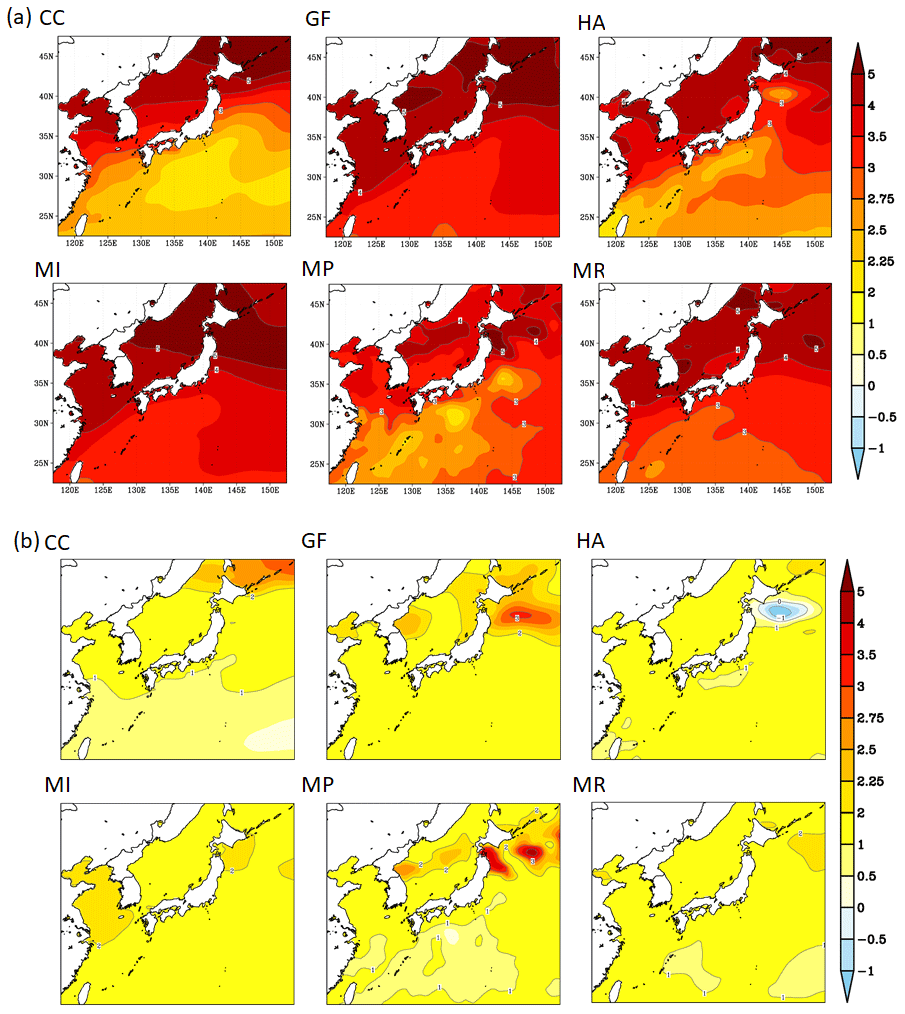
Figure 4Temperature increases for each SST pattern ((a) 4 °C increase (b) 2 °C increase) (Modified by the author based on the data provided by Meteorological Research Institute).
Table 2Saturated water vapour content at rising temperature calculated by Tetens equation (MLIT, 2021).

At a 4 °C increase in the average global temperature (Fig. 4a), the amount of SST increase is larger around Hokkaido in all models. In contrast, in areas along the Pacific Ocean on Japan's other three main islands, the difference in the amount of SST increase is larger, depending on the model.
At a 2 °C increase in the average global temperature (Fig. 4b), the amount of SST increase around Hokkaido is particularly large in the CC, GF, and MP models, and there are also areas of large SST increases in southeastern Hokkaido in the MI model and in eastern Hokkaido in the MR model.

Figure 5Relationship between rainfall duration (hour) (horizontal axis) and the rainfall change rate (vertical axis) (a) 4 °C increase (b) 2 °C increase.
It is possible that the large increase in SST around Hokkaido may have influenced the high value of the rainfall change rate for Hokkaido.
Similarly, the high value of the rainfall change rate for northwest Kyushu only in the 4 °C-increase condition may be due to difference in the amount of SST increase between the 4 and 2 °C conditions. However, a more precise analysis of the details, including changes in precipitation mechanisms associated with changes in SST, is required.
3.1.2 Discussion of the relationship between temperature and saturated water vapour pressure
As shown in the results in Sect. 3.1, the rainfall change rate for north and south Hokkaido exceed the national average.
Utsumi et al. (2011) reported that the relationship between extreme 1-h precipitation intensity and surface temperature shows a positive relationship up to a certain temperature in the Japan region. They also reported that in winter, the rate of increase in precipitation intensity with increasing temperature in the area comprising Honshu and Hokkaido was distributed around a value close to the saturated water vapour rate of change (7 % °C−1) expected from the Clausius–Clapeyron relationship.
Therefore, the high value of the rainfall change rate in Hokkaido is discussed in terms of the rate of change of saturated water vapour pressure/volume with temperature increase expected from the Clausius–Clapeyron relationship, and in terms of the amount of temperature increase.
Equation (1) is Tetens Equation (Tetens, 1930), which shows the relationship between air temperature and saturated water vapour pressure, which is used as a practical experimental formula for the Clausius–Clapeyron relationship.
(E: saturated water vapour pressure (hPa), T: air temperature (°C))
In Tetens equation, the present air temperature and saturated water vapour pressure are respectively T1 (°C) and E1 (hPa), and the future air temperature and saturated water vapour pressure are (°C) and E2 (hPa). The rate of change in saturated water vapour pressure (E2/E1) is transformed as follows.
Therefore, if the temperature rise K (°C) is constant, the lower the current temperature T1 (°C), the larger the rate of change in saturated water vapour pressure.
Next, Table 2 shows that higher-latitude regions in Japan are generally projected to experience larger increases in annual mean temperature, with future changes in annual mean temperature at RCP 8.5 being 5.0 °C in Sapporo, 4.4 °C in Tokyo, 4.2 °C in Fukuoka, and 3.5 °C in Okinawa. In addition to lower present temperatures in high-latitude regions, higher temperature increases due to climate change may result in higher rates of increase in saturated water vapour in Hokkaido compared with other regions (Sapporo: +33 %, Tokyo to Okinawa: +28 % to +21 % at RCP 8.5) as well as a high rainfall change rate.
3.2 Rainfall change rate for small river basin
3.2.1 Rainfall change over a short period and small area due to climate change
In the committee materials (MLIT, 2019), offered by Yamada in 2019, the effect of climate change on rainfall was suggested to be stronger when the time of rainfall events is shorter and the area covered is smaller. It was also suggested that the trend of spatiotemporal concentration of rainfall would be more pronounced at a 4 °C increase in the average global temperature compared with a 2 °C increase.
Therefore, in Sect. 3.2.2, we evaluate the trend of change in rainfall change rate for a range of short rainfall durations (12 h or less) and small rainfall areas (400 km2 or less), assuming small river basins.
3.2.2 Rainfall change rate in short time and small area
In this section, we focus on rainfall duration and calculate the rainfall change rate for each rainfall duration for a rainfall area of 400 km2 and an annual exceedance probability of 1/100 for a 4 and 2 °C increase in the average global temperature (Fig. 5).
At a 4 °C increase, for rainfall durations of less than 12 h, the increasing trend of the rainfall change rate becomes more pronounced, especially in north and south Hokkaido and in western Tohoku. Among the data for short rainfall durations, the 3- and 6 h rainfall data in particular show an increasing trend compared with the 12–48 h rainfall change rate for all regional divisions. The rainfall change rate for rainfall duration of 3–6 h to that of 12–48 h averaged over all 15 regional divisions was 1.05×.
However, at a 4 °C increase, for rainfall durations of 1 and 2 h, the results were divided into an increasing trend and a decreasing trend, depending on the regional division, compared with the rainfall change rate for 12–48 h.
At a 2 °C increase, the results showed that the magnitude of change for a short duration rainfall (3–6 h) was not as pronounced as that for a 4 °C increase. No significant increase or decrease in the rate of change was observed for rainfall for 1–2 h.
We also confirmed the rainfall change rate calculated by d4PDF for rainfall areas of 400 km2 or less, under conditions of 3, 6, and 12 h of rainfall duration for a 4 °C increase and a 2 °C increase. In both models, there was no significant increase or decrease in the rainfall change rate due to differences in rainfall area. Therefore, the rainfall change rate calculated for rainfall areas of 400 km2 or more are considered to be similar for smaller areas. However, it should be noted that this is not a sufficient evaluation, especially for rainfall areas of less than 100 km2, due to the d4PDF (5 km) resolution (25 km2 per mesh).
We have described the concepts and calculation methods for rainfall change rate submitted by NILIM to the Japanese government's advisory committee. The committee set the target rainfall change rate for flood control planning to 1.15 in Hokkaido and 1.1 for Japan excluding Hokkaido, assuming a 2 °C increase in the global average temperature.
Since the committee's recommendation (revised in April 2021) was issued, five fundamental river management policies overseen by the government have been revised to use the rainfall change rate described in this paper.
The rainfall change rate is considered a valid approach for addressing the issue of flood control planning under climate change by taking into account conventional flood control planning methods and recent developments in climate change forecasting technology.
However, the rainfall change rate is an indicator that focuses on rainfall and does not fully utilize the output of climate-change prediction models, including the spatiotemporal distribution of rainfall. In flood control planning and river management under climate change, it is therefore necessary to continue examining the issue from various perspectives in conjunction with the future development of climate change forecasting technology.
The software R is freely available (https://cran.r-project.org/). The code for computing the statistical parameters is available from the corresponding author on request.
The dataset we refer to as d4PDF (5 km, SI-CAT) is available at https://doi.org/10.20783/DIAS.562 (Sasai, 2019). The dataset we refer to as d4PDF (5 km, Yamada) is available at https://doi.org/10.20783/DIAS.647 (Yamada, 2021).
YM did the Data curation, Formal analysis, Investigation, Visualization, Writing – original draft preparation. The co-authors contributed as follows: TT participated in Project administration, Supervision, Writing – review and editing; MK participated in Conceptualization, Methodology, Project administration, Supervision, writing – review and editing.
The contact author has declared that none of the authors has any competing interests.
Publisher’s note: Copernicus Publications remains neutral with regard to jurisdictional claims made in the text, published maps, institutional affiliations, or any other geographical representation in this paper. While Copernicus Publications makes every effort to include appropriate place names, the final responsibility lies with the authors.
This article is part of the special issue “ICFM9 – River Basin Disaster Resilience and Sustainability by All”. It is a result of The 9th International Conference on Flood Management, Tsukuba, Japan, 18–22 February 2023.
This paper utilized dynamical downscaling data, which are produced from d4PDF using the Earth Simulator, from the Social Implementation Program on Climate Change Adaptation Technology (SI-CAT), which is sponsored by the Ministry of Education, Culture, Sports, Science and Technology (MEXT).
This paper was edited by Mamoru Miyamoto and reviewed by two anonymous referees.
CRAN: The Comprehensive R Archive Network, https://cran.r-project.org/ (last access: 6 March 2024), 2024.
d4PDF: Database for Policy Decision-Making for Future Climate Change, https://www.miroc-gcm.jp/d4PDF/index_en.html (last access: 14 October 2022), 2015.
Hoshino, T., Yamada, T. J., and Kawase, H.: Evaluation for Characteristics of Tropical Cyclone Induced Heavy Rainfall over the Sub-basins in The Central Hokkaido, Northern Japan by 5-km Large Ensemble Experiments, Atmosphere-Basel., 11, 1–11, https://doi.org/10.3390/atmos11050435, 2020.
MLIT (Ministry of Land, Infrastructure, Transport and Tourism): The expert meeting on flood control planning to cope with climate change: Flood control planning considering climate change (Appendix), 78, https://www.mlit.go.jp/river/shinngikai_blog/chisui_kentoukai/pdf/06_sankousiryou.pdf (last access: 14 October 2022), 2019.
MLIT (Ministry of Land, Infrastructure, Transport and Tourism), The expert meeting on flood control planning to cope with climate change: Flood control planning considering climate change (Recommendations), https://www.mlit.go.jp/river/shinngikai_blog/chisui_kentoukai/index.html (last access: 14 October 2022), 2021.
Sasai, T.: Dynamical downscaling data for near future atmospheric projection (from Tohoku to Kyushu) by SI-CAT, Data Integration and Analysis System (DIAS) [data set], https://doi.org/10.20783/DIAS.562, 2019.
Sasai, T., Kawase, H., Kanno, Y., Yamaguchi, J., Sugimoto, S., Yamazaki, T., Sasaki, H., Fujita, M., and Iwasaki, T.: Future projection of extreme heavy snowfall events with a 5-km large ensemble regional climate simulation, J. Geophys. Res-Atmos., 124, 13975–13990, 2019.
Tetens, O.: Uber einige meteorologische Begriffe, Z. Geophys., 6, 297–309, 1930.
Utsumi, N., Seto, S., Kanae, S., and Oki, T.: Relations of hourly precipitation extremes and temperature over Japan based on ground observational records, J. Jap. Soc. Civil Eng. B1, 67, I_307-I_312, 2011.
Yamada, T. J.: 5-km resolution ensemble climate data around Hokkaido (heavy rainfall event), Data Integration and Analysis System (DIAS) [data set], https://doi.org/10.20783/DIAS.647, 2021.
Yamada, T. J., Hoshino, T., Masuya, S., Uemura, F., Yoshida, T., Omura, N., Yamamoto, T., Chiba, M., Tomura, S., Tokioka, S., Sasaki, H., Hamada, Y., and Nakatsugawa, M.: The Influence of Climate Change on Flood Risk in Hokkaido, Adv. River Eng., 24, 391–396, 2018.