the Creative Commons Attribution 4.0 License.
the Creative Commons Attribution 4.0 License.
 | 19 Apr 2024
Sediment transport processes in the Sangu River basin using a rainfall-sediment runoff model for sustainable river management
Md. Majadur Rahman
Daisuke Harada
Shinji Egashira
The Sangu River, whose basin area is about 3600 km2, conveys a huge volume of sediment laden water during the monsoon, which decreases the river's capacity, causing flooding, channel change, and navigability problems. In this study, a basin-scale rainfall-sediment runoff (RSR) model was used to analyse the sediment transport in the Sangu River. Simulations were conducted for the year 2011, and the results were validated in terms of suspended sediment concentration. The simulation results show deposition trends particularly in the lower and middle reaches, and that nearly 7.5 × 10⁵ m3 of sediment annually discharges to the Bay of Bengal. The simulation results also show the tributaries actively produce sediment, which results in sediment deposition in downstream channels. The analyses also find that the implementation of check dams in the upstream area significantly reduces sediment deposition in the downstream area. These findings offer valuable insights for the development of sustainable sediment management strategies.
- Article
(4294 KB) - Full-text XML
- BibTeX
- EndNote


The Sangu River is one of the five river systems in the southeastern hilly area of Bangladesh, which primarily consists of hilly terrain and a long strip of low-lying coastal plains along the Bay of Bengal. This morphological feature makes the river vulnerable to disasters. The continued practice of deforestation and topsoil cutting in the upstream hilly region are driven by the need to fulfil various human requirements such as food production, human settlements, transportation infrastructure, brick manufacturing, and agricultural land preparation. During the monsoon season, floods due to heavy rainfall carry sediment from the upstream hilly area to the downstream low-lying area. As a result, the downstream part of the Sangu River faces siltation, which reduces river conveyance, increases flooding during the monsoon season, and decreases water availability during the dry season, resulting in navigability problems and scarcity of water uses that have adverse impacts on the natural environment (BWDB, 2021). Thus, basin-scale assessment tools can be useful to estimate erosion and sediment yield for proper planning and management of the river basin (Owens, 2005; Battarai and Dutta, 2007).
In order to address various issues and promote sustainable management, this study investigates sediment transport processes in the Sangu River. Initially, a rainfall-sediment runoff (RSR) model was developed for the purpose of evaluating sediment transport processes. Subsequently, the RSR model was revised and updated to include structural countermeasures for sediment management within the river basin. Several suitable sites were identified for the installation of check dams with the aim of promoting sustainable management of the river.
The RSR model is an extension of the rainfall-runoff-inundation (RRI) model coupled with a sediment-runoff model based on unit channel concept (Rahman et al., 2022).
The sediment continuity equation in unit channel is:
where z is the river bed elevation, λ is the porosity of bed materials, Bj and Ljare the width and length of unit channel j, Qbi(xj) and Qbi(yj) are the incoming bed load transport rates to unit channel j for sediment class i, Qbi(xj+1) is the outflow bed load transport rate from unit channel j for sediment size class i, Eiand Di are the erosion and deposition rates of the suspended sediment for sediment class i.
Egashira et al. (1997) proposed the following formula for the bed load transport rate:
where qb∗i is the non-dimensional bed load transport rate, pi is the fraction of particle size i, τ∗i is the non-dimensional shear stress, and K1, K2, fd, and ff are the parameters specified in Egashira et al. (1997).
The convection equation for suspended sediment transport in each unit channel is described as:
where ci is the suspended sediment concentration for sediment class i, csi(xj) and csi(yj) are the incoming and csi(xj+1) is the outgoing sediment concentrations from unit channel j for sediment class i. Q(xj) and Q(yj) are the incoming flow discharges to unit channel j, and Q(xj+1) is the outgoing flow discharge from unit channel j.
The erosion rate for suspended sediment can be evaluated using the Harada et al. (2022) formula:
where cs is the sediment concentration of the bed load layer, and We is the entrainment velocity, which can be evaluated by the density stratified flow formula proposed by Egashira and Ashida (1980).
The deposition rate is calculated using following equation:
where woi is the fall velocity of sediment particle size class i
The Sangu River originates from the Arakan Hills and flows north to the Bay of Bengal (Fig. 1). The total basin area is 3600 km2, of which about 80 % is in hilly terrain and about 20 % is along coastal plain land. The Sangu River is a meandering river with an average longitudinal slope of from the river mouth to Thanchi, after which the bed slope becomes steep with . The basin mostly consists of brown hilly soil and is mostly covered by clay loam. The river bed material is predominantly sandy in the downstream part, gravels in the upstream part, and boulders in the most upstream part. The climate is tropical, with stormy monsoon seasons in the summer and dry winters. The flow in the Sangu River is only from rainfall runoff within the basin, keeping the basin's small watercourses (charas) and waterfalls alive during the dry season (BWDB, 2021).
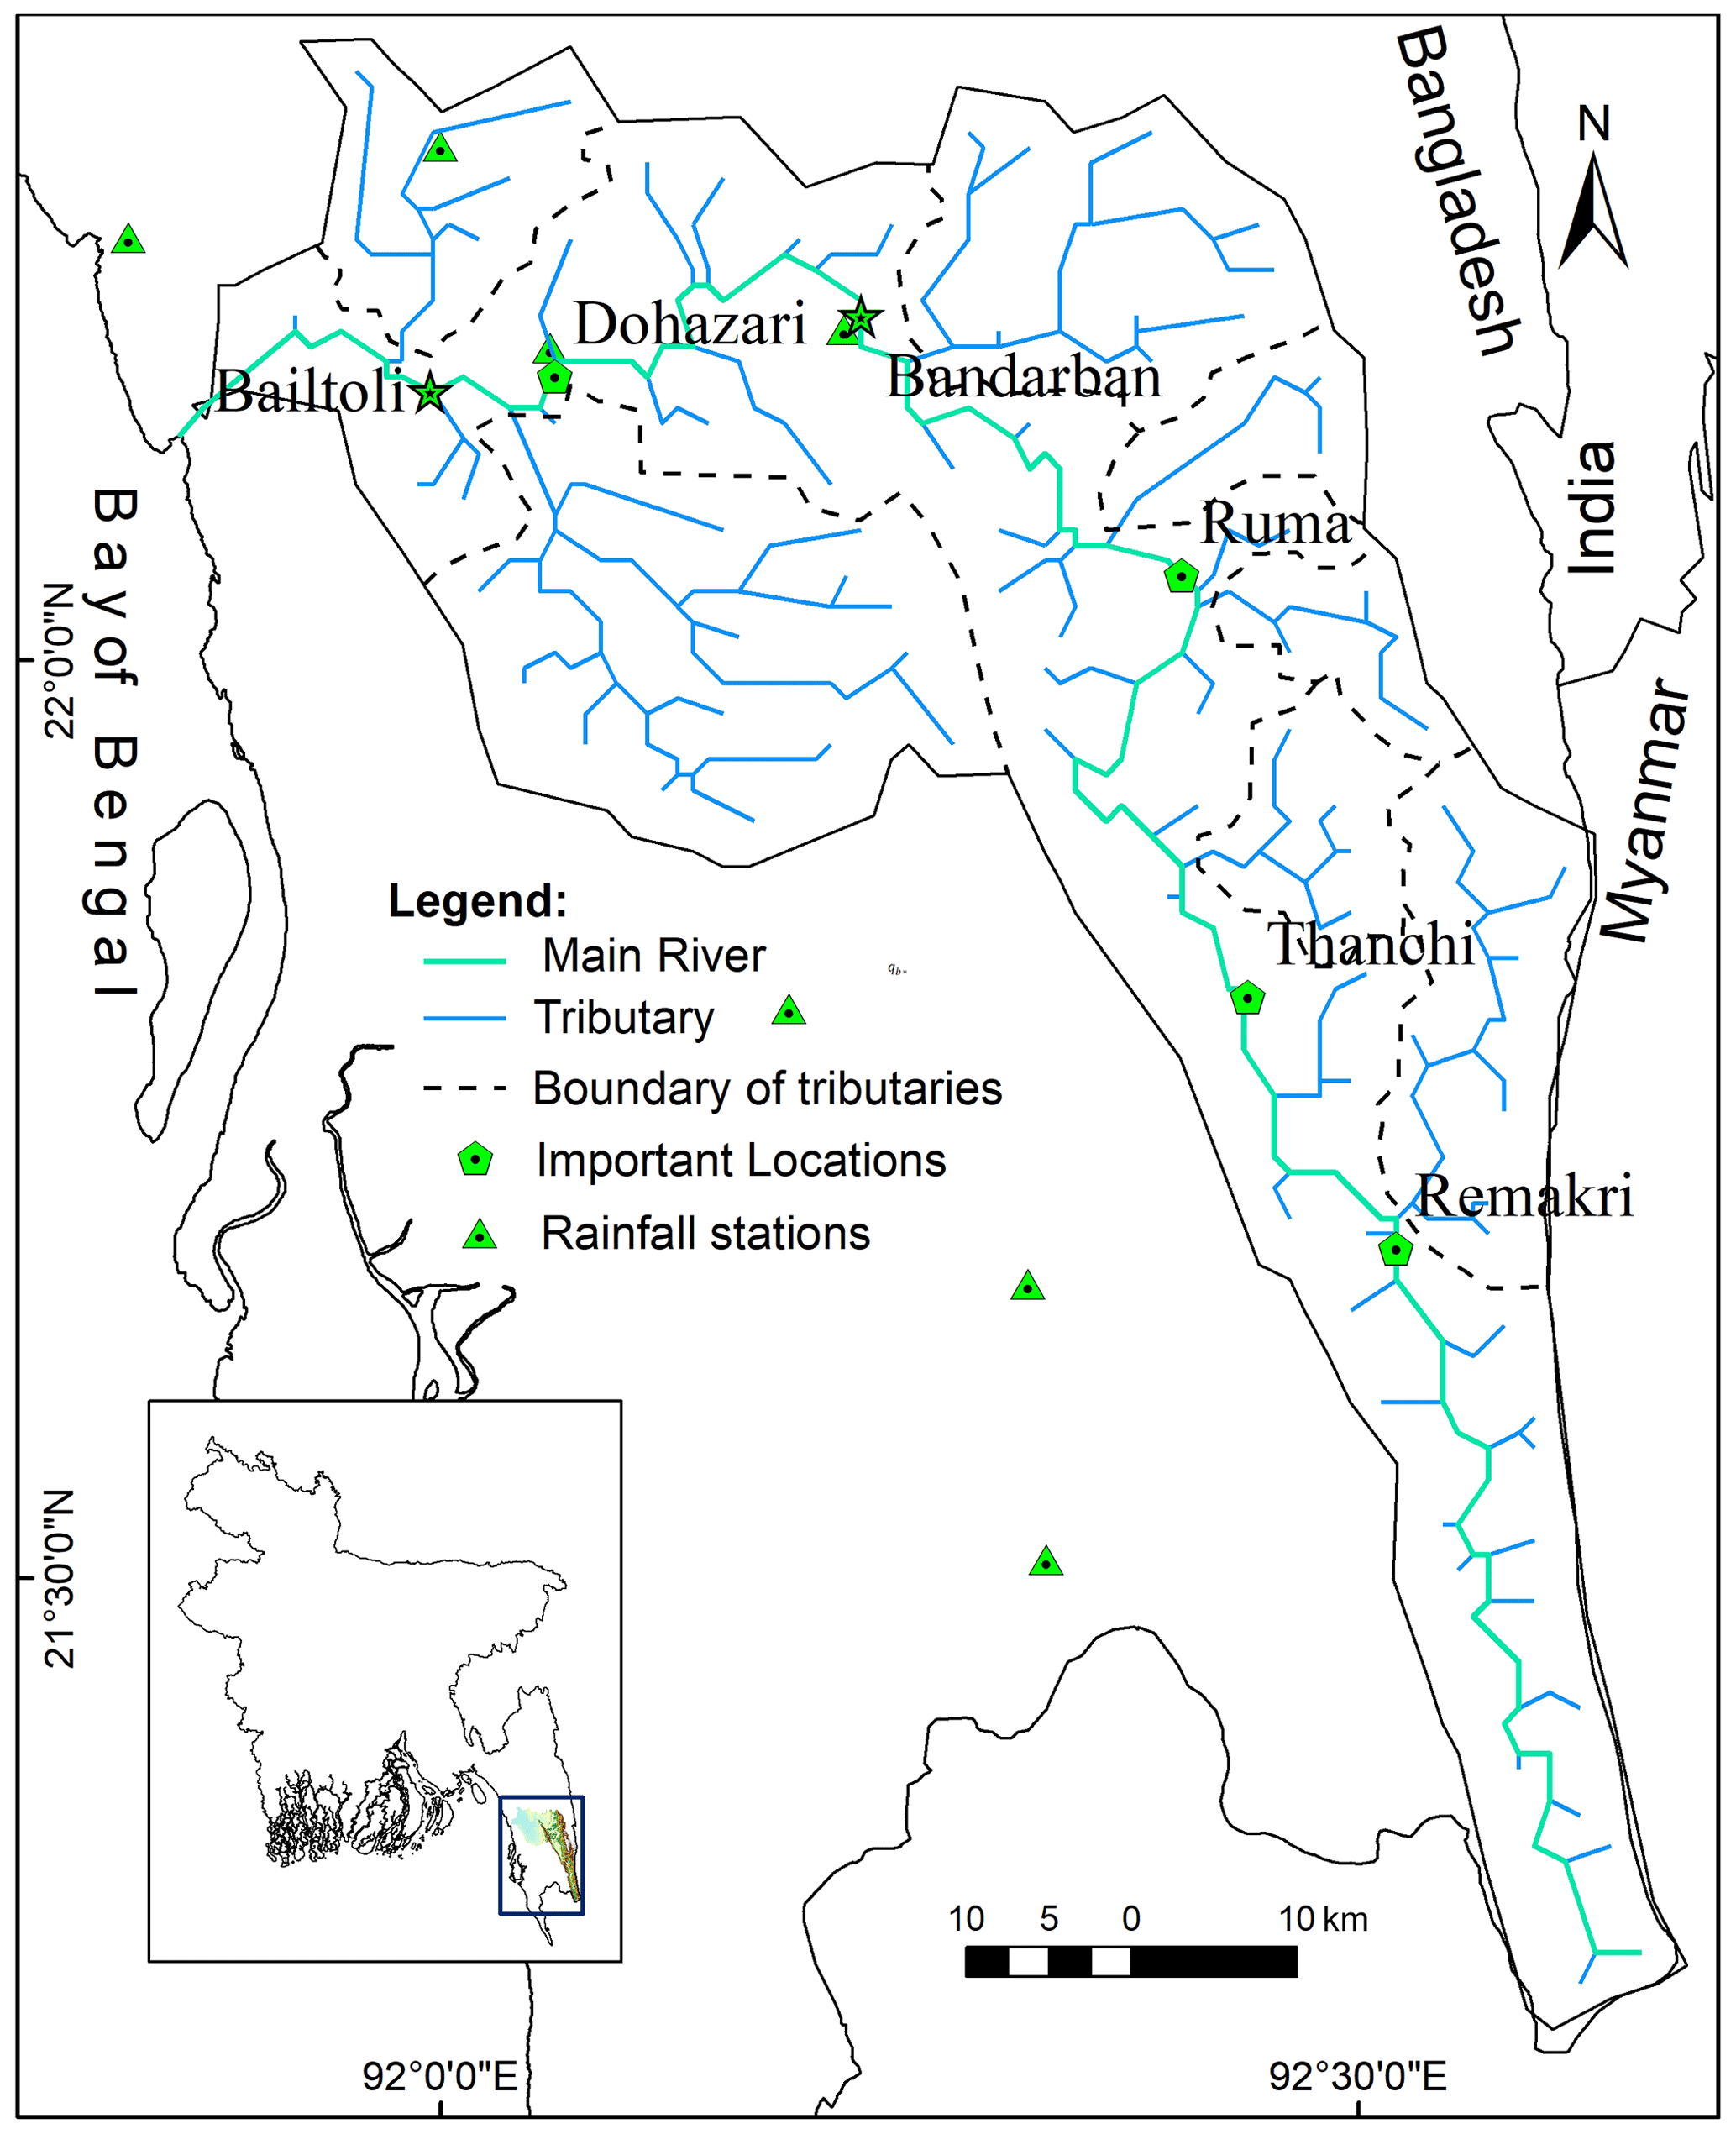
Figure 1Sangu River basin in Bangladesh.
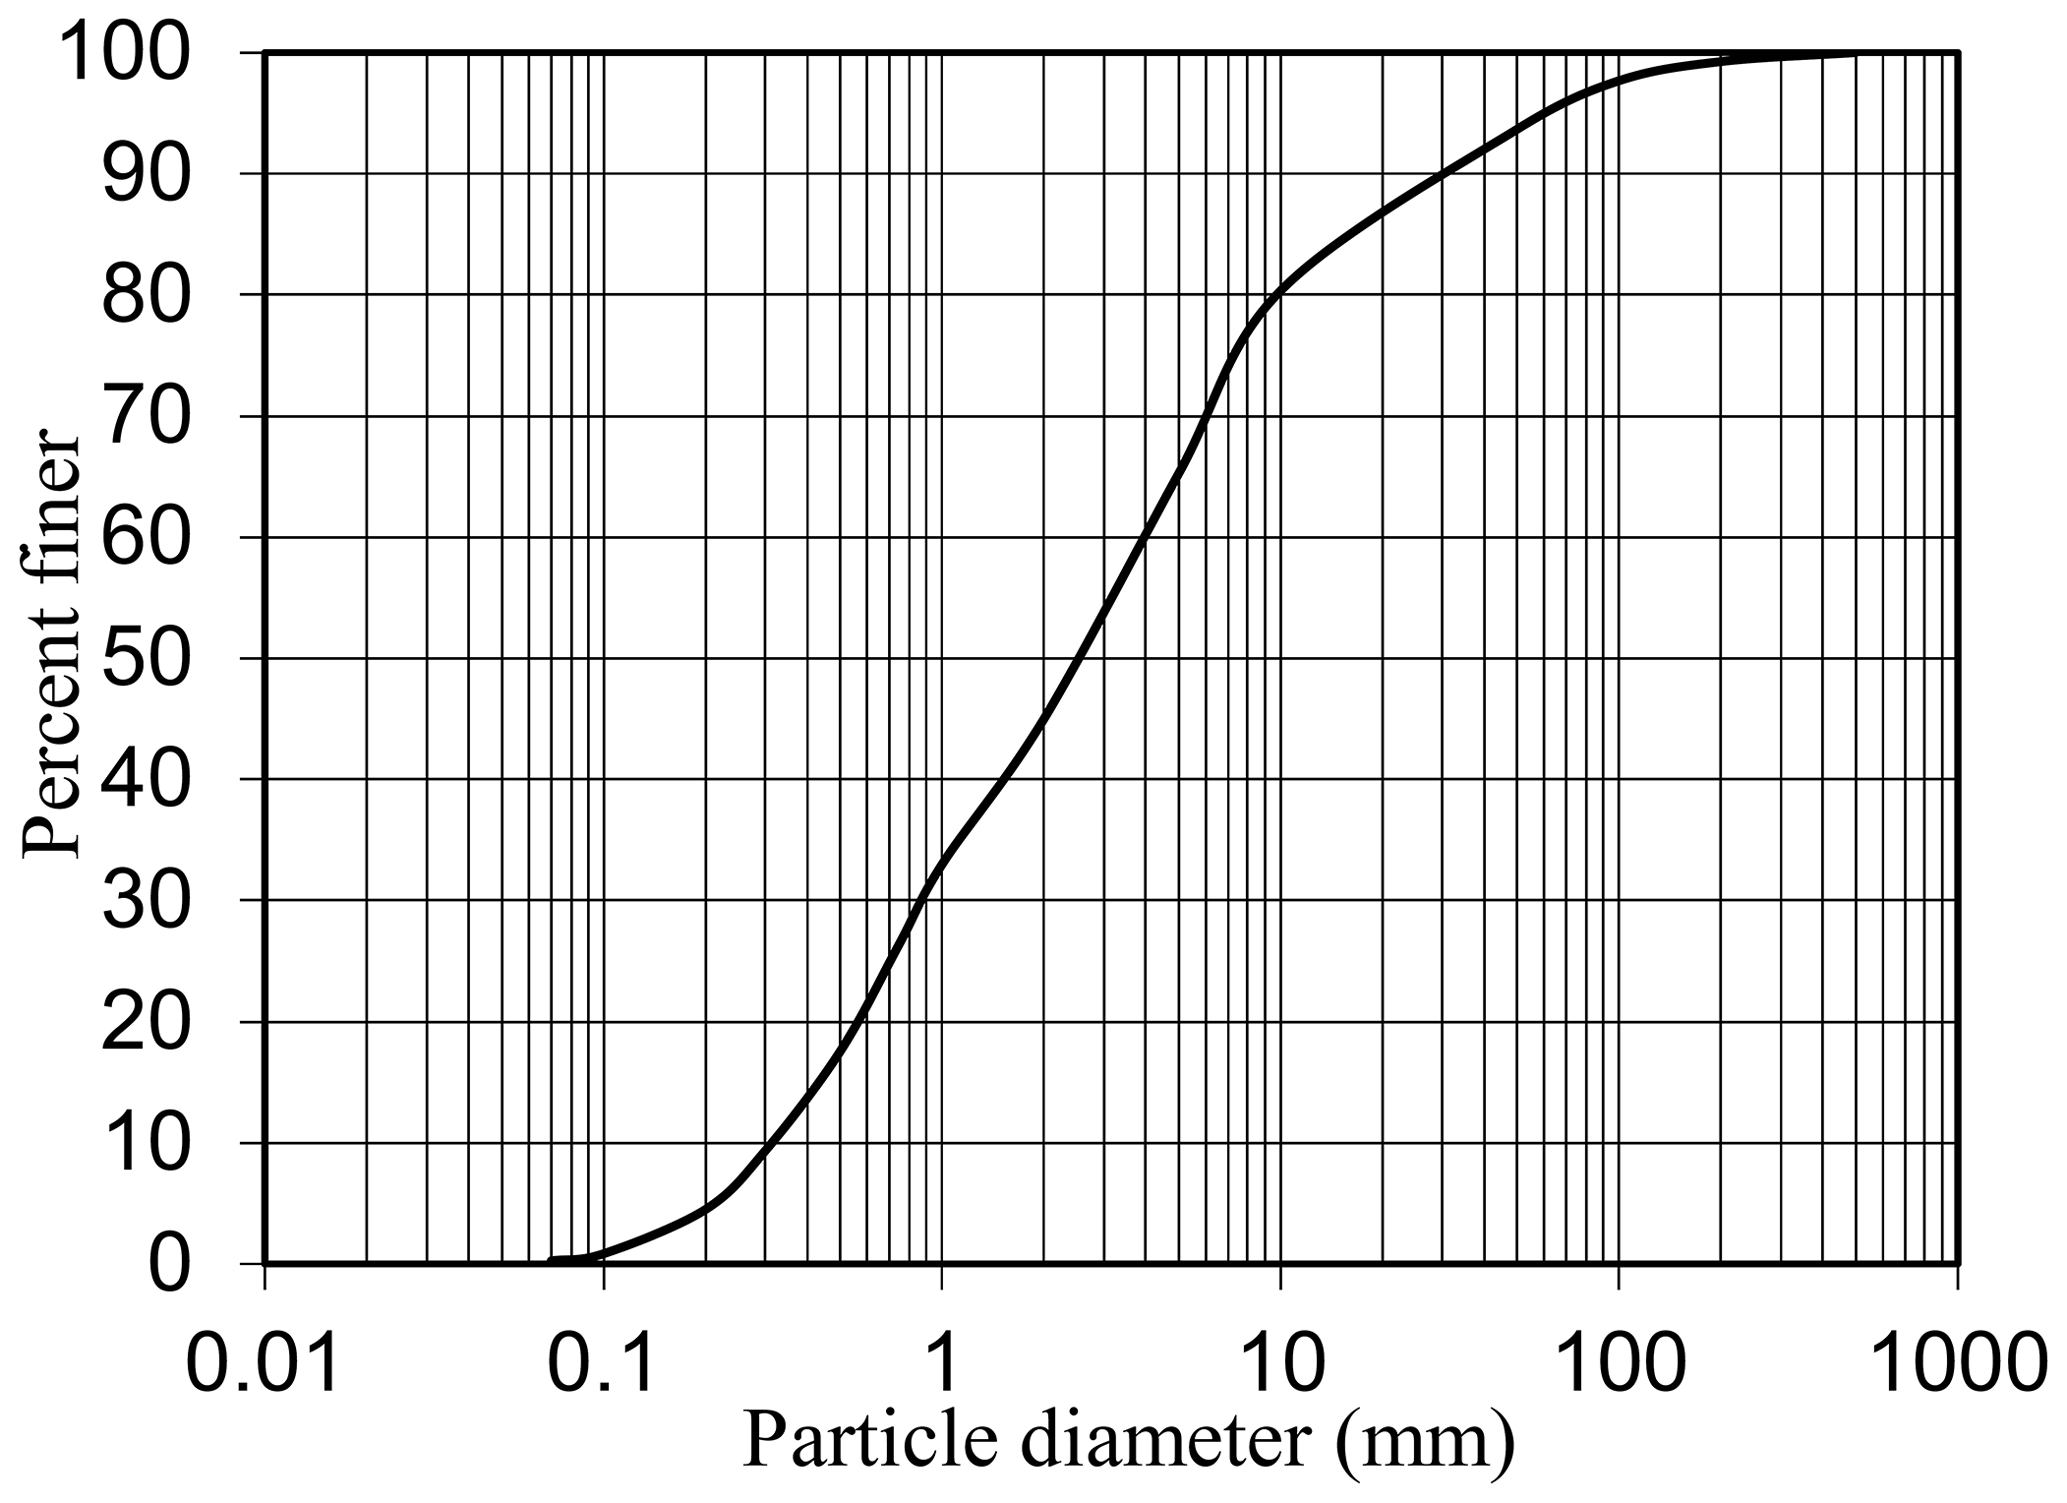
The RSR model was prepared for the Sangu River basin using SRTM 30S data. The computation was conducted using observed rainfall data collected in 2011. Model calibration and validation were conducted using the observed discharge at the Bandarban station. The Nash-Sutcliffe efficiency (NSE) was 0.72 for 2011 and 0.68 for 2007 for calibration and validation, respectively (Rahman et al., 2022). As a result of the model calibration, Manning's roughness for river, Manning's roughness for slope, soil depth, porosity, and hydraulic conductivity were determined to be 0.03, 0.40, 3 m, 0.50, 0.001 m s−1, respectively. Sensitivity analysis was performed to create an initial sediment particle size distribution consisting of 13 size classes ranging from 70 µm to 250 mm in diameter. Figure 2 shows the initial sediment particle size distribution of the bed materials. The exchange layer thickness for non-uniform sediment computation was set to 0.10 m. In this study, we neglected sediment supplies from slopes.
4.1 Sediment transport and sediment yield
Figure 3 compares simulated and observed suspended sediment discharges (Qs). The field-measured data were collected in 2018 and 2020 at Bandarban and Bailtoli, respectively. The measurement was done from a boat, in which ADCP discharge measurements and water sampling were conducted simulatniously. Several water samples were collected at each site, with variations in depth. Observations were made every two weeks during the flood season at the Bandarban site. At the Bailtoli site, which is tidally influenced, 21 surveys were made within three days. Figure 3 shows the validity of the RSR model in terms of suspended sediment transport.
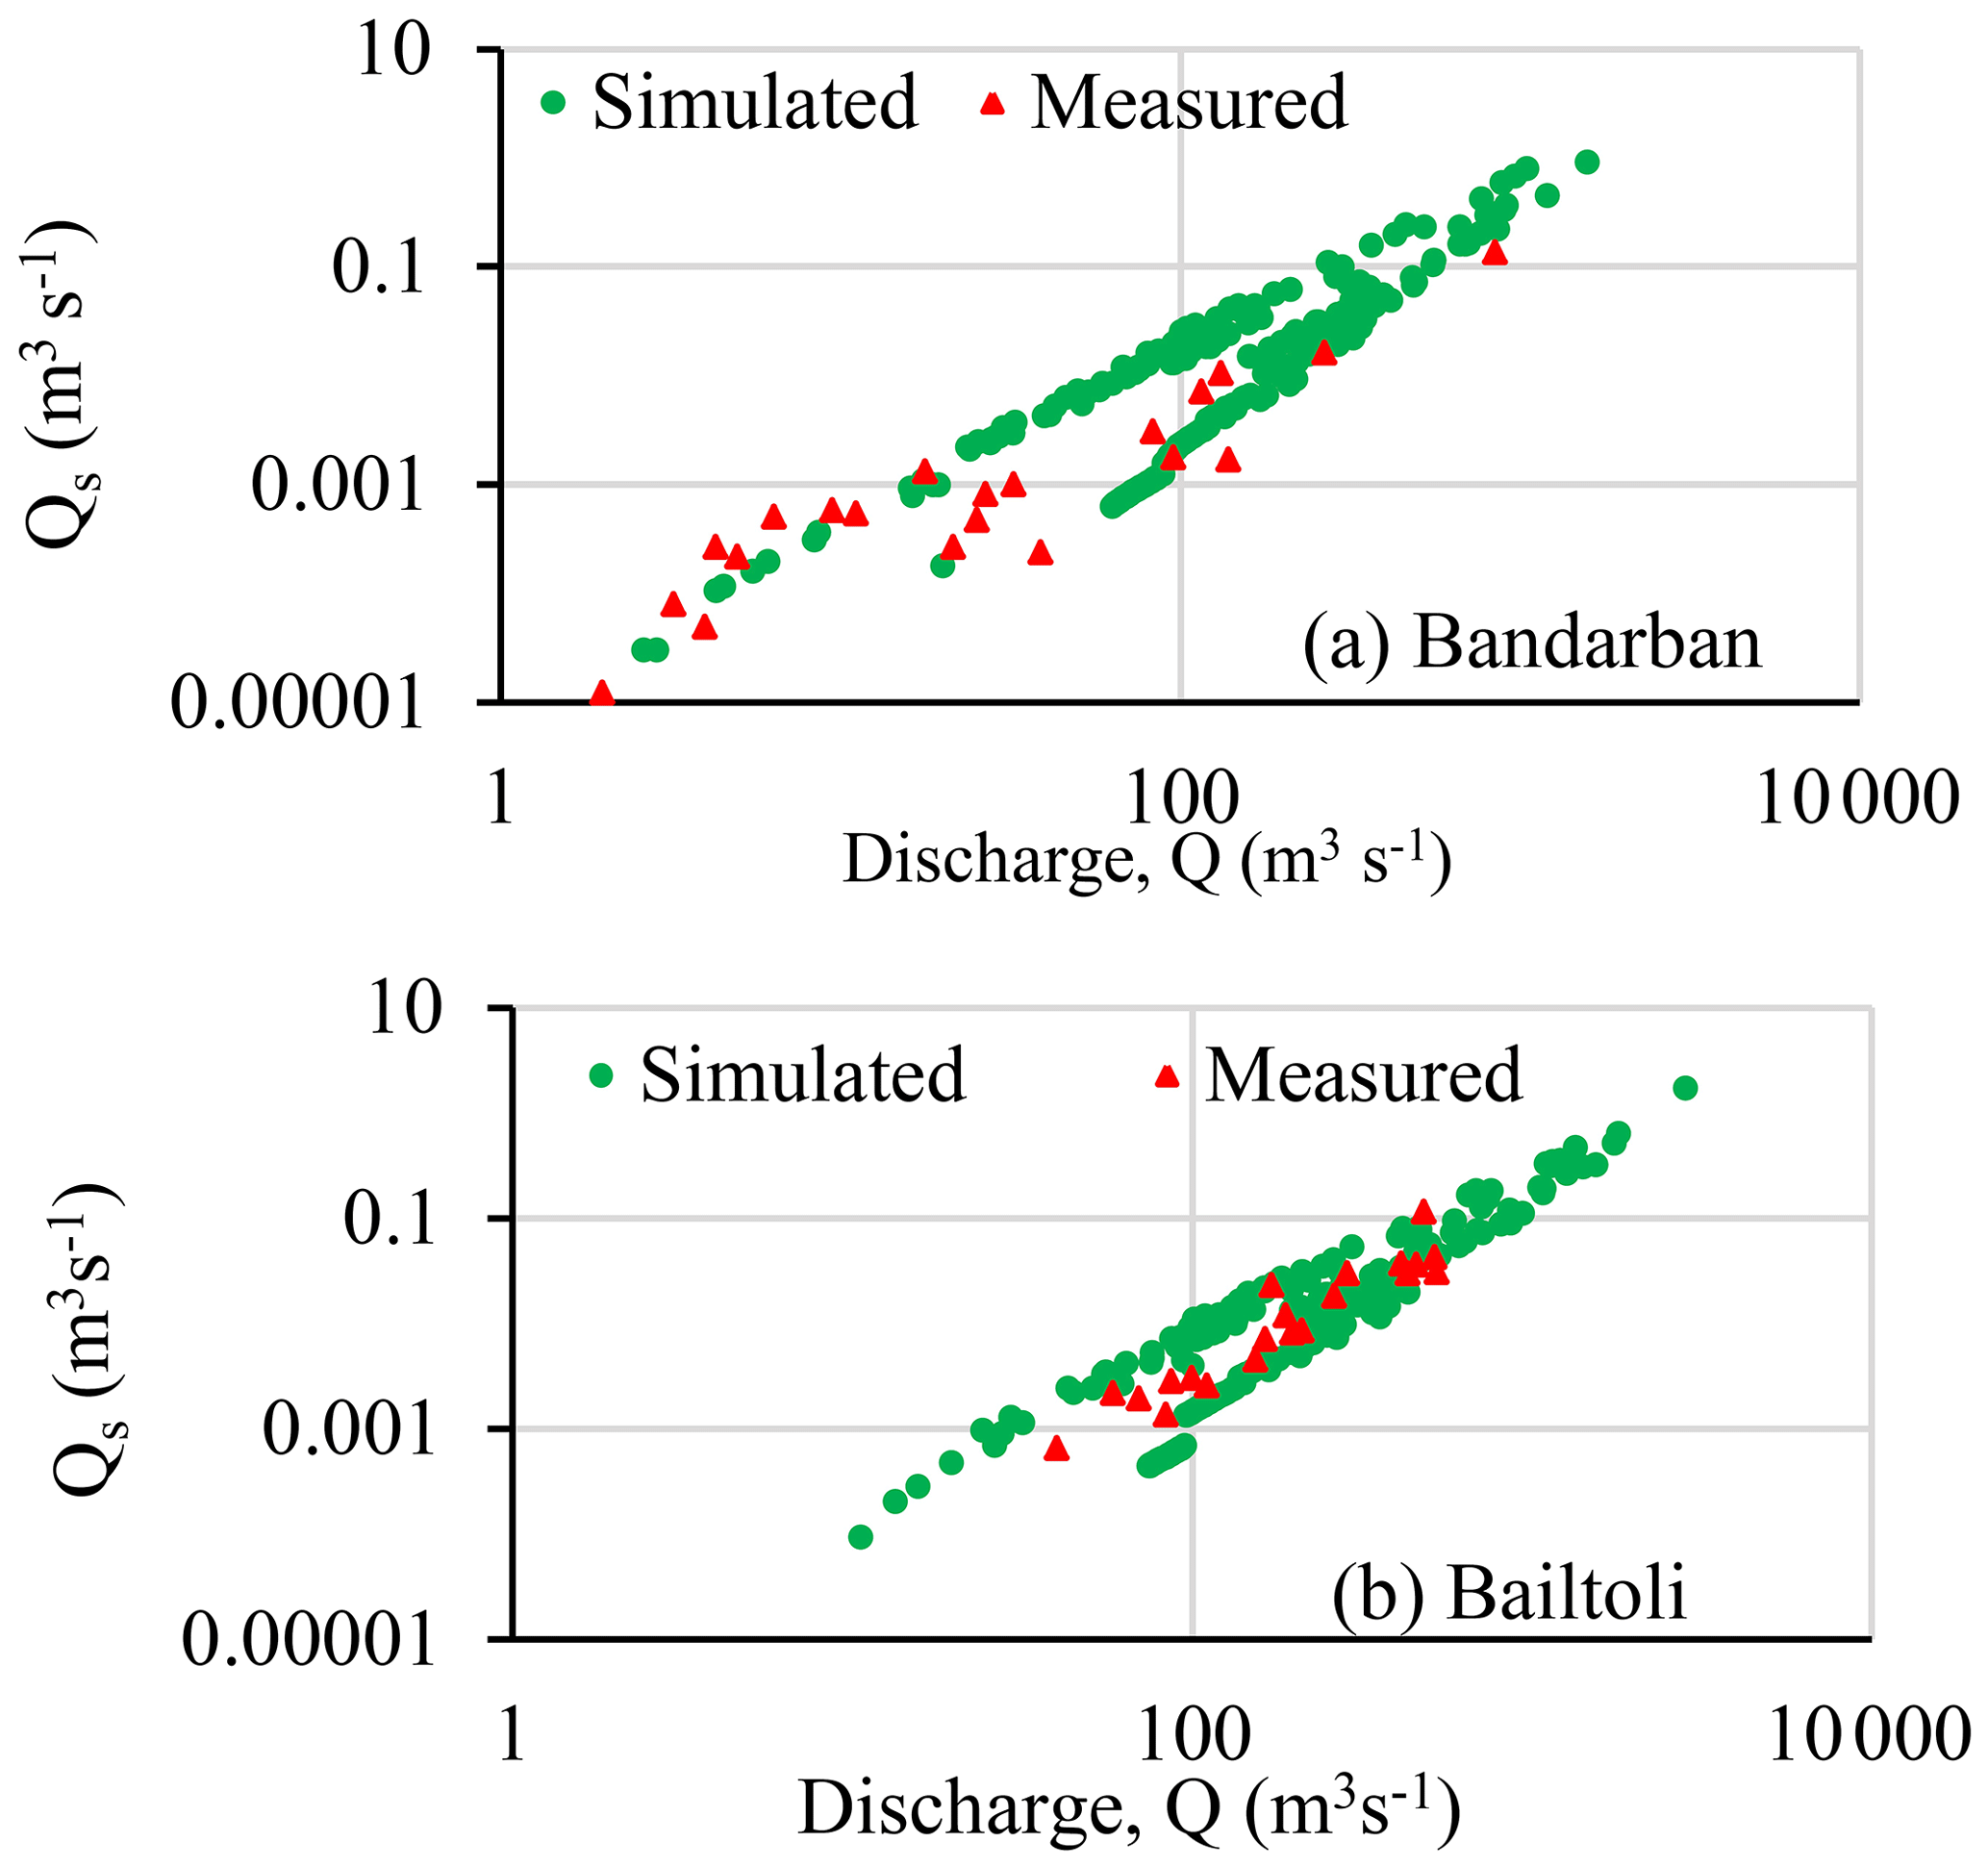
Figure 3Comparison of simulated suspended sediment discharge with field measurements at (a) Bandarban and (b) Bailtoli (Rahman et al., 2022).
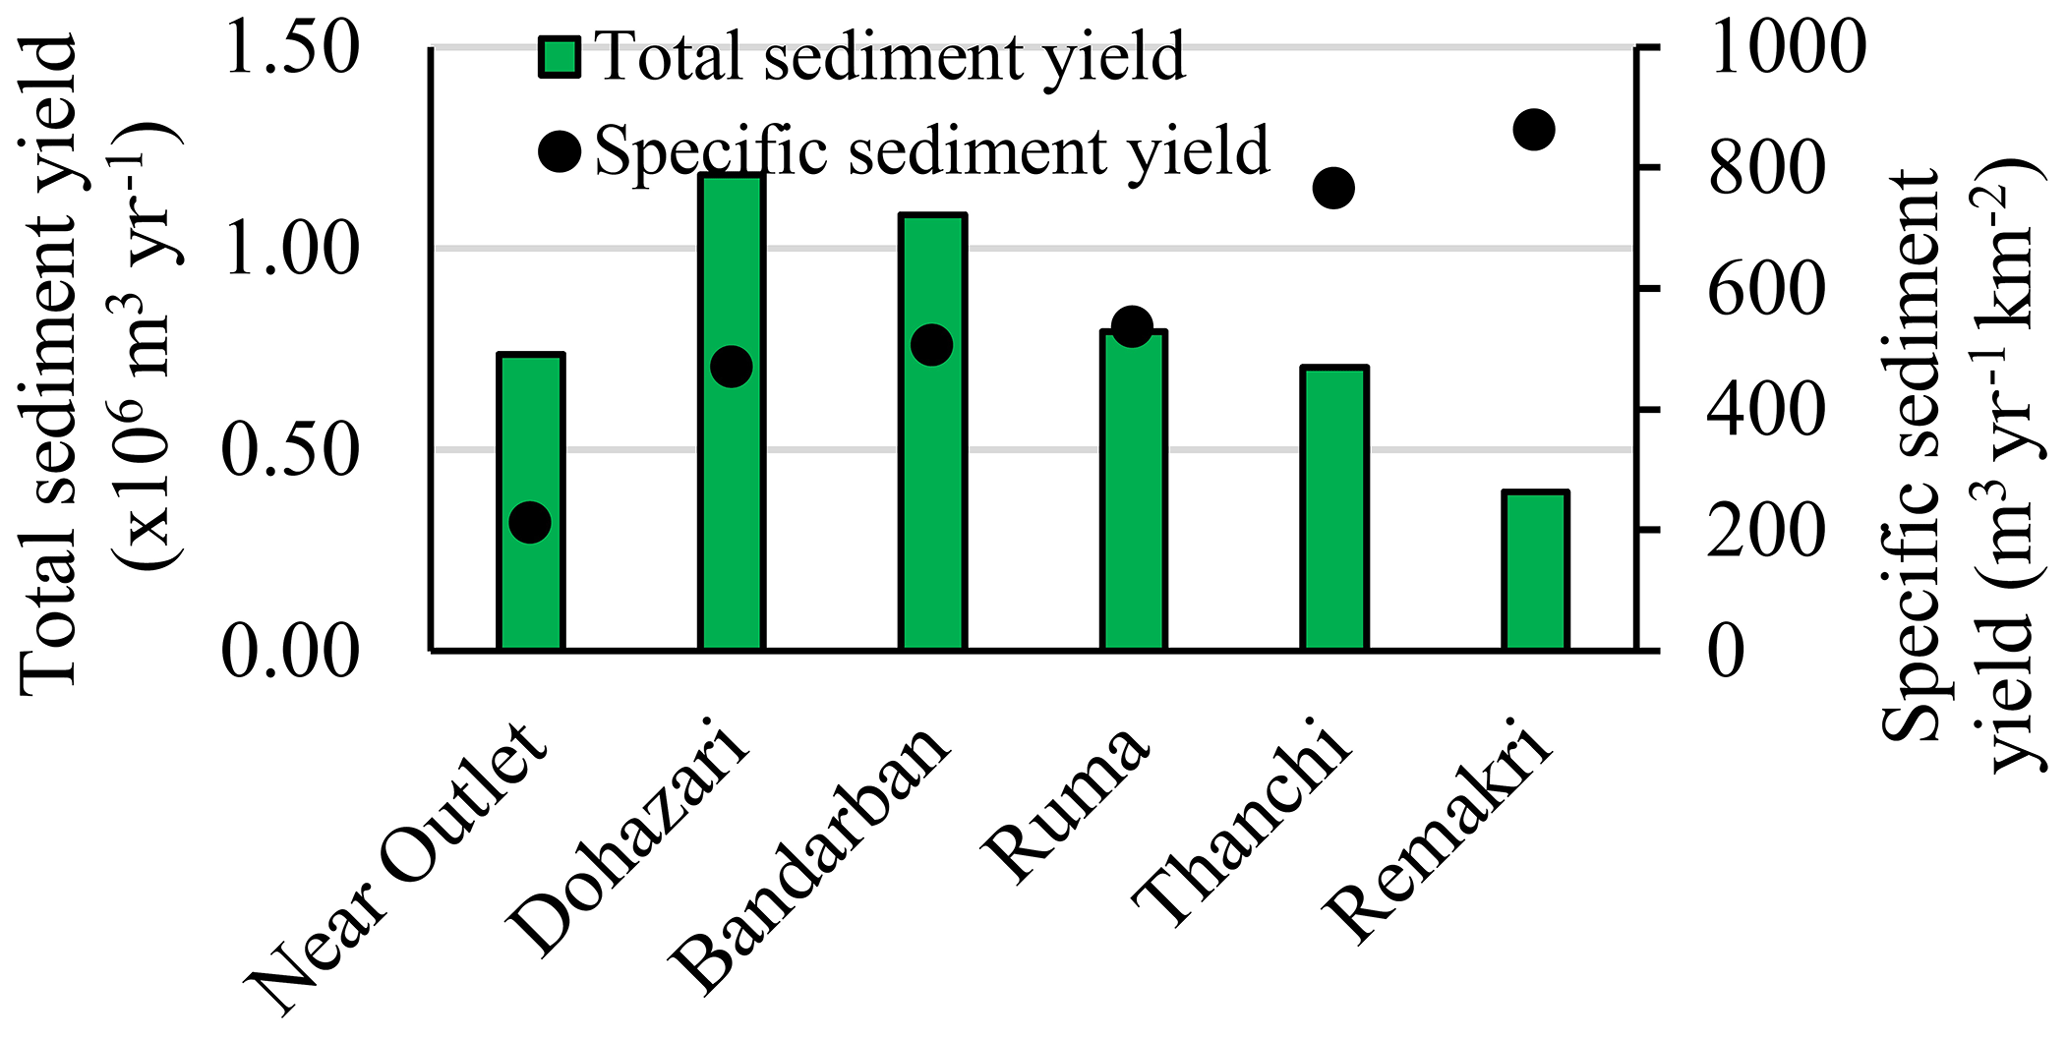
Figure 4 shows the total sediment yeild (combination of bed load and suspended load) and the specific sediment yeild at different locations of the main river. The total sediment yeild increases from upstream to downstream because of sediment supply from the tributaries. It decreases near the outlet as the sediment transport capacity decreases due to the wider river width around the river mouth. On the other hand, the specific sediment yeild decreases from upstream to downstream because of a higher sediment supply rate in the upstream area due to the steeper bed slopes. According to the model simulation results, about 7.5 × 10⁵ m3 of sediment discharges to the Bay of Bengal annually.
4.2 Bed deformation
Figure 5 shows the simulated bed deformation within one year. The tributaries actively supply sediment to the main river. Most of the sediment in the Sangu River comes from the hilly area through the tributaries and deposited in the downstream part of the main river. The maximum erosion at the upstream part is 0.36 m, and the maximum deposition is 0.74 m at the downstream part. Since the river is suspended load dominant, the bed deformation is mainly caused by suspended sediment. According to the results of the model computation, a considerable amount of sediment is transported from the upstream part and subsequently deposited in the lower and middle stream reaches, where sand bars form as a result of the phenomina. These characteristics of the river are the main causes of flooding, bank erosion, and navigability problems.
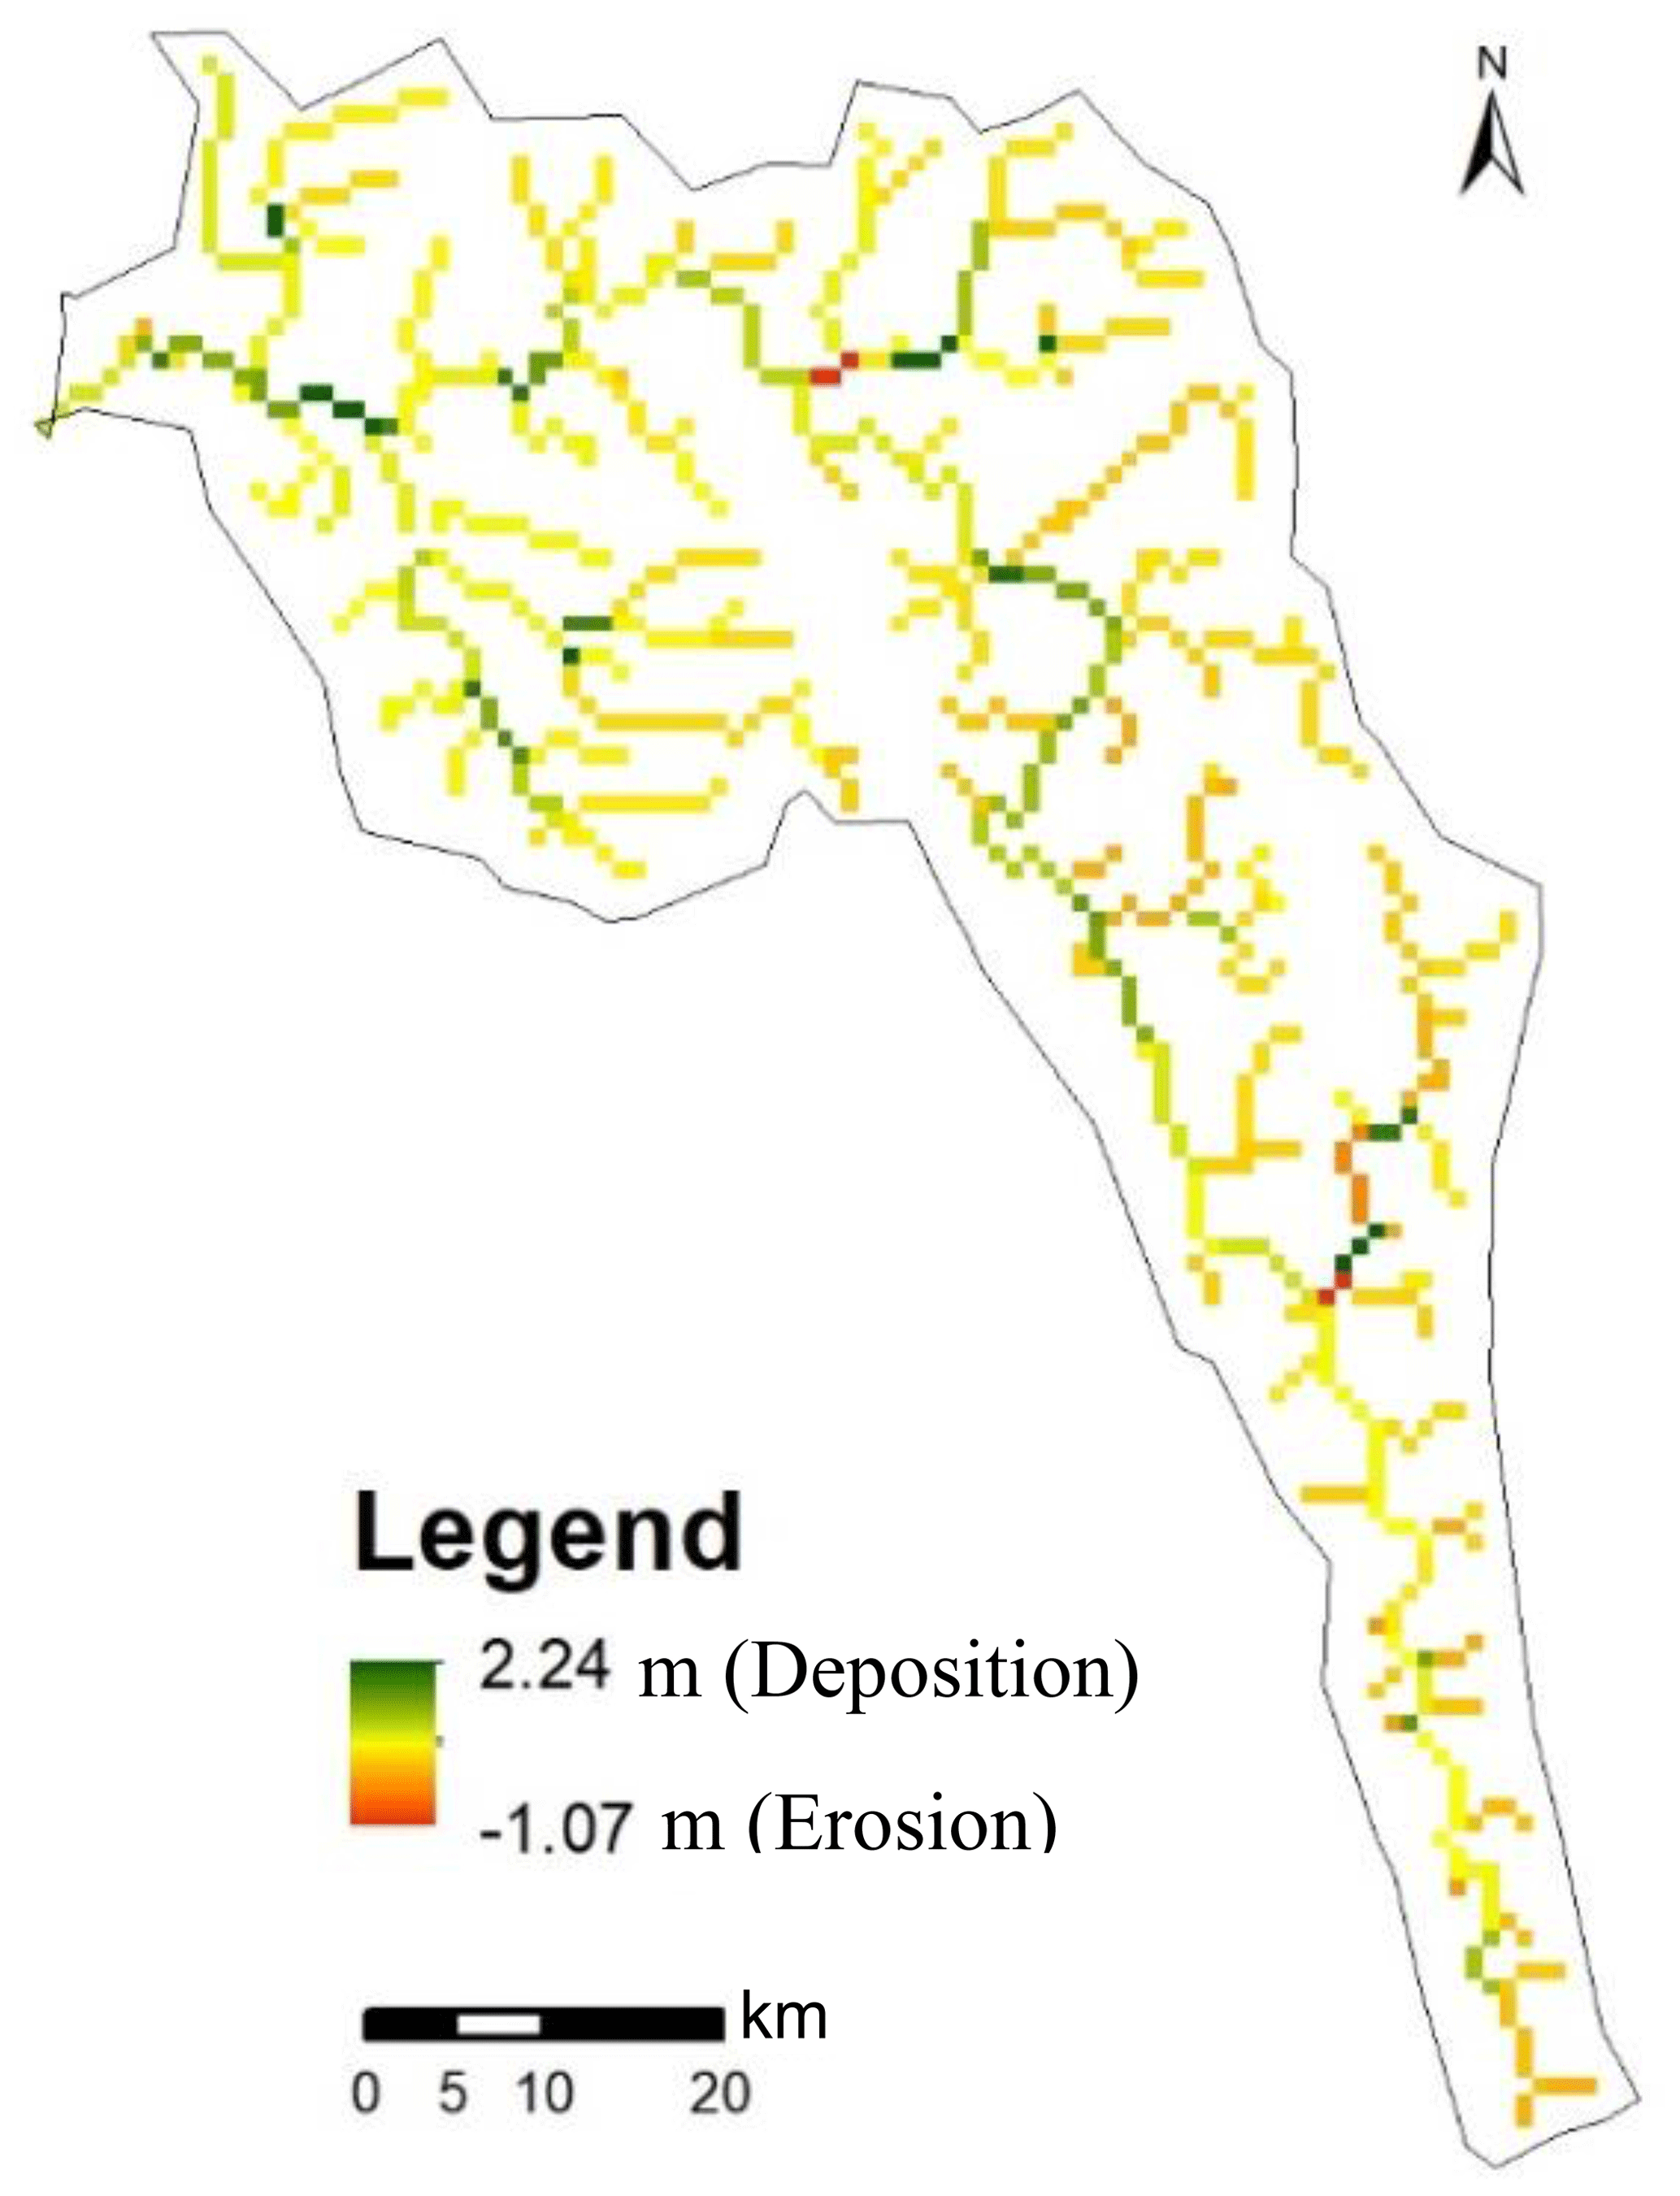
Figure 5Bed deformation within one year.
4.3 Countermeasures for sediment management
For proper sediment management of the river basin, countermeasures should be taken considering the river morphology, as well as environmental factors, such as ecosystems. Countermeasures should improve, or at least maintain, the current state of waterways. Excess inflow sediment that is produced by the tributaries can be controlled by taking soft and hard measures. Check dams are considered to be one of the effective and widely utilized soil conservation measures for sediment trapping, erosion mitigation, and watershed sedimentation control (Abbasi et al., 2019; Zhao et al., 2017). Though preventive soft measures for sediment yield reduction, such as land use regulation, are preferred, structural measures may be necessary for improving the current situations with significant sediment trapping. Since the river is dominated by suspended load (Rahman et al., 2022), it is imperative to derive a formula that can effectively estimate the quantity of sediment that can be trapped by check dams.
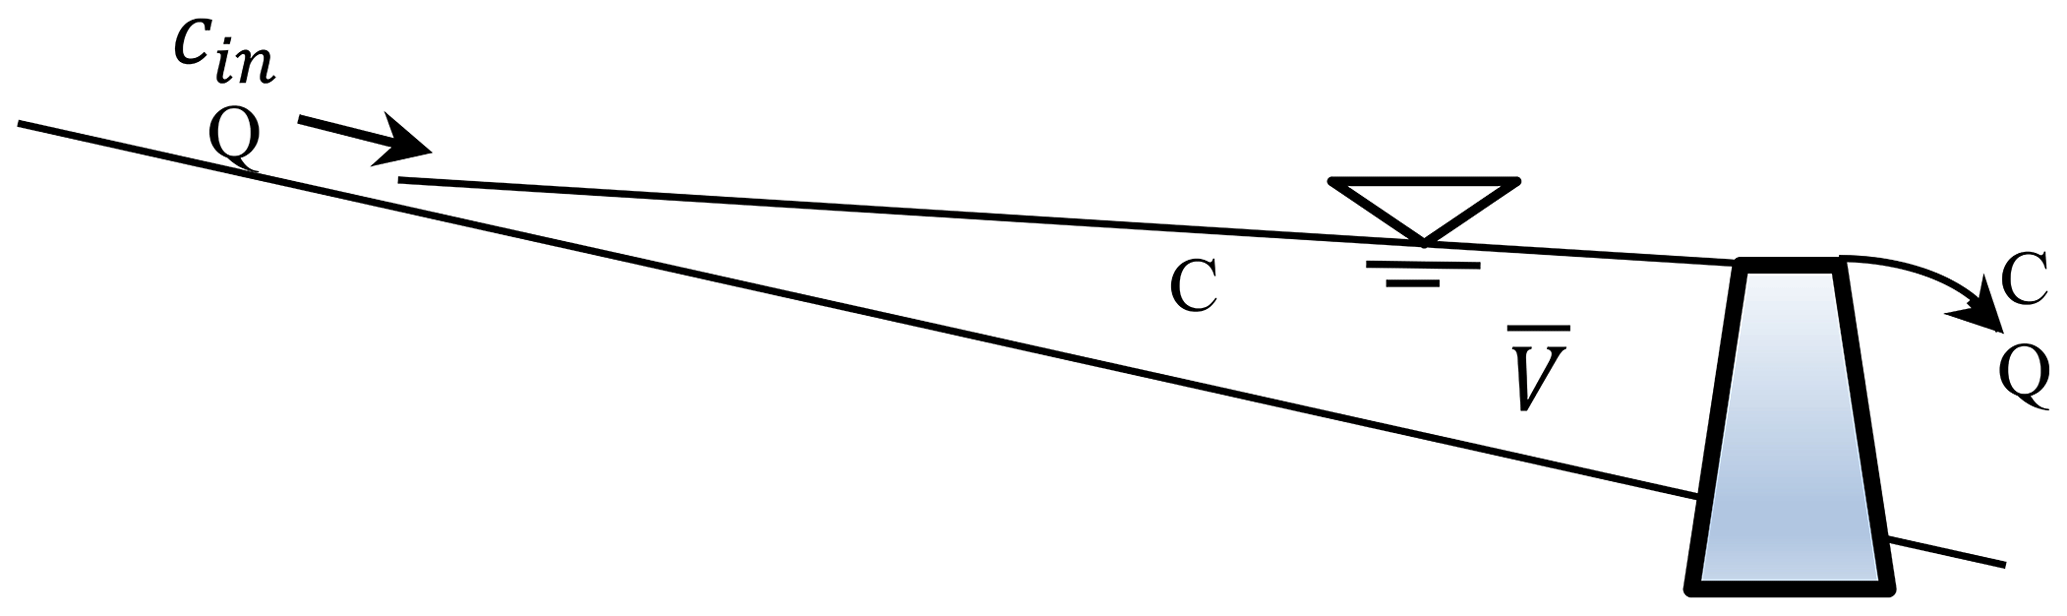
The temporal change in sediment concentration in the water stored at a check dam (Fig. 6) can be defined as:
Where is the volume of the dam storage, c is the suspended sediment concentration inside the dam storage, cin is the incoming suspended sediment concentration into the dam storage, Q is the flow discharge, wo is the particle fall velocity, and A is the area of the dam storage. The following equation can be derived using Eq. (6):
Equation (7) can be normalized as:
By integrating Eq. (9):
Where co is the initial concentration. When Eq. (10) can be expressed as follows:
When Eq. (11) is solved for t=∞:
For the sediment discharge trapped by the check dam, Qs trap can be determined by the following equation:
By replacing c in Eq. (13) using Eq. (12):
As per Eq. (14), the RSR model was updated to incorporate check dams as countermeasures.
Investigation was conducted by installing seven check dams at different tributaries in the upstream hilly area to control sediment load. In this study, the height of the check dam was assumed to be 10 m. Figure 7 shows the model-simulated bed deformations with check dams experimentally installed on different tributaries. Figure 8 compares the bed deformations along the main river with and without (W/O) check dams.
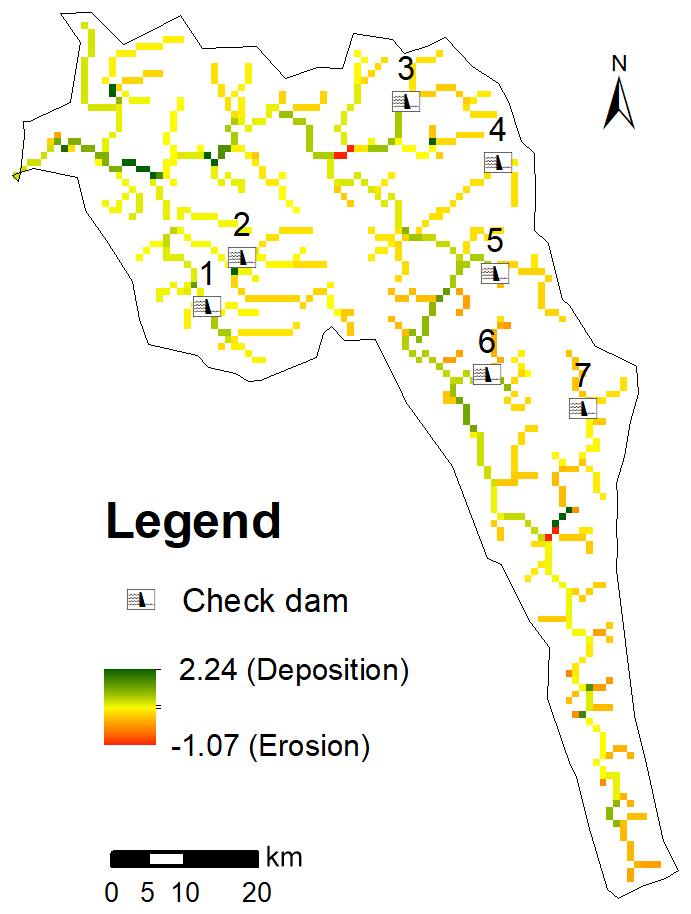
Figure 7Bed deformation with check dams.
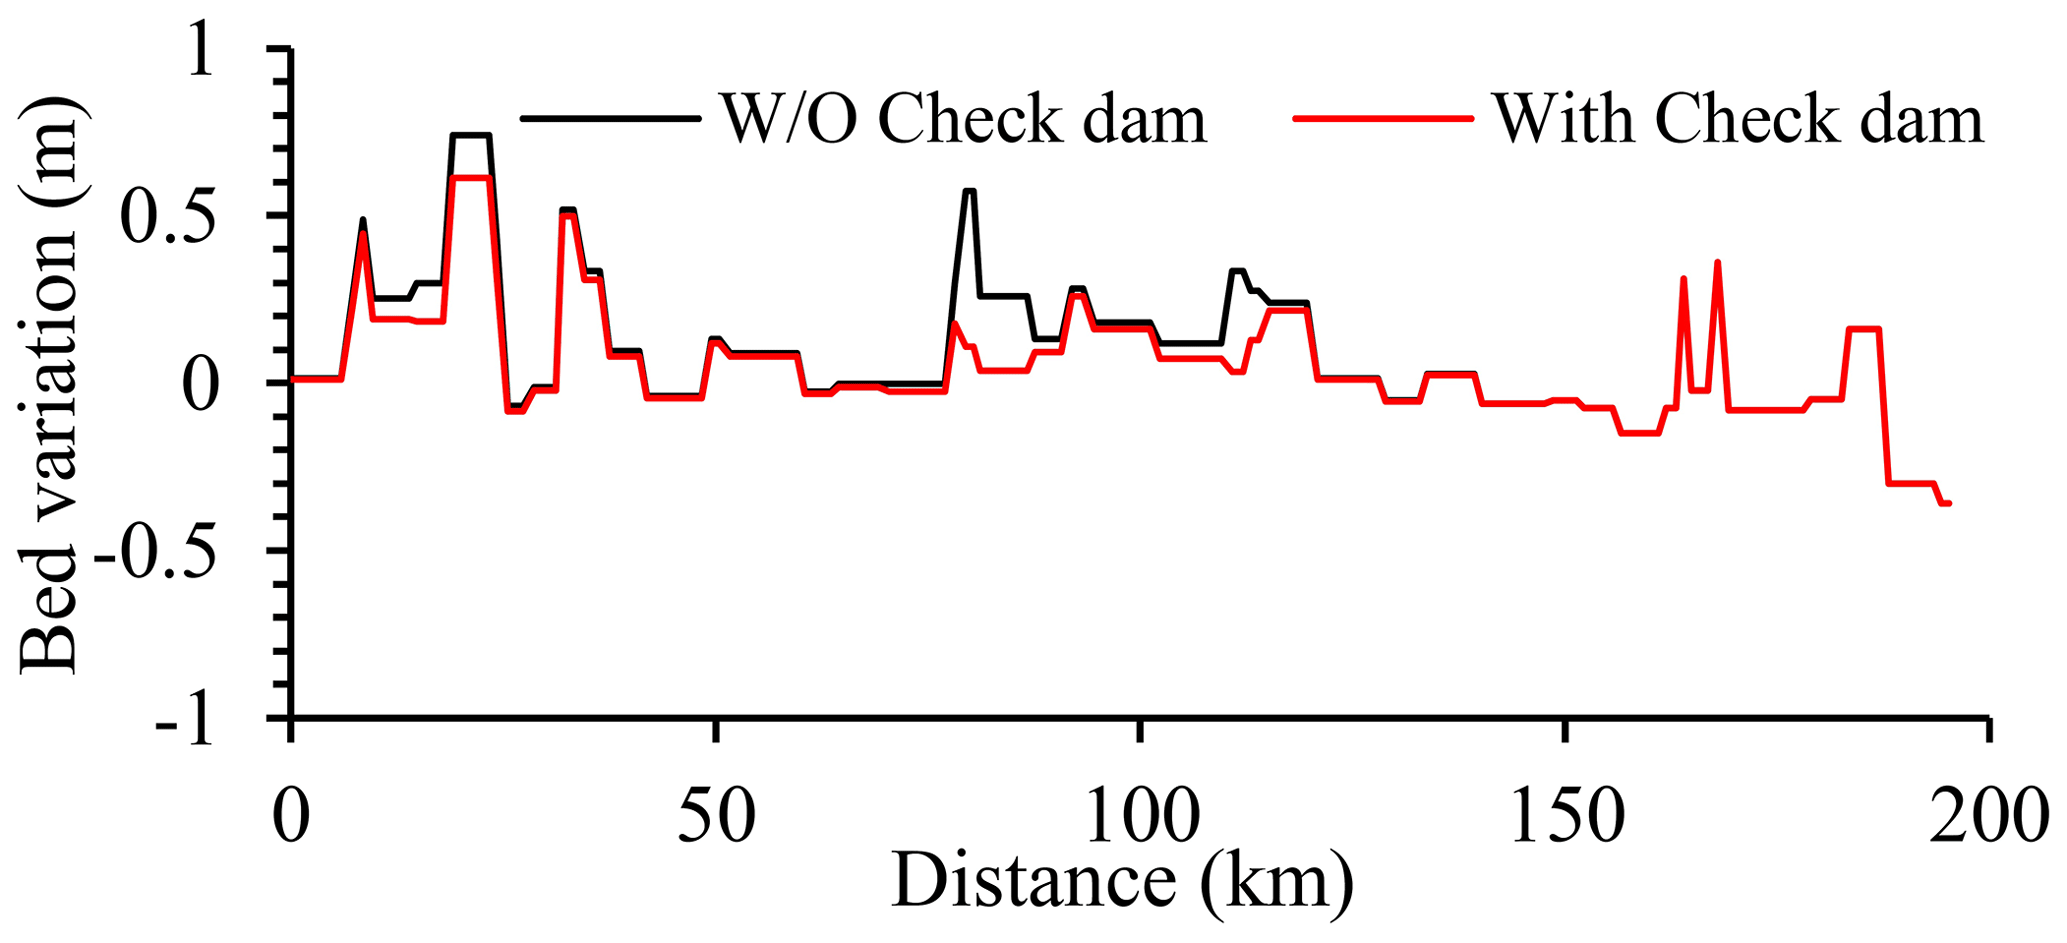
Figures 7 and 8 show that deposition is improved along the main river and its tributaries after installing the check-dams. In general, a significant improvement in the middle stream, as evidenced by a reduction in maximum depositions from 0.57 to 0.11 m and a corresponding decrease in volume by about 50 %. Similarly, the downstream also shows a decrease in the maximum deposition from 0.74 to 0.61 m, with a corresponding volume decrease of about 20 % and annual amount of sediment goes to the Bay of Bengal reduced from 7.5 × 10⁵ to 6.5 × 10⁵ m3.
The findings suggest that check dams can serve as effective measures for controlling sediment. However, it is worth noting that sediment build-up in check dams may lead to significant operational challenges and failures due to their limited lifespan (Zhao et al., 2017). Hence, it is imperative to take sustainable measures for sediment management of check dams; for example, sediment removal is the most suitable strategy. In order to determine the longevity of a check dam, a computational model was employed for a period of two consecutive years, specifically 2011 and 2012. The longevity of check dams 1, 2, and 3 can be considered significant. Check dams 4, 5, 6, and 7 will reach their maximum sediment capacity within a period of four to five years. The demand for sediment is significantly high in Bangladesh because, for any development activity, land filling measures are necessary since Bangladesh is a deltaic region with low-lying terrain. The potential removal of trapped sediment presents an opportunity to generate revenue for the government through its sale, given the significant demand for sediment in the region.
In this paper, we conducted basin-scale numerical simulations for assessing sediment transport processes for sustainable river sediment management considering structural measures in the Sangu River. The simulation results show that sediment deposition occurs in most areas of the lower and middle streams. In addition, the computation results with seven check dams in the tributaries show the effectiveness of such countermeasures. It should be noted that thorough feasibility analysis needs to be conducted prior to the implementation of any structure.
The data are available from the corresponding author on reasonable request.
MMR, DH and SE conceptualized the study; MMR performed the numerical simulations; MMR wrote the original draft of the manuscript; DH and SE reviewed and edited the manuscript.
At least one of the (co-)authors is a guest member of the editorial board of Proceedings of IAHS for the special issue “ICFM9 –River Basin Disaster Resilience and Sustainability by All”. The peer-review process was guided by an independent editor, and the authors also have no other competing interests to declare.
Publisher’s note: Copernicus Publications remains neutral with regard to jurisdictional claims made in the text, published maps, institutional affiliations, or any other geographical representation in this paper. While Copernicus Publications makes every effort to include appropriate place names, the final responsibility lies with the authors.
This article is part of the special issue “ICFM9 – River Basin Disaster Resilience and Sustainability by All”. It is a result of The 9th International Conference on Flood Management, Tsukuba, Japan, 18–22 February 2023.
The authors would like to express their gratitude to Bangladesh Water Development Board (BWDB) and JICA for supporting this study. The authors also wish to thank the editor and two anonymous reviewers for their constructive comments and suggestions, which helped to improve the quality of the paper.
This paper was edited by Kensuke Naito and reviewed by two anonymous referees.
Abbasi, N. A., Xu, X., Lucas-Borja, M. E., Dang, W., and Liu, B.: The use of check dams in watershed management projects: Examples from around the world, Sci. Total Environ., 676, 683–691, https://doi.org/10.1016/j.scitotenv.2019.04.249, 2019
Bhattarai, R. and Dutta, D.: Estimation of soil erosion and sediment yield using gis at catchment scale, Water Resour. Manag. J., 21, 1635–1647, 2007.
BWDB: Feasibility Study for Restoration of Sangu and Matamuhuri River Basin. Final report, IWM, 2021.
Egashira, S. and Ashida, K.: Studies on the Structures of Density Stratified Flows, Bulletin of the Disaster Prevention Research Institute, Kyoto University, 29, 165–198, 1980.
Egashira, S., Miyamoto, K., and Itoh, T.: Bed load rate in view of two phase flow dynamics, Annual Journal of Hydraulic Engineering JSCE, 41, 789–794, 1997.
Harada, D., Egashira, S., Ahmed, T. S., and Ito, H.: Entrainment of bed sediment composed of very fine material, Earth Surf. Proc. Land., 47, 3051–3061, https://doi.org/10.1002/esp.5442, 2022.
Owens, P. N.: Conceptual Models and Budgets for Sediment Management at the River Basin Scale, J. Soils Sediments, 5, 201–212, https://doi.org/10.1065/jss2005.05.133, 2005
Rahman, M. M., Harada, D., and Egashira, S.: Basin scale sediment transport processes using rainfall sediment runoff model – a case study of Sangu river basin, Journal of JSCE, Ser. B1 (Hydraulic Engineering), 78, I_1099-I_1104, https://doi.org/10.2208/jscejhe.78.2_I_1099, 2022.
Zhao, G., Kondolf, G. M., Mu, X., Han, M., He, Z., Rubin, Z., Wang, F., Gao, P., and Sun, W.: Sediment yield reduction associated with land use changes and check dams in a catchment of the Loess Plateau, China, Catena, 148, 126–137, https://doi.org/10.1016/j.catena.2016.05.010, 2017.