the Creative Commons Attribution 4.0 License.
the Creative Commons Attribution 4.0 License.
 | 18 Apr 2024
Spatial characterization of drought through CHIRPS and a station-based dataset in the Eastern Mediterranean
Christina Orieschnig
Yonca Cavus
Drought is a natural hazard which occurs in all climatic zones and affects different sectors, such as irrigation, energy, water supply, and ecology. Monitoring and predicting drought are pressing challenges, as drought is becoming more common and severe owing to the impacts of climate change and increased climatic variability. However, in many areas of the globe, the temporal and spatial characterization of droughts and drought severities are hindered by a lack of reliable, locally-measured long-term data and unevenly distributed, erratic meteorological stations. In this situation, remote sensing datasets such as Climate Hazards Group InfraRed Precipitation with Station Data (CHIRPS) can offer valuable insights into long-term developments and the spatial characteristics of droughts. Nonetheless, it is often uncertain to which extent data such as CHIRPS succeeds in representing local dynamics and how this varies between geographical regions and climate zones. In this analysis, we aim to evaluate spatial drought conditions over the Seyhan River basin in Turkey in the Eastern Mediterranean. Using the Standardized Precipitation Index (SPI) as a drought index, the applicability of CHIRPS as a long-term satellite precipitation product for drought monitoring is investigated. We compare two spatial representations of the SPI: one derived on a per-pixel basis from CHIRPS data since 1981, the other based on data from 19 meteorological stations scattered across the basin, which was spatialized using inverse distance weighted interpolation (IDW). Our results offer insights into the relative accuracy of CHIRPS data and avenues towards optimizing the quality of spatial drought characterization.
- Article
(2606 KB) - Full-text XML
- BibTeX
- EndNote


SDG13; Drought monitoring; CHIRPS; Remote sensing; Seyhan River Basin (Turkey)
Drought is one of the most common natural hazards, especially with the global increase in water demand, and the looming impacts of climate change. As such, combating droughts and mitigating their effects is an important action item in many landmark documents and strategies, such as the Sustainable Development Goals Resulting from a complex constellation of climatological and hydrological factors, a drought typically affects a wide swath of the population, with environmental, social, and economic effects. Where this is the case, drought indices such as the Standardized Precipitation Index (SPI, McKee et al., 1993) can be used to characterize these events and, consequently, to contribute to drought management. However, given the stochastic nature of droughts, a large and reliable dataset is is necessary for such a characterization. In many places of the world, this basis of data is lacking, which renders the calculation of drought indices over larger areas difficult.
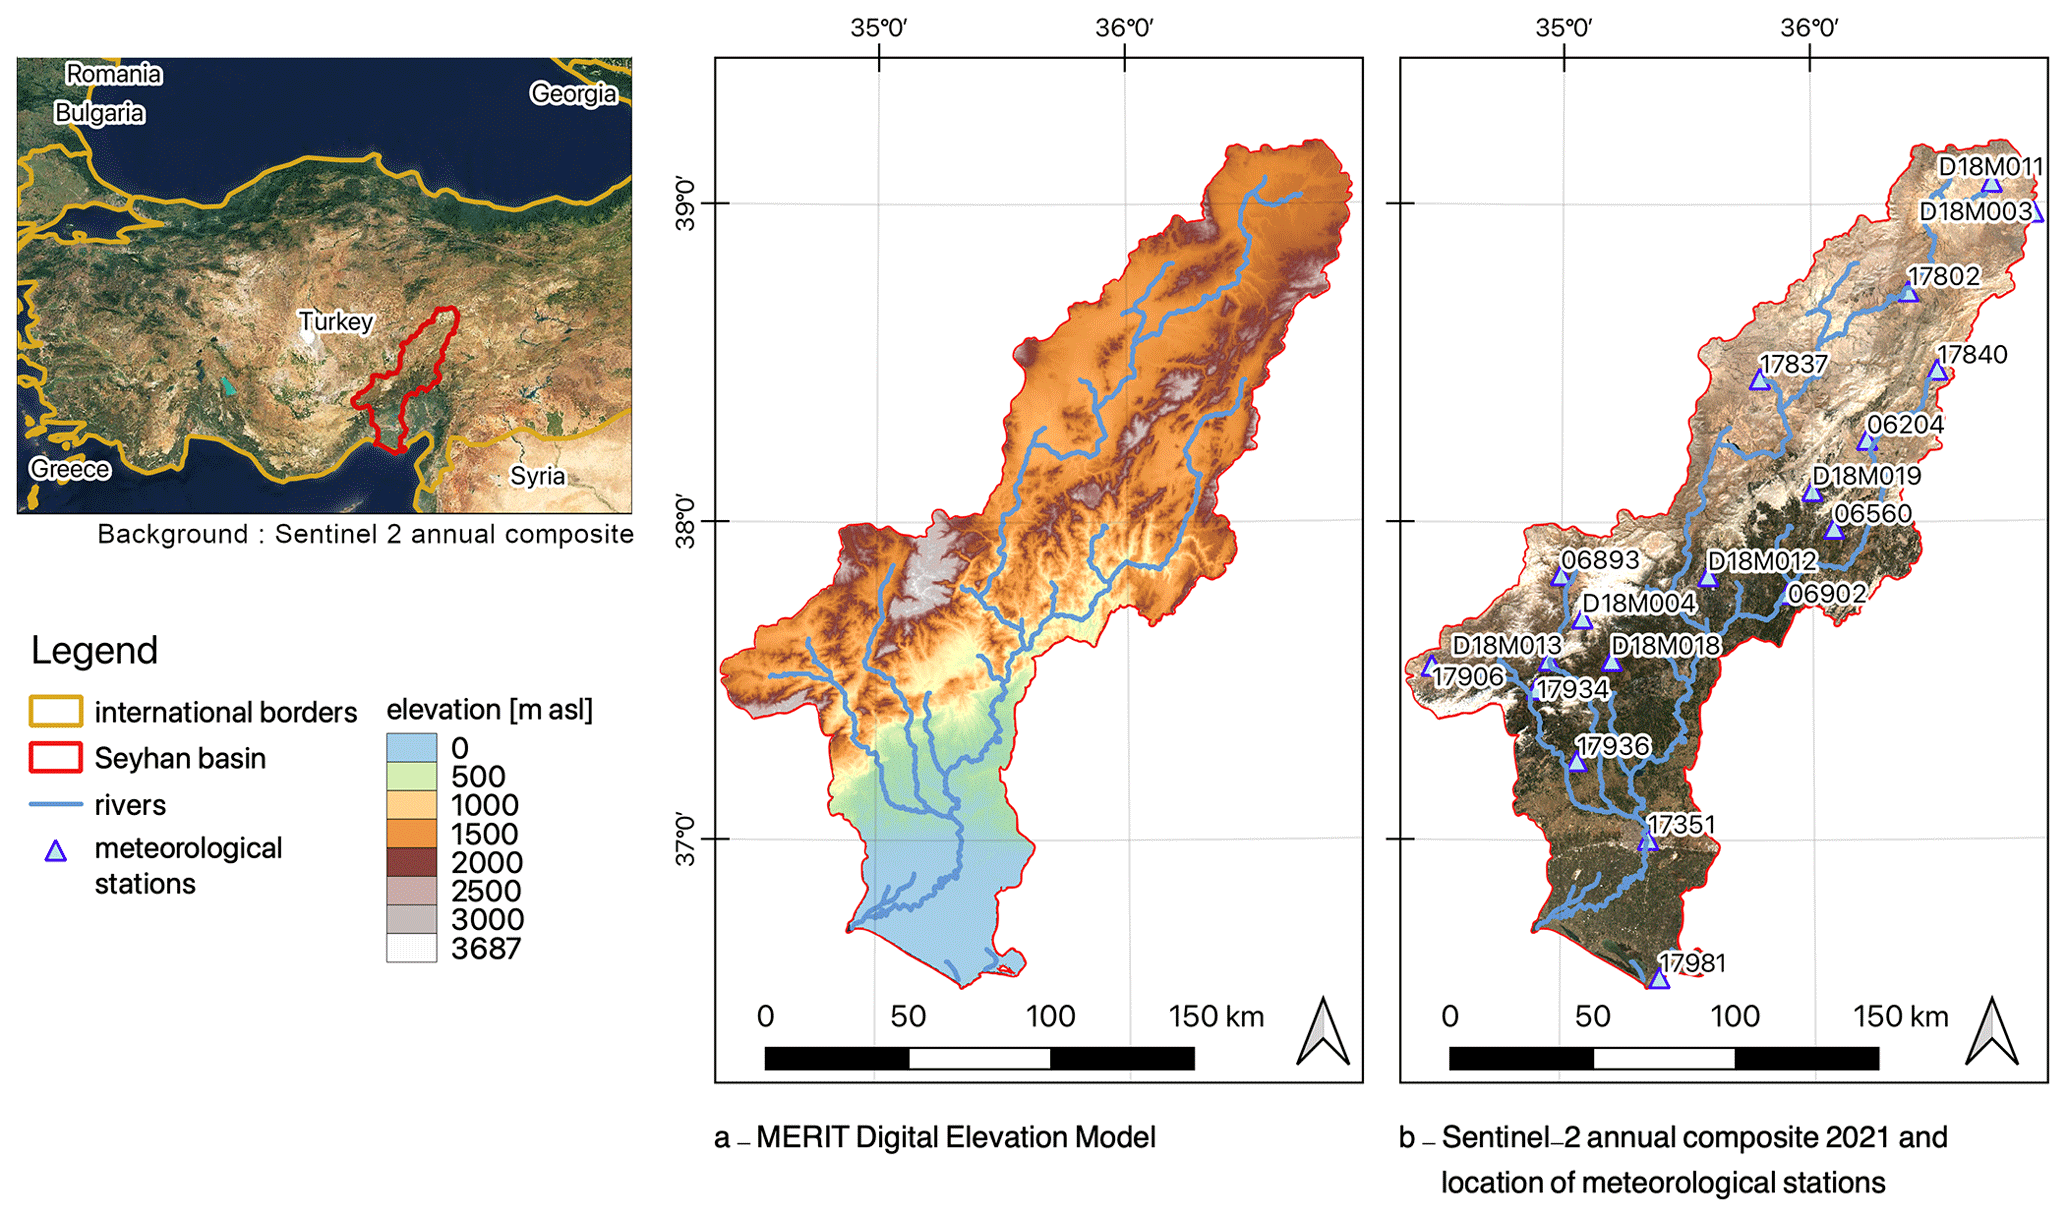
Figure 1The Seyhan River Basin in Turkey, its elevation, and drainage network.
Remotely sensed precipitation products such as CHIRPS (Climate Hazards Group InfraRed Precipitation with Station data, Funk et al., 2015) can provide an alternative pathway to a spatialized calculation of drought indices, especially in data sparse regions. However, the applicability and accuracy of these data need to be assessed in multiple ways before they can be applied with confidence. In this study, we compare the use of CHIRPS for the calculation of the SPI over the Seyhan River Basin against the use of data from nineteen meteorological stations. Inverse distance weighted (IDW) interpolation was used to determine the spatial distribution of precipitation deficits from in-situ data and compare it to CHIRPS-derived maps.
With this study, we aim to respond to the following research questions:
-
Is CHIRPS capable of accurately estimating in-situ precipitation in Mediterranean areas such as the Seyhan River Basin?
-
Are CHIRPS-based SPI values capable of accurately reflecting the values and distribution of SPI calculation using in-situ data?
-
Which additional insights does a spatial SPI raster derived from CHIRPS offer, compared to a spatialized representation of point-based data?
Located in Southern Turkey, the Seyhan River Basin stretches from the mountains of Central Anatolia to the lowlands along the Mediterranean coast (Fig. 1). The northern part of the river basin is characterized by steep terrain gradients, higher annual precipitation amounts, and lower temperatures. In the southern part of the basin, summers are hot and dry, while winters are warm and rainy. The coastal areas are characterized by a semi-arid Mediterranean climate. The Seyhan Basin stretches across 22 139 km2, with a north-south extent of approximately 300 km, and an average east-west extent of approximately 75 km. Its elevation ranges from 0 m a.s.l. at the Mediterranean coast to 3687 m a.s.l. 19 meteorological stations are scattered over the river basin. Their distribution is uneven, with a cluster of stations located in the central part of the basin, and very few in the south-western and north-eastern parts of the basin (Fig. 1b). The Seyhan Basin has been the region of interest for a number of hydrological studies, due to its large regional importance for irrigation, flood control, and hydropower generation (Cavus and Aksoy, 2019), which lends a high priority to the characterization of droughts in this area.
3.1 Data
In this study, two different types of data were used: monthly in-situ precipitation data from 19 meteorological stations and CHIRPS precipitation data extracted from the cloud computing platform Google Earth Engine (GEE, Gorelick et al., 2017). A complete list of the meteorological stations whose data was used in this study is provided in Cavus and Aksoy (2019). The stations are located between 22 and 1750 m a.s.l. in altitude and register between 274 and 1006 mm annual precipitation on average. The data used originates from between 1960 and 2016, though the length of observation periods varies between stations, and there are some discontinuities in the precipitation time series at several stations. For instance, station 6560 provides data only between 1986 and 1995 and additionally misses four months of data in this period. In contrast, station 17351 offers a complete and consistent time series between 1960 and 2016. Overall, there are multiple years for which data from fewer than 19 stations is available for the calculation of SPI values. The data was provided by the Turkish State Meteorological Service (MGM) and the General Directorate of State Hydraulic Works (DSI). Monthly precipitation sums were used for the analysis.
The second data type used was CHIRPS, a long-duration, high-resolution precipitation product based on remotely sensed infrared Cold Cloud Duration (CDD) observations, corrected with local station data where available. It provides data at various temporal resolutions – daily, pentadal, and monthly – for the period since 1981, and at a spatial resolution of 0.05 arcdeg (Funk et al., 2015). For the purposes of this analysis, daily CHIRPS data available via GEE were summed up to calculate monthly precipitation sums for the years between 1981 and 2016.
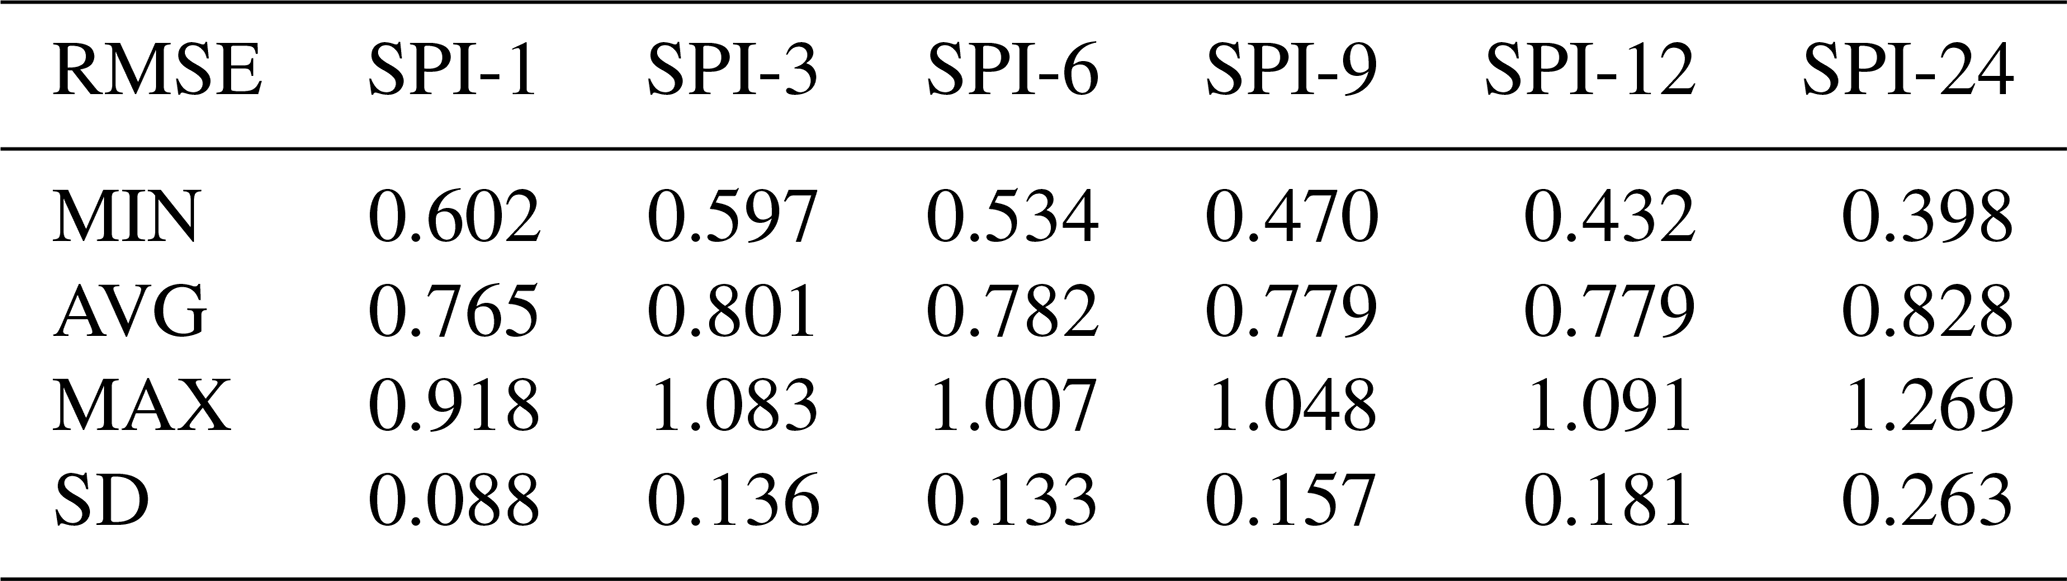
Table 1RMSE characteristics for SPI time series, averaged across stations.
3.2 Comparison of Data
The in-situ precipitation data was compared to CHIRPS values in three ways. First, the monthly precipitation sums were compared directly to pinpoint any systematic and random deviations between two time series. Second, the SPI was calculated using data from both sources. The SPI was developed by McKee et al. (1993) and is one of the most well-known drought indices. Its principal advantage is that it overcomes issues arising from the use of a non-standardized distribution by first transforming the distribution of the rainfall record to a normal distribution by fitting it to a gamma distribution through an equal-probability transformation. Furthermore, the SPI is advantageous as it can be calculated for different time scales.
In this application, the SPI was calculated at time scales of 1, 3, 6, 9, 12 and 24 months. The reason for this choice in interval is that SPI-1 and -3 are typically used to characterize meteorological drought, SPI-6 and -9 are used to characterize agricultural drought, and SPI-12 and -24 are used to characterize hydrological drought, with effects on reservoirs and groundwater. To compare the results obtained from the two different data sources, the root mean squared error (RMSE) was calculated. To investigate possible sources of bias, RMSE values were then correlated with parameters such as the duration of in-situ time series and the elevation of the station. This analysis was carried out twice: once using the entirety of the available time series from both data sources, and once using only the period for which both types of data are available. The purpose was to exclude bias caused by the length of the data series. A more in-depth comparison of SPIs was also carried out for 1990, one of the most well-known drought years in this river basin (Cavus and Aksoy, 2019).
Finally, a spatial comparison of data was conducted. This contrasted a pixel-wise calculation of the SPI for the drought year 1990 derived directly from CHIRPS and a spatialized representation of SPI values calculated using data from in-situ stations and inverse distance weighted (IDW) interpolation.
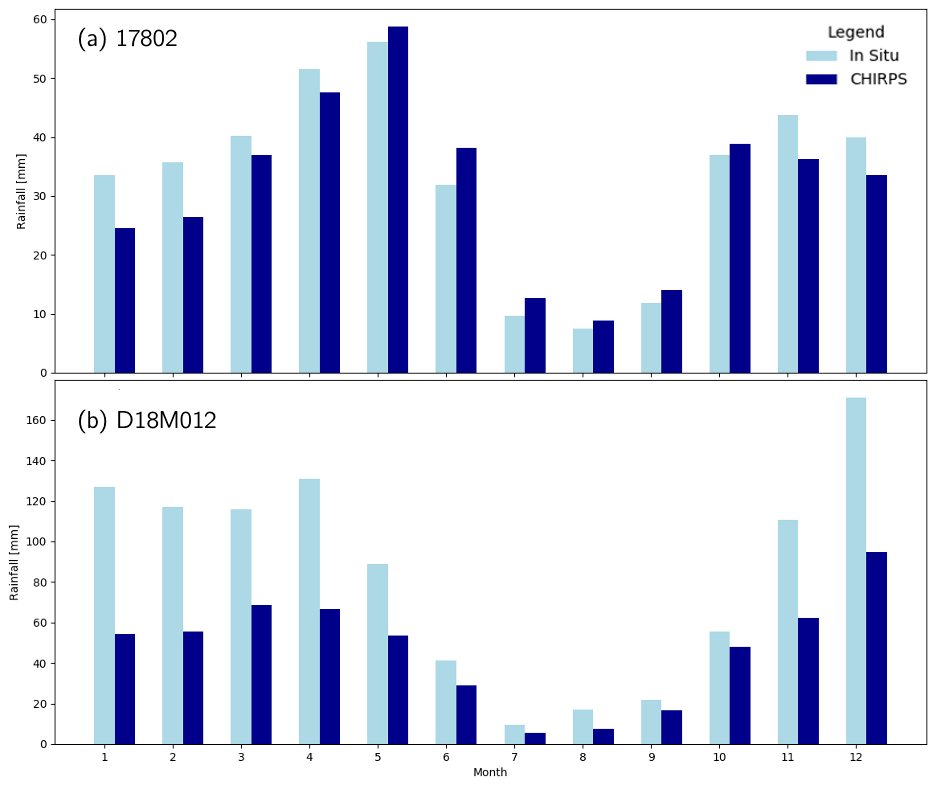
Figure 2Comparison of monthly total precipitation, measured by in-situ stations (light blue) and by CHIRPS (dark blue) at stations 17802 and D18M012.
4.1 Comparison of Precipitation Data
The results of the comparison of monthly precipitation show that the average RMSE is 39 mm/month with a standard deviation of 17 mm/month. CHIRPS performs best in estimating in-situ rainfall at stations 17802 and 17837 (Fig. 2a) with a RMSE of 14 and 15 mm/month respectively. It performs worst at station D18M012 with a monthly RMSE of 72 mm (Fig. 2b). Generally, CHIRPS overestimates precipitation at the majority of stations. In higher altitudes, however, CHIRPS underestimates precipitation for most of the year, likely due to its limited capability to detect snowfall. However, CHIRPS largely succeeds in reflecting the distribution, if not the exact values, of precipitation.
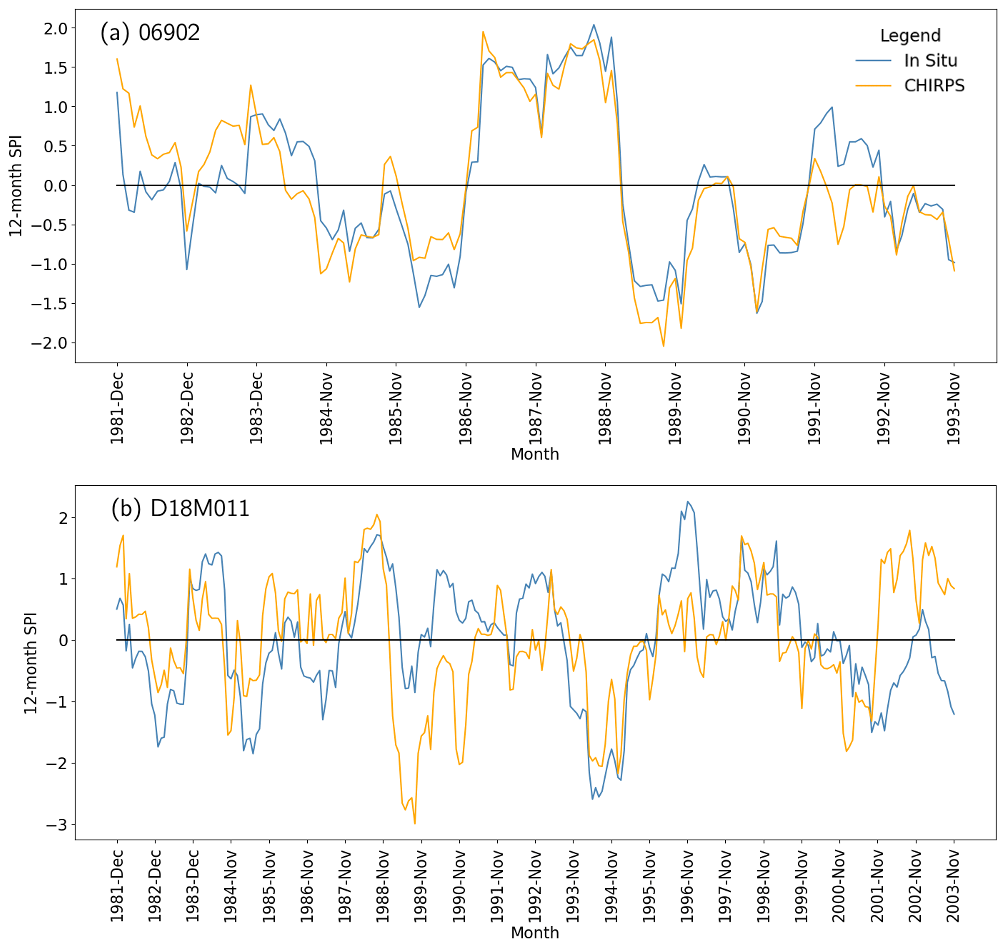
Figure 3Comparison of SPI-12 values at the best- and worst-performing stations in terms of RMSE.
In addition, there are no significant correlations between the RMSE characterizing the disagreement between CHIRPS and in-situ data in terms of the length of the in-situ time series or of station elevation.
4.2 Comparison of SPI Values
The minimum, average, and maximum RMSE, as well as the standard deviation of each SPI (1–24) were calculated (Table 1). The results show significant deviations between each of the SPI values calculated using CHIRPS and using in-situ data. The longer the period over which the SPI is calculated, the smaller the minimum RMSE, but the larger the maximum RMSE and the standard deviation. The best overall agreement can be found for SPI1 with an average RMSE of 0.765 and a standard deviation of 0.088.
Average RMSE values vary considerably between stations, with stations at which CHIRPS performed well in accurately representing precipitation amounts not necessarily showing the lowest RMSE values. The station whose CHIRPS-derived SPI values most closely match the values calculated using in-situ data is 06902 (RMSE = 0.517). The one with the largest RMSE is D18M011 (RMSE = 1.040). Figure 3 shows the SPI12 for these two stations with the best and worst agreement between SPI values calculated from CHIRPS data and those derived from in-situ data. The graphs show that even for stations where the disagreement between absolute SPI values is large enough to result in high RMSE values, the general temporal dynamics of SPI values are similar.
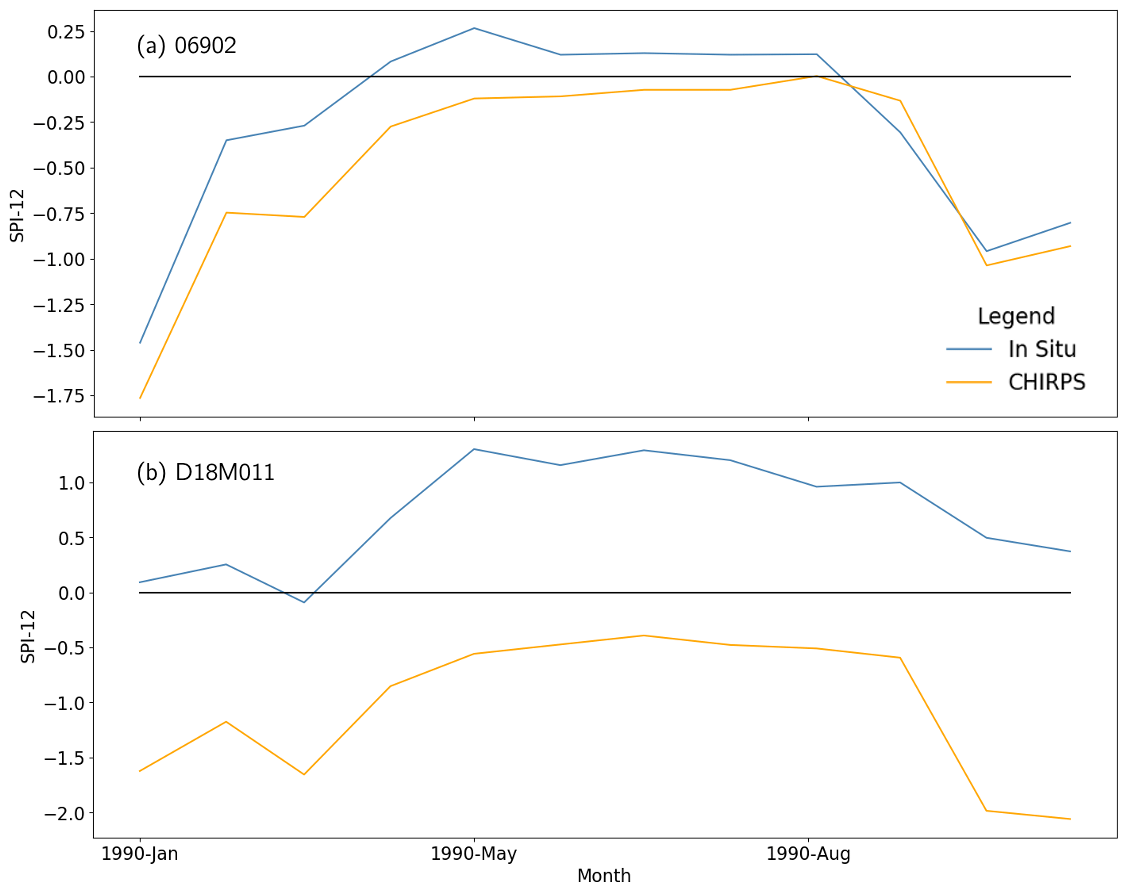
This parallel behaviour is particularly apparent when taking a closer look at the more in-depth comparison of SPI during the drought year 1990 (Fig. 4). A synchronistic tendency can be observed at both stations. At D18M011, the dynamics of the values calculated from CHIRPS closely mirror those calculated from in-situ data, even though there is a fundamental disagreement over whether the SPI itself is positive or negative. The situation for station 06902 is similar, though the overall difference between the two values is much smaller.
Finally, as with the precipitation data, there is no significant correlation between the RMSE and station elevation or the length of the respective time series. No significant differences were observed depending on whether the full time series was used for each data set, or the concordant time series.
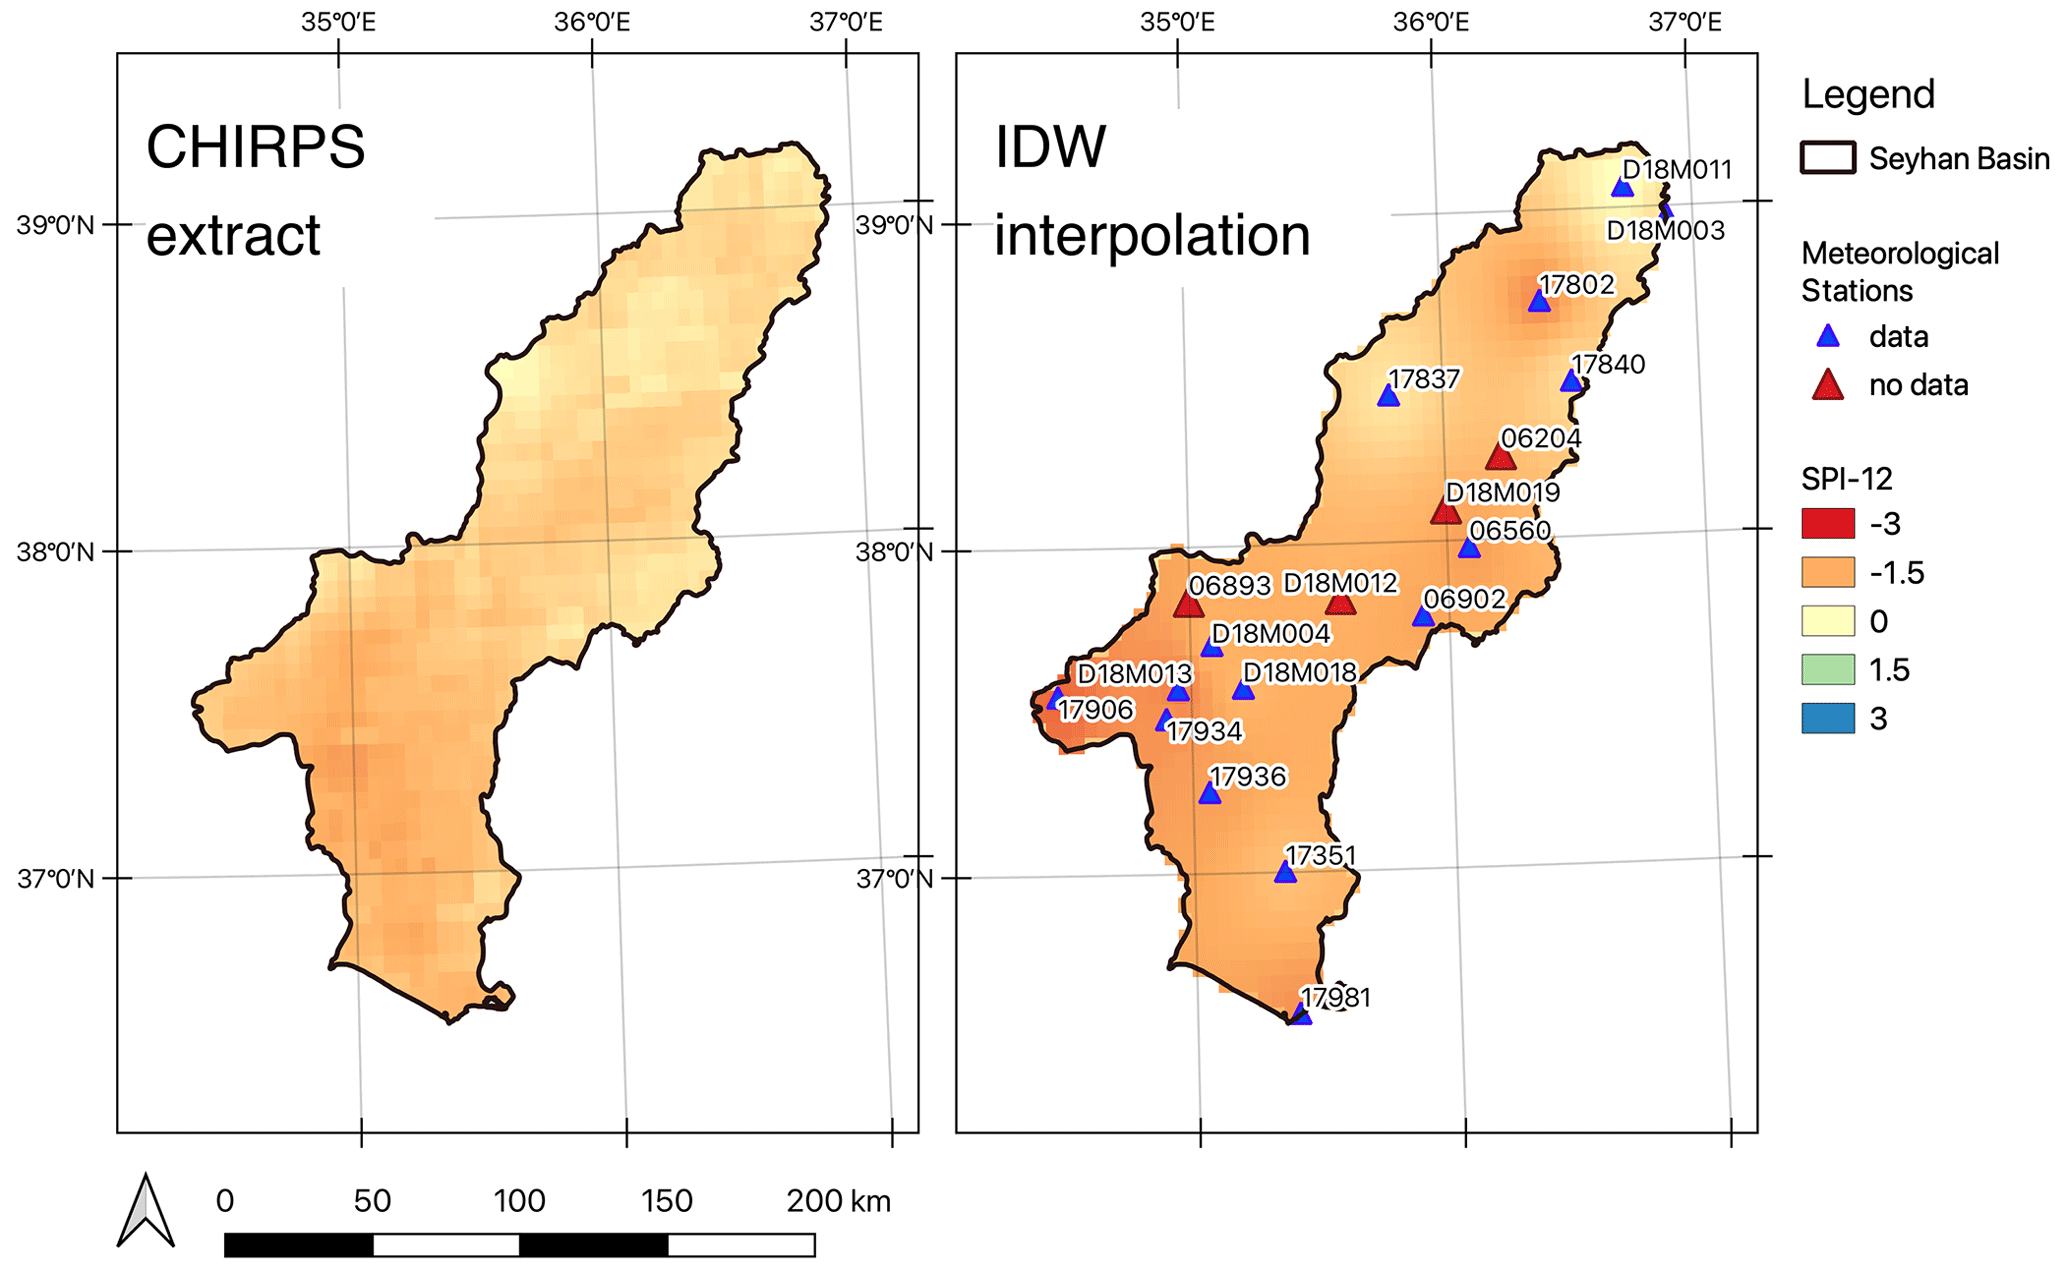
Figure 5Spatial comparison of SPI-12 for January 1990.
4.3 Comparison of Spatial SPI Distribution
The spatial comparison between a pixel-wise CHIRPS extract of SPI12 values for the drought year 1990 and a raster calculated using IDW interpolation from in-situ data shows widespread agreement (Fig. 5). The interpolation captures the general spatial distribution of SPI, though the absolute values differ slightly from the ones calculated from CHIRPS. One notable deviation can be seen in the north of the case study area, where station 17802 registers a far larger precipitation deficit than CHIRPS. This is reflected in the surrounding pixels, with the interpolated map showing a SPI hotspot, while the map extracted from CHIRPS actually shows lower SPI values than surrounding areas.
The analysis of precipitation values shows that the agreement between CHIRPS-derived precipitation values and those measured in-situ varies considerably between stations. Some tendencies that could be observed, such as the trend towards underestimating precipitation in elevated areas that likely experience snowfall, have been observed in previous, targeted studies (e.g. Bai et al., 2018). However, the high individual variations suggest that other variables also contribute towards the deviations, such as local terrain effects and storm paths. This merits further investigation.
With regard to the SPI, the temporal and spatial dynamics derived from CHIRPS and in-situ data exhibit strong parallelisms, but the RMSE between values is considerable for all SPI intervals and all stations. Even where RMSEs are relatively low, there is still occasionally a fundamental disagreement over whether the SPI is in the positive or negative range (Fig. 4b). It must also be highlighted that the stations at which RMSEs are lowest for the precipitation data are not the same that exhibit the lowest RMSEs for the SPI. This indicates that for the calculation of the SPI, the deviance from the observed norm and thus the overall consistency is more important than the absolute agreement between monthly precipitation values.
Finally, it must be noted that even though the precipitation measurements extracted from CHIRPS don't succeed completely in capturing the values of in-situ stations or generating the same SPI, they still hold the merit of providing a consistent time series. This is illustrated well in Fig. 5, which shows that only 15 out of 19 stations provided sufficient data for the calculation of SPI12 at this time point.
This study has largely answered all three research questions outlined in the introduction. We can assert that the capacity of CHIRPS to estimate in-situ precipitation in the Seyhan Basin varies considerably between stations, with some monthly RMSEs being as low as 14 mm and as high as 72 mm. It can be noted that CHIRPS-derived SPIs are capable of representing the dynamics of the drought index, but not its absolute value – both in terms of spatial and temporal variability. The SPI map extracted from CHIRPS offers little additional information in comparison to the one generated from in-situ information, at least for the year 1990.
In terms of future perspectives, it would be interesting to investigate what role local terrain effects and storm paths play in the deviation of in-situ and CHIRPS values. Furthermore, an interesting prospect is offered by the possibility of adding other remotely sensed precipitation datasets to the comparison, such as data from the Tropical Rainfall Measuring Mission (TRMM).
The data are available upon request to the corresponding author.
CO extracted the CHIRPS data from Google Earth Engine, performed the statistical comparison between datasets, and wrote the first draft of the paper. YC provided the station-based dataset, contributed to the development of the methodology, and provided extensive revisions for the first and second drafts of the paper.
The contact author has declared that neither of the authors has any competing interests.
Publisher’s note: Copernicus Publications remains neutral with regard to jurisdictional claims in published maps and institutional affiliations.
This article is part of the special issue “IAHS2022 – Hydrological sciences in the Anthropocene: Variability and change across space, time, extremes, and interfaces”. It is a result of the XIth Scientific Assembly of the International Association of Hydrological Sciences (IAHS 2022), Montpellier, France, 29 May–3 June 2022.
The second author is supported by the DAAD “Research Grants – Bi-nationally Supervised Doctoral 454 Degrees/Cotutelle” Program in the University of Freiburg, for which is the second author is thankful.
This paper was edited by Christophe Cudennec and reviewed by Mohammad Merheb and one anonymous referee.
Bai, L., Shi, C., Li, L., Yang, Y., and Wu, J.: Accuracy of CHIRPS Satellite-Rainfall Products over Mainland China, Remote Sens., 10, 362, https://doi.org/10.3390/rs10030362, 2018.
Cavus, Y. and Aksoy, H.: Spatial drought characterization for Seyhan River basin in the Mediterranean region of Turkey, Water, 11, 1331, https://doi.org/10.3390/w11071331, 2019.
Funk, C. C., Peterson, P. J., Landsfeld, M. F., Pedreros, D. H., Verdin, J. P., Rowland, J. D., Romero, B. E., Husak, G. J., Michaelsen, J. C. and Verdin, A. P.: A quasi-global precipitation time series for drought monitoring, US Geological Survey data series, 832, 1–12, https://doi.org/10.3133/ds832, 2015.
Gorelick, N., Hancher, M., Dixon, M., Ilyushchenko, S., Thau, D., and Moore, R.: Google Earth Engine: Planetary-scale geospatial analysis for everyone, Remote Sens. Environ., 202, 18–27, https://doi.org/10.1016/j.rse.2017.06.031, 2017.
McKee, T. B., Doesken, N. J., and Kleist, J.: The relationship of drought frequency and duration to time scales, in: Proceedings of the 8th Conference on Applied Climatology, 17, 179–183, 1993.