the Creative Commons Attribution 4.0 License.
the Creative Commons Attribution 4.0 License.
 | 18 Apr 2024
Comparative study from ground-based rain gauges vs. rainfall products at different time steps in the southeast of the Republic of Djibouti
Golab Moussa Omar
Jean-Emmanuel Paturel
Christian Salles
Gil Mahé
Mohamed Jalludin
Frédéric Satgé
Mohamed Ismail Nour
Abdillahi Hassan Hersi
The Republic of Djibouti is a small country in the Horn of Africa and as for most regions of Africa, ground rainfall stations are sparse. This study aims to compare at different time steps (annual, monthly, and daily) 15 rainfall estimation products (P-datasets) to 5 reference ground-based rainfall stations, over the period of 1980–1990. To classify the reliability of these products, several metrics were considered, the Kling Gupta Efficiency (KGE) and the Heidle Skills Scores (HSS at daily time step). For the study area, 5 P-datasets present high KGE values at annual and monthly time step: EWEMBI, GPCC, JRA-55 Adj, MSWEP and WFDEI-GPCC; the best 5 performing products at daily time step are CHIRPS, EWEMBI, JRA-55 Adj, MSWEP and WFDEI-GPCC. To complete this comparative analysis, it will be necessary to perform an analysis at the watershed scale and on a new temporal window.
- Article
(1821 KB) - Full-text XML
- BibTeX
- EndNote


UPH 16; field observation; precipitation-datasets; Republic of Djibouti
The Republic of Djibouti is a small country (23 200 km2) located in the Horn of Africa and as for most regions of Africa, ground rainfall stations are sparse and unequally distributed.
To palliate the low density of the rainfall observation network in some areas, there are alternative or complementary products we can find on the Web such as rainfall estimate products (P-Datasets). Since the 1980s, these P-Datasets have blossomed and offer interesting opportunities because, usually the dataset is continuous, and spatially available and, rainfall data are assessed at daily or hourly time steps.
We can define three groups of rainfall estimation products according to the input data and rainfall data retrieval process: those based on spatial information from ground measurement points, those based on reanalysis data derived from physical and dynamic models, and those based on satellite information using passive microwave (PMW) and infrared (IR) information (Le Coz and van de Giesen, 2020; Satgé et al., 2020). Lots of combinations of these three groups exist on the WEB.
The objective of this study is to determine which of these rainfall products is the most reliable compared to ground-based rainfall stations for the south-east of Djibouti. The south-east zone concentrates most of the population and economic exchanges between Djibouti and its neighbouring countries. Therefore, our study focuses on this part of the country This study is the first component of a broader work that aims to improve the knowledge and understanding of the hydrological processes involved in the Ambouli basin. The Ambouli basin is one of the country's largest catchments (794 km2) and is of major importance. The Ambouli aquifer is the main source of drinking water for the city of Djibouti. The Ambouli basin. is of particular importance for flood risk of the city of Djibouti.
2.1 Study area
The whole territory of the Republic of Djibouti presents an arid tropical climate which is characterized by the irregularity and the weakness of precipitations, by high temperatures during all the year, by the absence of perennial water course and by a very intense evaporation. The climate of the country is characterized by two distinct seasons: a cool season from October to April and a hot season from May to September (Houmed-Gaba, 2009). Due to geology of volcanic origin, the Republic of Djibouti is characterized by a very steep relief which is a succession of massifs, plateaus and plains also represented in the southeastern part (study area).
2.2 Rain gauges
There are 14 rainfall stations in the south-east of the Republic of Djibouti managed by the “Agence Nationale de la Météorologie de Djibouti (ANM)”. Out of 14 stations, only 5 have at least 10 months or more of data available per year. Thus, we use a network of 5 rain gauges: Aerodrome, Serpent, Ali-Sabieh, Hol-Hol and Loyada (Fig. 1). The rainfall data from the network cover the period 1951–1990. The rainfall are at monthly time step for 4 rain gauge stations (Serpent, Ali-Sabieh, Hol-Hol and Loyada) and the Djibouti Aerodrome station is at daily time step (over the period 1981–2020). These rainfall data are regulated by the quality control and quality assurance system of the World Meteorological Organization (WMO).

Figure 1Location of the study area and rain gauge stations.
2.3 P-Datasets
Products selection for testing was motivated by their availability over the region of interest and as they are commonly used in operational or research studies focusing on hydrology or agronomy. Table 1 presents temporal and spatial characteristics of the P-Datasets.
Table 1Main characteristics of the P-datasets – S = satellite, R = reanalysis and G = gauge information. Spatial coverage refers to the absolute maximum and minimum latitude with precipitation information.

This study assesses the performance of 15 precipitation estimation products at daily, monthly, and annual time step against the ground rainfall stations of the south-eastern zone of the Republic of Djibouti.
The prerequisite for the choice of studied period is a shared time window between P-Datasets and rain gauge data. Since the P-Datasets are only available from the beginning of the 1980's, the common study period is 1980–1990.
The P-Datasets validation is carried out on a spatially aggregated level: point-to-pixel. The grid values of the precipitation estimation products containing each rain gauge station are extracted and pairwise compared.
The performances of P-Datasets were evaluated using the quantitative metrics (KGE and MBE) and categorical indices (POD, FAR, Accuracy, Error and HSS), at annual, seasonal, monthly and daily temporal scale
3.1 Pre-processing (pre-treatment)
As the P-Datasets differ in spatial resolution – ranging from 0.0375° for TAMSAT v.3 to 1° for GPCC v.7 – and for easy comparison, the P-Datasets were resampled to a spatial resolution of 0.1° by 0.1° using bilinear interpolation (Nikulin et al., 2012; Akinsanola et al., 2016; Satgé et al., 2020). Moreover, to address the uniformity in the temporal span, the P-Datasets available at a sub-daily time step were aggregated to a daily time step records over the period of study.
3.2 Metrics
The comparative study includes quantitative and categorical metrics. Although wide range of metrics are available to assess data performance (Wang et al., 2003; Segele et al., 2008; Diro et al., 2009; Ayehu et al., 2018), there is no single one that encapsulates all aspects of interest. For this reason, it is useful to consider several metrics and to understand the type of information or insight they might provide (Akinsanola et al., 2016).
3.2.1 Quantitative metrics
The metrics used for the ground to rainfall products statistical comparison are:
-
Kling Gupta Efficiency (KGE) is the Euclidean distance computed using the coordinates of bias (), standard deviation () and correlation coefficient (Gupta et al., 2009; Clark et al., 2021):
-
Mean Bias Eror (MBE) is used to estimate the average bias in the rainfall product, and it provides a good indication of the mean overestimate of predictions. A positive value of MBE means an overestimation:
where x corresponds to the ground reference rainfall and y corresponds to the P-Datasets.
3.2.2 Categorical metrics
The performances of rainfall estimate products are also analyzed using a, b, c and d categorical indices. Five statistical indicators based on a contingency table (Table 2) are computed:
-
Probability of detection (POD):
-
False Alarm Ratio:
-
Accuracy:
-
Error
-
Heidle Skill Scores
Table 2Contingency table used for the categorical statistical analysis of rainfall.

4.1 Annual Comparisons (Fig. 2)
Strong agreement with the rain gauge data is observed for some of the P-datasets. Five P-Datasets have a high KGE – EWEMBI, GPCC, JRA_55_Adj, MSWEP and WFDEI_GPCC. WFDEI_GPCC is the best P-Datasets whereas MERRA-2 PTC and ERA 5 had the worst performance.
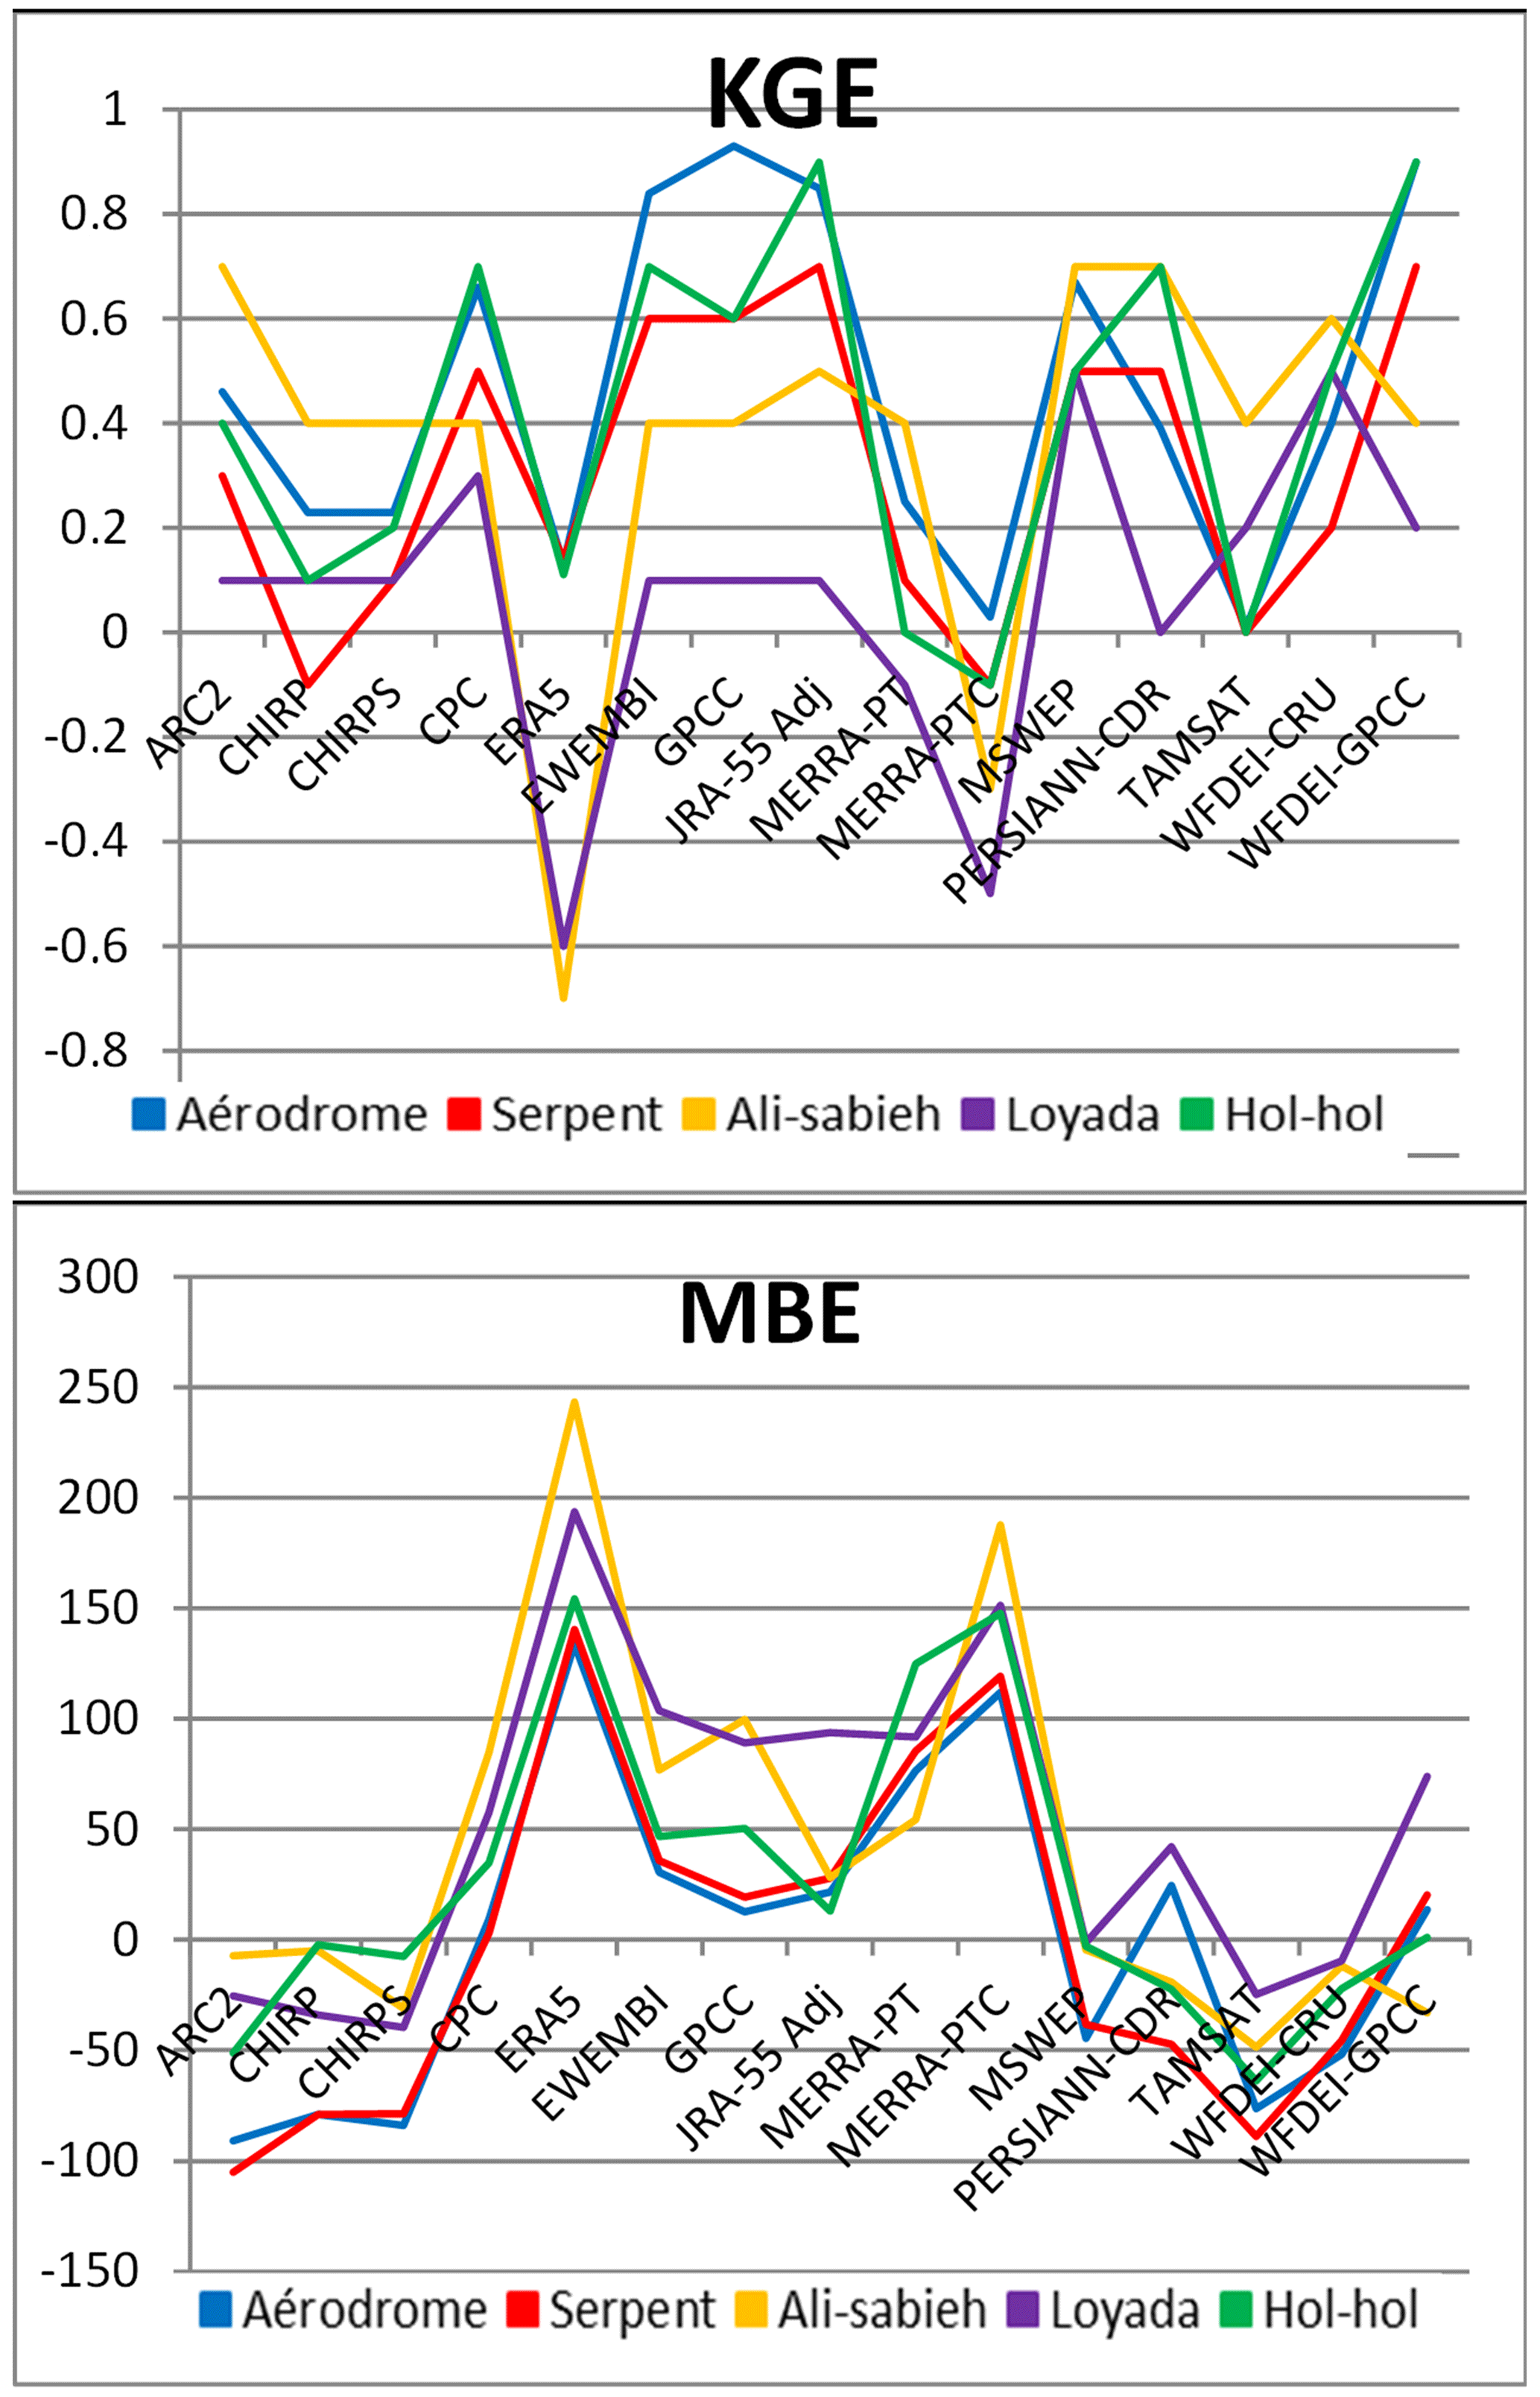
Figure 2Statistical validation of rainfall products for rain gauge stations in the south-eastern part of the Republic of Djibouti, at annual time step for the period 1980–1990.
Eight of rainfall estimates products – CPC, ERA5, EWEMBI, GPCC, JRA-55_Adj, MERRA-2_PT, MERRA-2_PTC and WFDEI_GPCC – overestimated rainfall with positive MBE values.
Loyada rain gauge has the lowest KGE except for the rainfall estimation products TAMSAT and WFDEI_CRU. This can be explained either by the location of the station or the digitalization of the data (because it is a manual rain gauge station, when data are collected and then they are digitalized by a technician which can generate an uncertainty.
4.2 Monthly comparisons (Table 3)
Regarding the KGE, all P-Datasets systematically present values within −0.16 and 0.70 which is much more efficient than the annual time step. The top five P-Datasets at monthly time step are the same as those at annual time step: EWEMBI, GPCC, JRA-55_Adj, MSWEP and WFDEI_GPCC. WFDEI_GPCC is always the best among these fives. As for the annual time step, MERRA-2 PTC corresponds to the least reliable P-Dataset.

Table 4Quantitative (KGE to MBE column) and categorical (POD to HSS column) statistical indicators at daily time step at Djibouti aerodrome station.
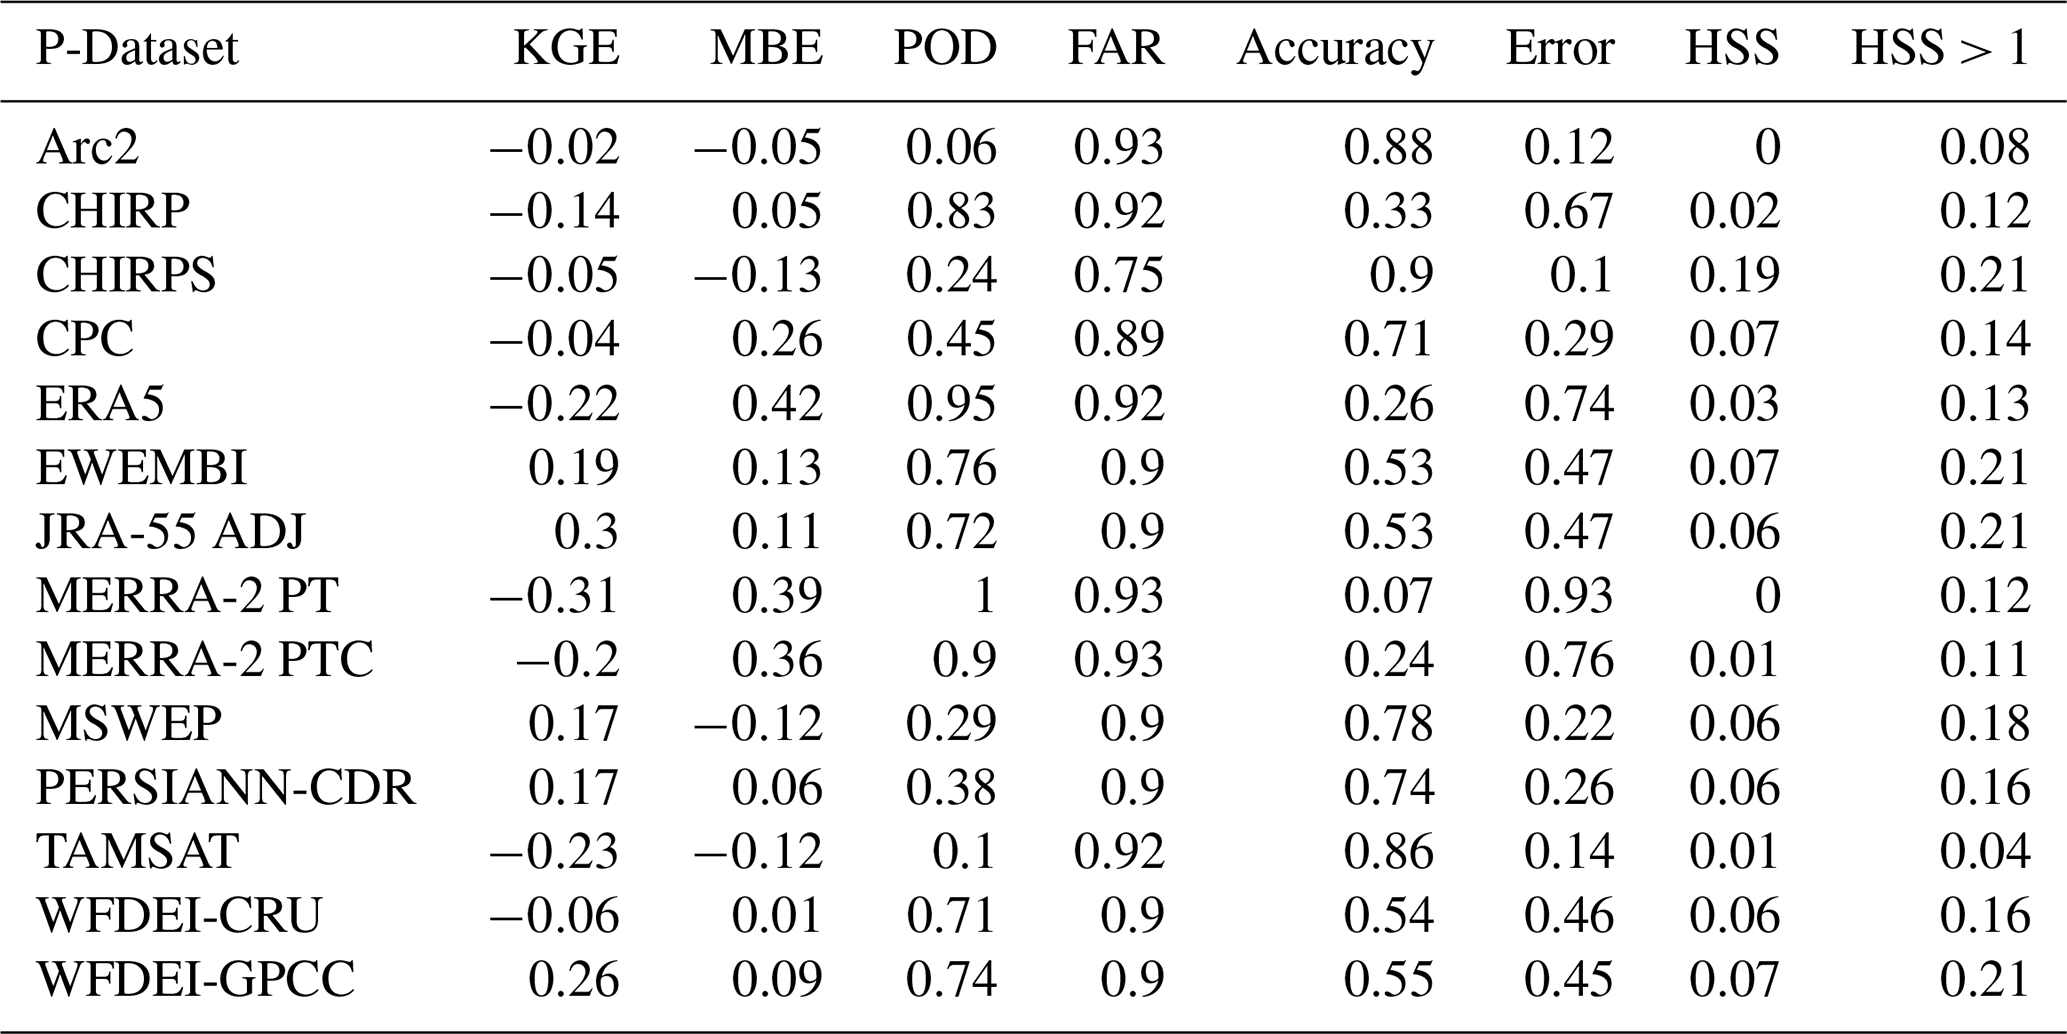
4.3 Daily comparisons (Table 4)
For the daily time step analyses, we use data from Djibouti Aerodrome station for the period 1981–2005 which is the common period between the station and all the P-Datasets. The GPCC product is not present in the analysis of daily time step data because it has a monthly temporal resolution.
The ability of the P-Datasets to quantify the amount of daily precipitation is relatively low, with most products having negative KGE values (Table 4). Only the best performing products at the annual and monthly time step EWEMBI, JRA-55_Adj, MSWEP v.2.2, and WFDEI_GPCC have positive KGE values. Concerning MBE, values are relatively homogeneous for all products from −0.13 to 0.42 mm. The low value of MBE is due to the low number of rainy days.
Table 4 shows the results of the POD, FAR, Accuracy, Error and HSS indices. Regarding POD, the P-Datasets MERRA-2 (PT and PTC) and ERA5 (the worst performing products at annual and monthly time step) almost do not detect non-rainy days, which explain the almost perfect POD values for these products. EWEMBI, JRA-55 Adj, and WFDEI-GPCC (the best performing products at the annual and monthly time step) show POD values <0.7. Regarding FAR, we observe relatively low values for the products (FAR > 0.9 except for CHIRPS which presents a FAR equal to 0.75). For the Accuracy and Error indices, the results are moderately satisfactory for most of the products; however, as for the FAR values, the CHIRPS product presents the best Accuracy and Error values, respectively 0.9 and 0.1.
Satgé et al. (2020), defined a non-rainy day using several threshold values ranging from 0 to 25 mm were applied for the P-Datasets. They found that maximum value of HSS was obtained with a threshold value of 1 mm. We consider the same threshold of 1 mm and observe that “HSS > 1 mm” are higher than “HSS” for all the P-Datasets. The best performing P-Datasets in terms of “HSS > 1 mm” are the same as at the annual and monthly time step (EWEMBI, JRA-55 Adj, MSWEP and WFDEI-GPCC) with the addition of CHIRPS.
Quantitative and categorical metrics allow us to determine which of the P-Datasets is the most reliable to reproduce the rainfall amounts measured by a 5 rain gauge network regulated by the quality control and quality assurance system of the World Meteorological Organization (WMO) over the south-east of Republic of Djibouti. For the annual and monthly time step, the KGE is used for the product rankings. For the daily time step, we add to KGE a categorical index, the HSS performance index, which allows us to assess the ability of these products to detect rainfall events.
For our study area, five P-Datasets present high KGE values at annual and monthly time step: EWEMBI, GPCC, JRA-55 Adj, MSWEP and WFDEI-GPCC. Therefore, the best performing products at the daily time step are CHIRPS, EWEMBI, JRA-55 Adj, MSWEP and WFDEI-GPCC.
To complete this first study, and to deepen the knowledge concerning the Ambouli basin, it would be necessary to carry out a comparative analysis at the basin scale and use another temporal window to validate the reliability of these products.
The data used are from the databases of the Centre d'Etudes et de Recherches de Djibouti (CERD) and the Agence Météorologique Nationale (ANM) are available on request from these institutions. Concerning the data of the rainfall estimation products, they are available in the official sites of the rainfall products mentioned in Table 1.
GMO did the methodology, data collection, data analysis, writing and editing. JEP did the methodology, data analysis, writing/reviewing and editing. CS did the methodology, data analysis, writing and editing. GM did the methodology, data analysis, writing and editing. MJ did the data analysis, review writing and editing. FS did the methodology and data collection. MIN did the data collection. AHH did the data collection.
The contact author has declared that none of the authors has any competing interests.
Publisher’s note: Copernicus Publications remains neutral with regard to jurisdictional claims in published maps and institutional affiliations.
This article is part of the special issue “IAHS2022 – Hydrological sciences in the Anthropocene: Variability and change across space, time, extremes, and interfaces”. It is a result of the XIth Scientific Assembly of the International Association of Hydrological Sciences (IAHS 2022), Montpellier, France, 29 May–3 June 2022.
This paper was edited by Christophe Cudennec and reviewed by two anonymous referees.
Akinsanola, A. A., Ogunjobi, K. O., Ajayi, V. O., Adefisan, E. A., Omotosho, J. A., and Sanogo, S.: Comparison of five gridded precipitation products at climatological scales over West Africa Comparison of five gridded precipitation products at climatological scales over West Africa, Meteorol. Atmos. Phys., 129, 669–689, https://doi.org/10.1007/s00703-016-0493-6, 2016.
Ayehu, G. T., Tadesse, T., Gessesse, B., and Dinku, T.: Validation of new satellite rainfall products over the Upper Blue Nile Basin, Ethiopia, Atmos. Meas. Tech., 11, 1921–1936, https://doi.org/10.5194/amt-11-1921-2018, 2018.
Clark, M. P., Vogel, R. M., Lamontagne, J. R., Mizukami, N., Knoben, W. J. M., Tang, G., Gharari, S., Freer, J. E., Whitfield, P. H., Shook, K. R., and Papalexiou, S. M.: The abuse of popular performance metrics in hydrologic modeling, Water Resour. Res., 57, e2020WR029001, https://doi.org/10.1029/2020WR029001, 2021.
Diro, G. T., Grimes, D. I. F., Black, E., O'Neill, A., and Pardo-Iguzquiza, E.: Evaluation of reanalysis rainfall estimates over Ethiopia, Int. J. Climatol., 29, 67–78, https://doi.org/10.1002/joc.1699, 2009.
Gupta, H. V., Kling, H., Yilmaz, K. K., and Martinez, G. F.: Decomposition of the mean squared error and NSE performance criteria: Implications for improving hydrological modelling, J. Hydrol., 377, 80–91, https://doi.org/10.1016/j.jhydrol.2009.08.003, 2009.
Houmed-Gaba, A.: Hydrogéologie des milieux volcaniques sous climat aride. Caractérisation sur site expérimental et modélisation numérique de l'aquifère basaltique de Djibouti (Corne de l'Afrique), PhD thesis, University of Poitiers, Poitiers, France, 220 pp., 2009.
Le Coz, C. and van de Giesen, N.: Comparison of rainfall products over sub-saharan africa, J. Hydrometeorol., 21, 553–596, 2020.
Nikulin, G., Jones, C., Giorgi, F., Asrar, G., Buchner, M., Cerezo-Mota, R., Christensen, O. B., Deque, M., Fernandez, J., Hansler, A., van Meijgaard, E., Samuelsson, P., Sylla, M. B., and Sushama, L.: Precipitation climatology in an ensemble of CORDEX-Africa regional climate simulations, J. Climate, 25, 6057–6078, 2012.
Satgé, F., Defrance, D., Sultan, B., Bonnet, M.-P., Seyler, F., Rouché, N., Pierron F., and Paturel, J.-E.: Evaluation of 23 gridded precipitation datasets across West Africa, J. Hydrol., 581, 124412, https://doi.org/10.1016/j.jhydrol.2019.124412, 2020.
Segele, Z. T., Leslie, L. M., and Lamb, P. J.: Evaluation and adaptation of a regional climate model for the Horn of Africa: rainfall climatology and interannual variability, Int. J. Climatol., 29, 47–65, https://doi.org/10.1002/joc.1681, 2008.
Wang, Y., Sen, O. L., and Wang, B.: A highly resolved regional climate model (IPRC-RegCM) and its simulation of the 1998 severe precipitation event over China. Part I: model description and verification of simulation, J. Climate, 16, 1721–1736, 2003.