the Creative Commons Attribution 4.0 License.
the Creative Commons Attribution 4.0 License.
 | 18 Apr 2024
Analysis of high-resolution rain records in FVG, northeastern Italy
Dario Treppiedi
Leonardo Valerio Noto
The Friuli Venezia Giulia (FVG) region, northeastern Italy, records the heaviest precipitation annual totals of the country. The region counts on a dense ground-station network constituted by 2 main rain-gauges networks, whose sampling frequency has been progressively increased from 60 up to 1 min step. In this work, we propose a comprehensive analysis of the available dataset of continuous series at high temporal resolution (i.e. 60, 30, 5 and 1 min) to verify whether trends in very short rainfalls are underway. We adopt the quantile regression (QR) method which allows to detect changes in the tails of the rainfall distributions and to screen the whole rainfall time series. At this aim, we first introduce a method to check and correct the continuous series by removing the suspicious outliers, based on references values. Significant increasing trends at 5 % of significant level have been detected on some of the analysed stations.
- Article
(3386 KB) - Full-text XML
- BibTeX
- EndNote


Field observation; new monitoring; high-resolution records; UPH 1; SDG 13.3.
Rainfall observations are among the most important input data for the hydrological and geomorphological modelling. Depending on the physical process being simulated, an appropriate spatial and temporal resolution of data must be used. Temporal variability of rainfall is one of the main source of uncertainty in hydrological simulation and flood forecasting (Huang et al., 2019). Specifically, temporal variability becomes important when dealing with urban hydrology (Berne et al., 2004), very small mountain catchments, rainfall-driven geomorphic processes such as erosion, debris flow or shallow landslides. In fact, from a modelling perspective, it has been demonstrated that model performance as well as values of the calibrated parameters can significantly vary the at different temporal rain data resolutions (Wang and Takase, 2009).
From a statistical perspective, many works in literature analyse time series of rainfall and rainfall-derived indices in order to assess past variability and changes (Caporali et al., 2021 and references therein). Trends in precipitation regimes are commonly assessed in terms of total precipitation or wet days. Whereas with regard to the extreme precipitations, most of the studies investigate changes on annual maxima at 1 h duration or greater (e.g. Arnone et al., 2013). Only a few researches focus on sub-hourly durations (e.g., Treppiedi et al., 2021). The reason is mainly due to the scarce availability of sufficiently long series at such durations. Detecting trend methods such as the widely used non-parametric Mann–Kendall (hereinafter MK) test can be applied to series of annual maxima that are length enough. An alternative method is based on the quantile regression (hereinafter QR) analysis (Koenker, 2005), which performs a linear regression on the continuous data time-series, taking into account those values greater than a selected quantile. The method is more flexible than the MK (Treppiedi et al., 2021, Villarini et al., 2011), however, the drawback is the necessity of continuous data.
The region of Friuli Venezia Giulia (FVG), in the northeastern Italy, records the heaviest precipitation annual totals in the country. Due to the complex orography and other prone factors, effects of both prolonged and extreme precipitation is particularly damaging (Arnone et al., 2023). Additionally, the mountain basins of the Alpine area are characterized by very short time of concentrations, thus short-extreme events are of interest, and rainfall analyses at sub-daily scale could not be appropriate. The region is equipped with rain gauges of recent technology, capable of recording data at a frequency up to 1 min. However, two issues may arise when dealing with such series: (i) quality of the dataset in terms of errors, misreading, equipment malfunction (Huang et al., 2019) and (ii) the length of the time series not sufficiently long for statistical analyses.
To address the above mentioned issues, in this work, we propose: (i) a comprehensive analysis of the dataset at high temporal resolution (i.e. 60, 30, 5 and 1 min) available for the FVG region; (ii) a quality check of the continuous series at 5 min together with a correction method. Finally, in order to verify whether trends in very short rainfall durations are underway, the QR method at different thresholds and durations is applied to the corrected series of a selected locations.
Friuli Venezia Giulia (FVG) is characterized by a complex orography, which includes the plain area of the northern Adriatic Sea (southern side), and the pre-alpine and alpine ridges (Julian and Carnic) on the northern side. The orography controls the mean annual precipitation distribution across the region that ranges from about 950 mm across the plain and coastal area to about 3150 mm across the Prealps (Fig. 1). The maximum total rainfall is recorded in the Julian Prealps, between NE Italy and NW Slovenia. Daily rainfall precipitation may exceed 500 mm in a return period of 20–30 years (Ceshia et al., 1991). In general, the climate is classified as a humid continental climate (i.e., Dfb according to the Köppen climate classification), with warm summer and coldest month with below zero temperatures.
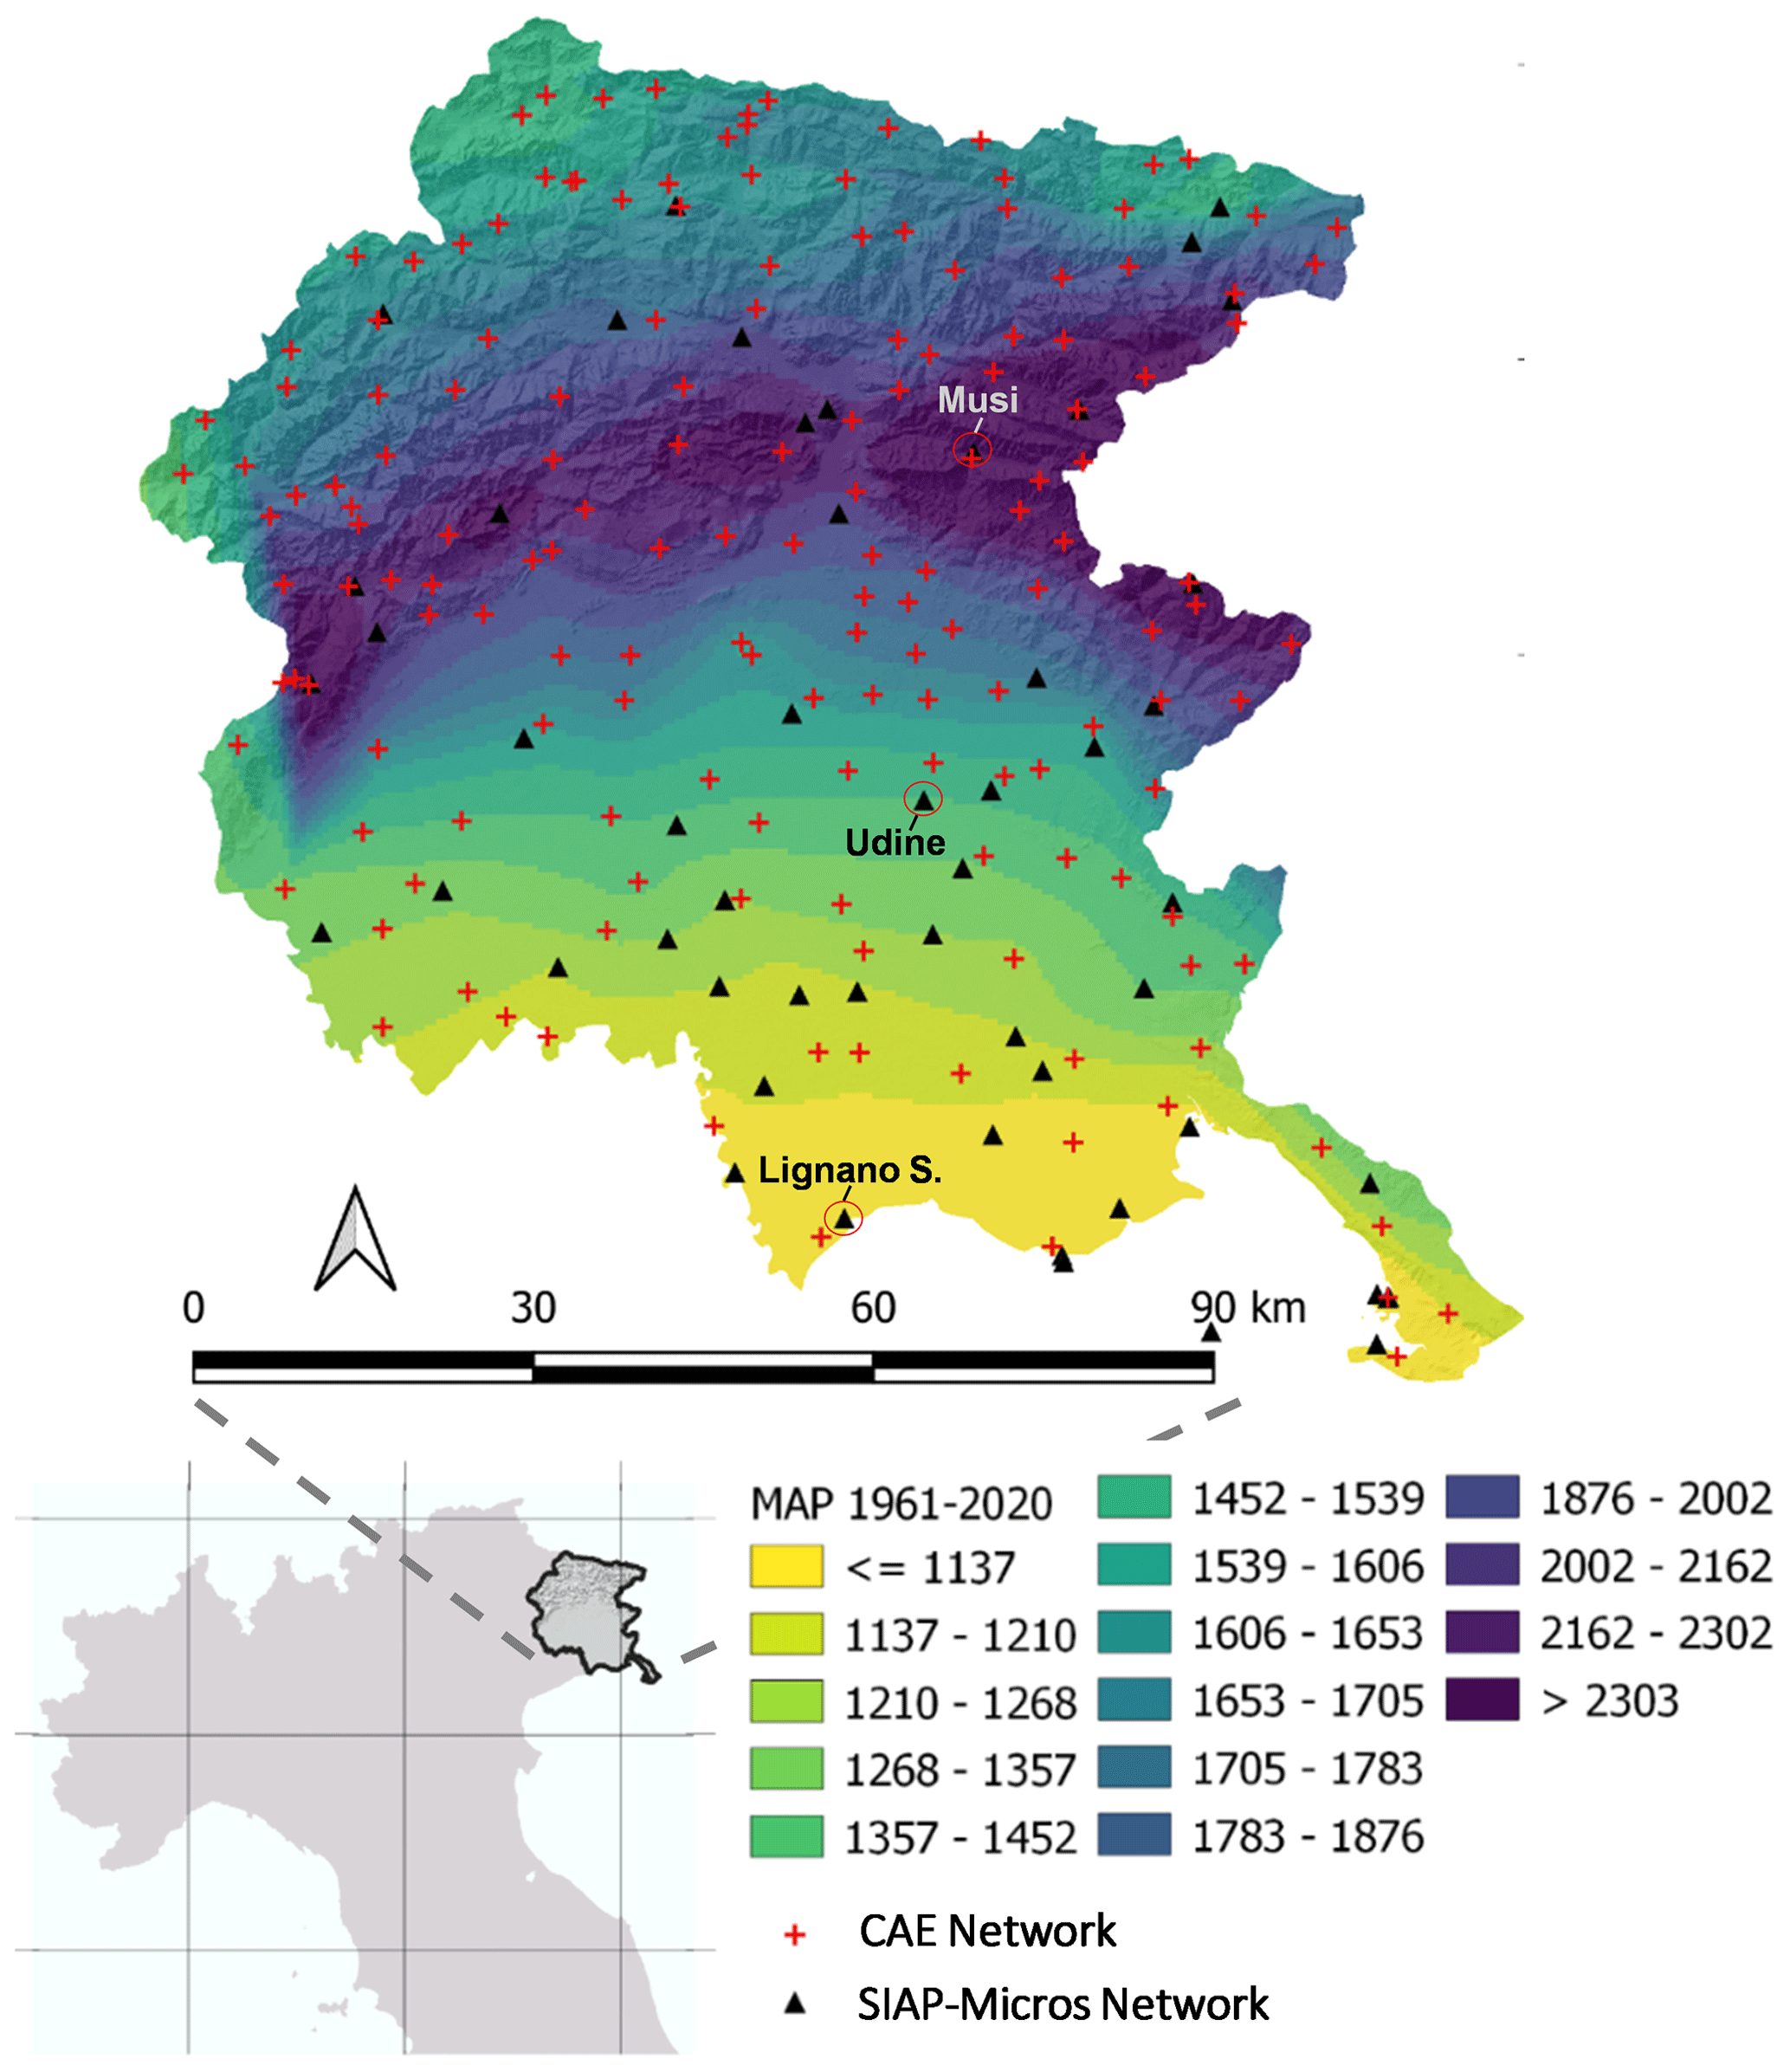
Figure 1Mean Annual Precipitation (MAP) of Friuli Venezia Giulia region (northeastern Italy) and distribution of the two main rain-gauges networks, i.e. CAE and SIAP-Micros.
The ground rain-gauges network of the FVG region consists of more than 200 ground stations, which are all managed by the regional Civil Protection Agency. The entire network is composed mainly by two different series of rain-gauge networks (Fig. 1): (i) the network originally managed by the Hydrographic Operative Unit that is now based on CAE technology and that consists of 162 rain-gauges (hereinafter CAE network); (ii) the network built with the SIAP-Micros hardware technology, which is directly managed by the agency OSMER ARPA-FVG (OSservatorio MEteorologico Regionale-Agenzia Regionale per la Protezione dell'Ambiente) and consists of 46 rain-gauges (hereinafter SIAP-Micros network).
The recording frequency rate varies from 60 to 30, 5 and 1 min, depending on the station and temporal horizon (see Sect. 4.1). However, validated and certified data are guaranteed by the agency only for resolutions equal and greater than 1 h. All data can be retrieved from the OMNIA platform developed by OSMER ARPA-FVG (http://omnia.meteo.fvg.it/, last access: 13 January 2023).
3.1 Trend detection method
The Quantile Regression (QR) method (Koenker, 2005) is an extension of the standard linear regression model that allows to perform a regression on different quantiles instead of only on the mean. While simpler non-parametric tests as the Mann-Kendall (MK) are usually applied to rainfall-derived specific data sets, e.g. the annual maxima, the advantage of the QR is that it provides a more complete view of the statistical properties of a sample, by inspecting at different quantile levels the tail of the rainfall distribution. Differently than the simple linear regression in which the coefficients are evaluated through the least square minimization problem, the QR model is based on a minimization of the sum of the weighted absolute value of a difference between the ith observation (yi) and the τth quantile line at xi (Treppiedi et al., 2021):
The intercept, β0, and the slope, β1 thus depend on the quantile level τ, for any 0<τ<1. Points above the quantile line are weighted by τ, while those below the quantile line are weighted by (1−τ), thus meaning that the greater the considered quantile, the more relevant are points above the quantile line in the evaluation of the slope and intercept of the regression line. The trends significance can be evaluated by means of the Student's t, which is used here to reject the null hypothesis (slope of the quantile line is equal to zero) with a significance level of 5 % and 10 %.
As previously mentioned, differently than the MK test, the QR screens the whole rainfall time series and the trend result could be significantly affected by the presence of outliers in the series, which could be due to errors in recording data.
3.2 Data validation
Rainfall data are first check for consistency in terms of unphysical measurements based on realistic ranges (Dal Gesso et al., 2019). Specifically, the application of the QR method requires a verification mainly oriented to the identification, in the series at high resolution recording rate, of suspicious outliers or recurring values. At this aim, we developed a very simple method of data “check and cleaning” which is based on the comparison with the verified series provided by the agency.
Given a series at sub-hourly recording frequency rate, fr, this is first aggregated at the resolution of the validated series, i.e. 60 min. Let us name as A(fr) the aggregated series from the original recorded data and as R(60) the validated series at 60 min considered here as reference and as not affected by errors. The two series are compared at each temporal step, and the following conditions could apply:
-
Perfect agreement between the two values, i.e. A(fr)=R(60);
-
No-data value either in A(fr) or in R(60) series;
-
Mismatching between A(fr) and R(60) values, with A(fr)>R(60); let us label this error as Mismatch I;
-
Mismatching between A(fr) and R(60) values, with A(fr)<R(60); let us label this error as Mismatch II.
No-data values (condition 2) are discarded. Values of Mismatch I (condition 3) must be considered as certain errors given that they do not find confirmation in the reference series and, above all, they could significantly affect the results of the QR at high quantile levels. Values of Mismatch II (condition 4) provide an underestimation of the confirmed values at 60 min. However, including them in the final series would not invalidate the analysis of the tail of rainfall distribution.
The identified outliers and errors are thus discarded from the aggregated series, and then the series at the original frequency rate is cleaned-up. Consistency in space through the measurements of the nearest neighbour stations is not checked-up. However, this is done for the validation of the reference series (ARPA-FVG, 2021).
4.1 Dataset screening
Figure 2 shows the temporal horizon and the recording frequency rate of the working rain-gauges for the two networks. The CAE network records continuously mostly from 2004, with a frequency rate of 30 min for most of the rain-gauges (Fig. 2a, blue bars). The recording frequency has been progressively increased up to 1 min around the 2010s for both new gauges or existed ones. Up to today, the 68 % of the rain-gauges records at 1 min and the 4 % has a continuous record length of at least almost 20 years (2002–2022).
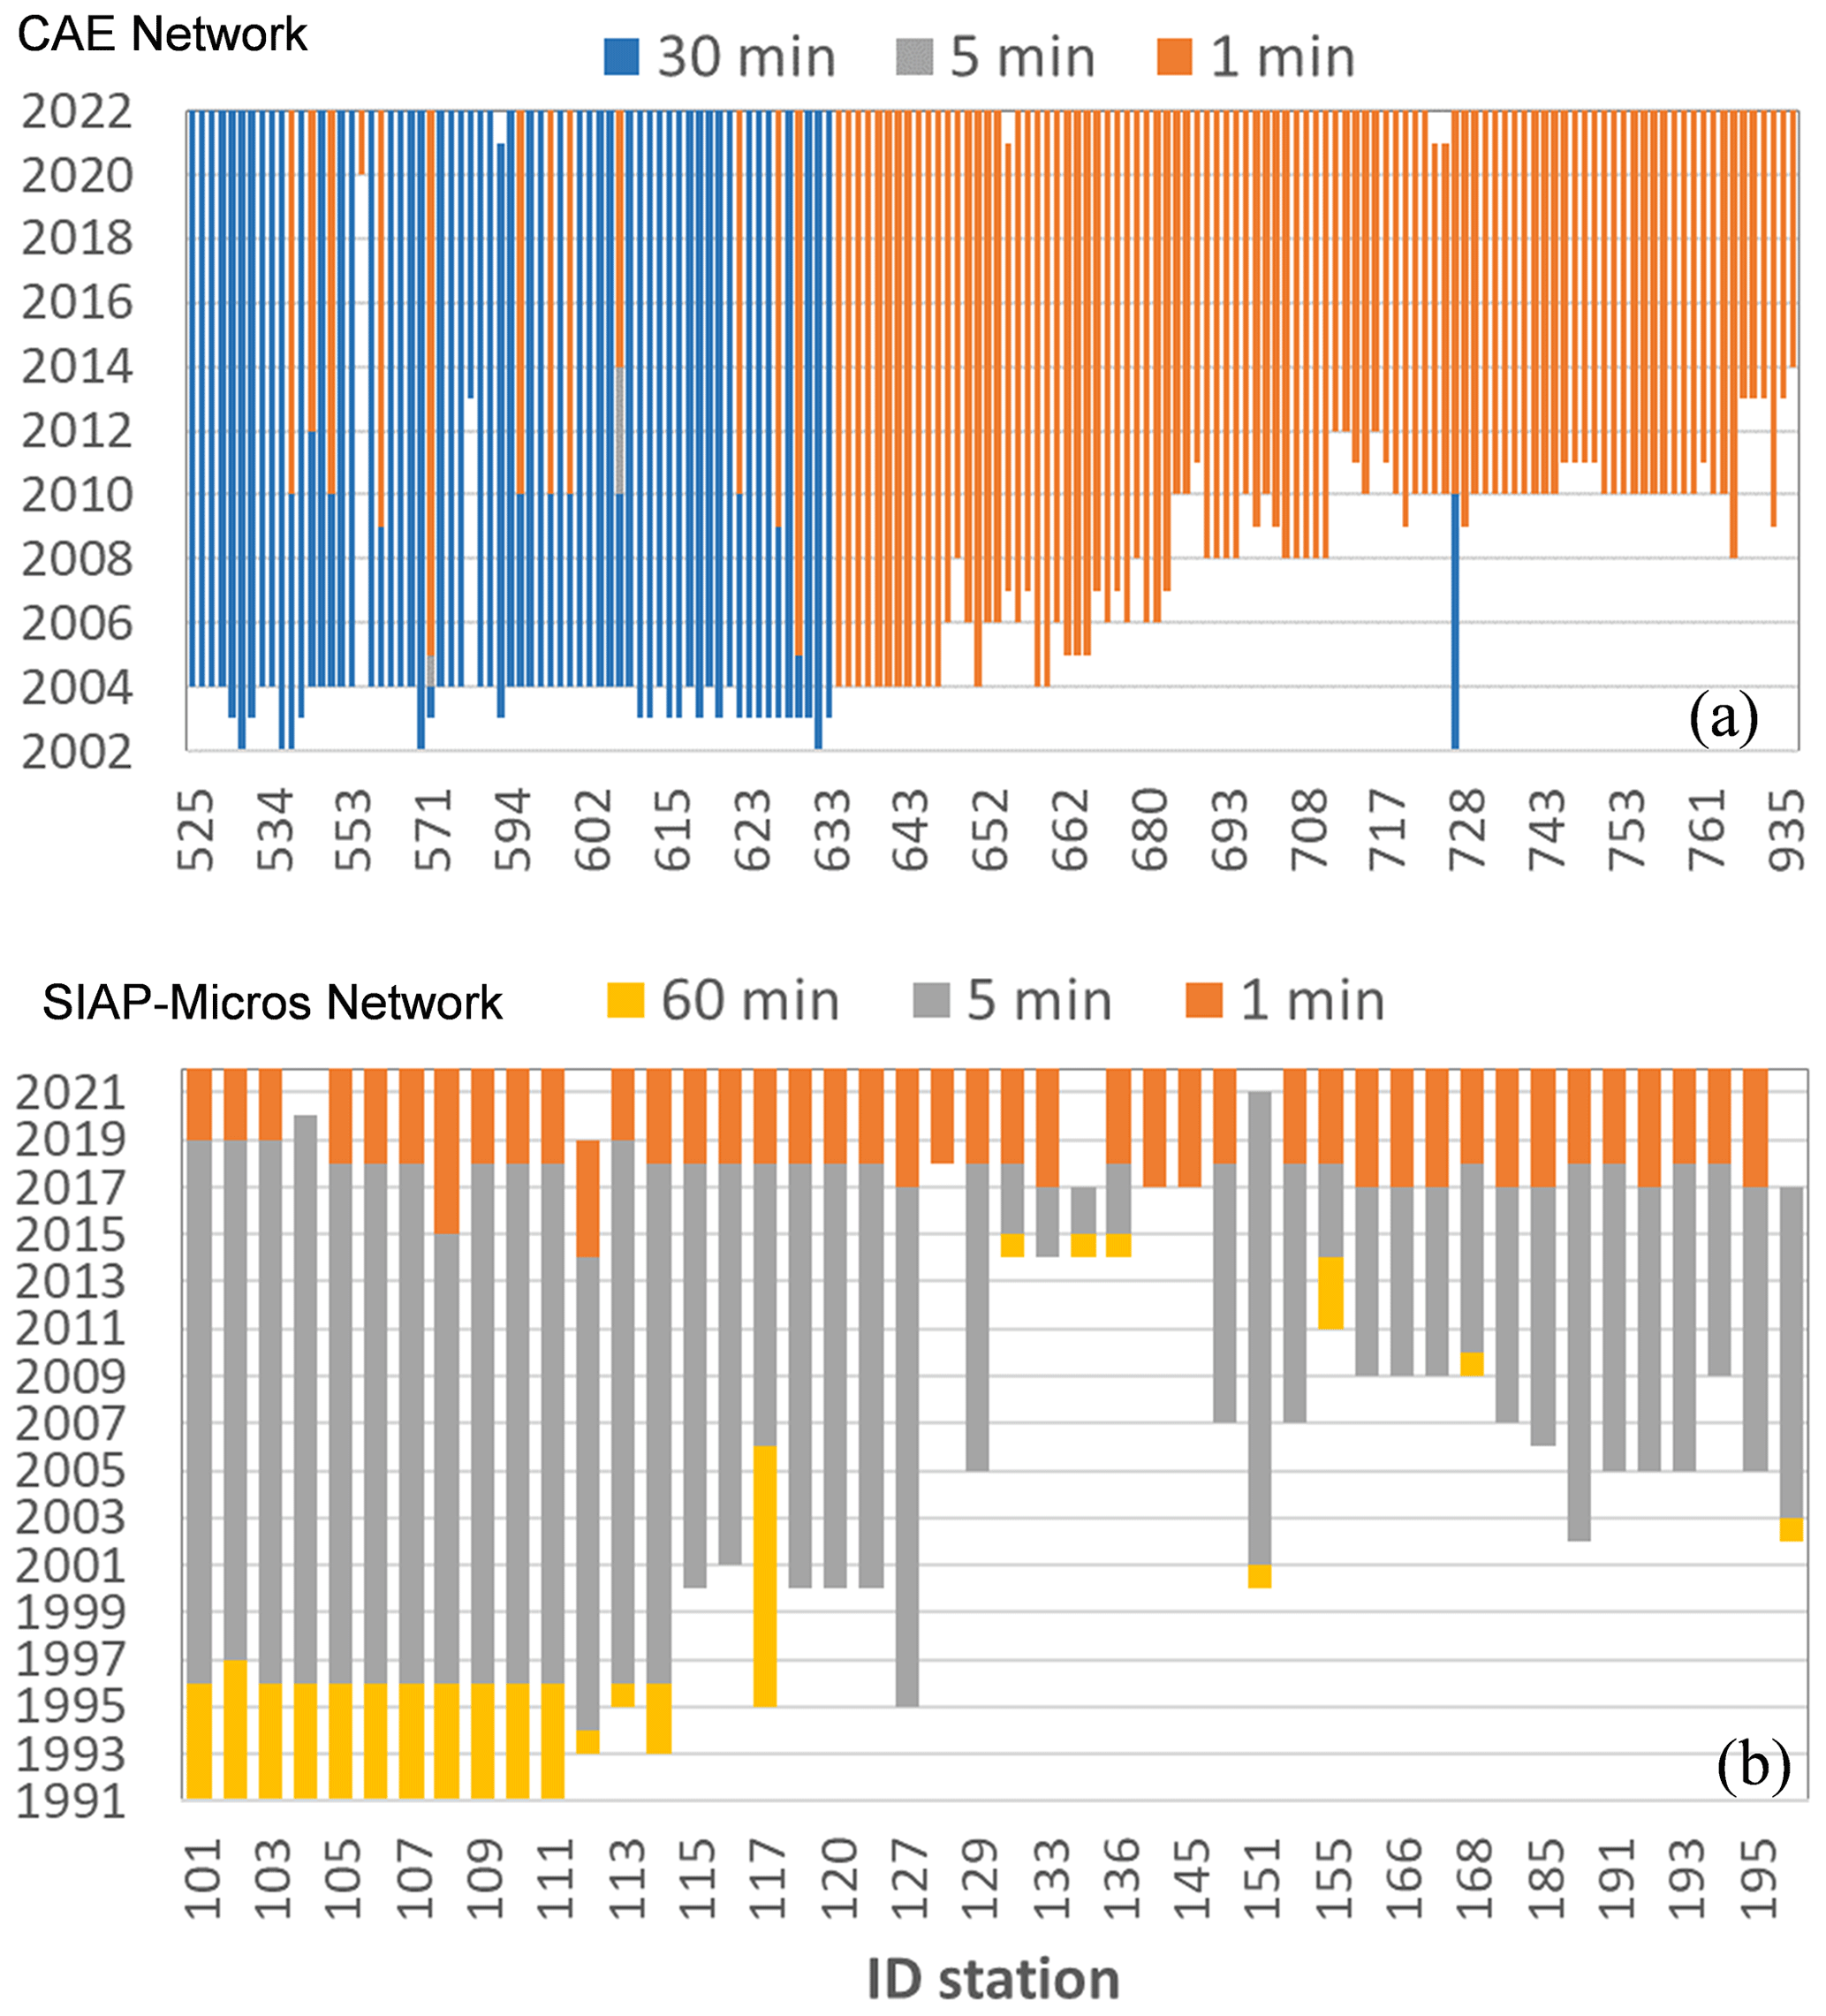
Figure 2Temporal horizon and recording frequency rate of the working rain-gauges for the CAE network (a) and the SIAP-Micros network (b).
The SIAP-Micros rain-gauges have been installed starting from the 1990s at an initial recording frequency of 1 h (Fig. 2b). The resolution has been increased up initially to 5 min (around the 1997) and more recently (∼ 2018) to 1 min. Then, in this case, the continuous series with longest recording length are at a rate of 5 min, with an average of 22 years for the oldest rain-gauges (30 % of the network).
The data validation method described in Sect. 3.2 has been tested on the time series with fr = 5 min of the SIAP-Micros network, which have the longest sampling records. As an example, Fig. 3 shows the results for the ID station #106 located in Udine, the second biggest city of FVG (Fig. 1). From Fig. 3a it can be noticed that the aggregated series A(5) highlights some “spikes”, i.e. values much greater than the references, R(60), up to ∼ 80 mm, which does not find confirmation into the reference series. All the red values are thus discarded (Fig. 3b), for a total of about 0.54 % of the recorded data. Figure 3c shows the corrected series at 5 min step and it is highlighted how the correction method allowed to discard the suspicious outliers' values (≳60 mm/5 min) that could invalidate the quantile regression analysis.
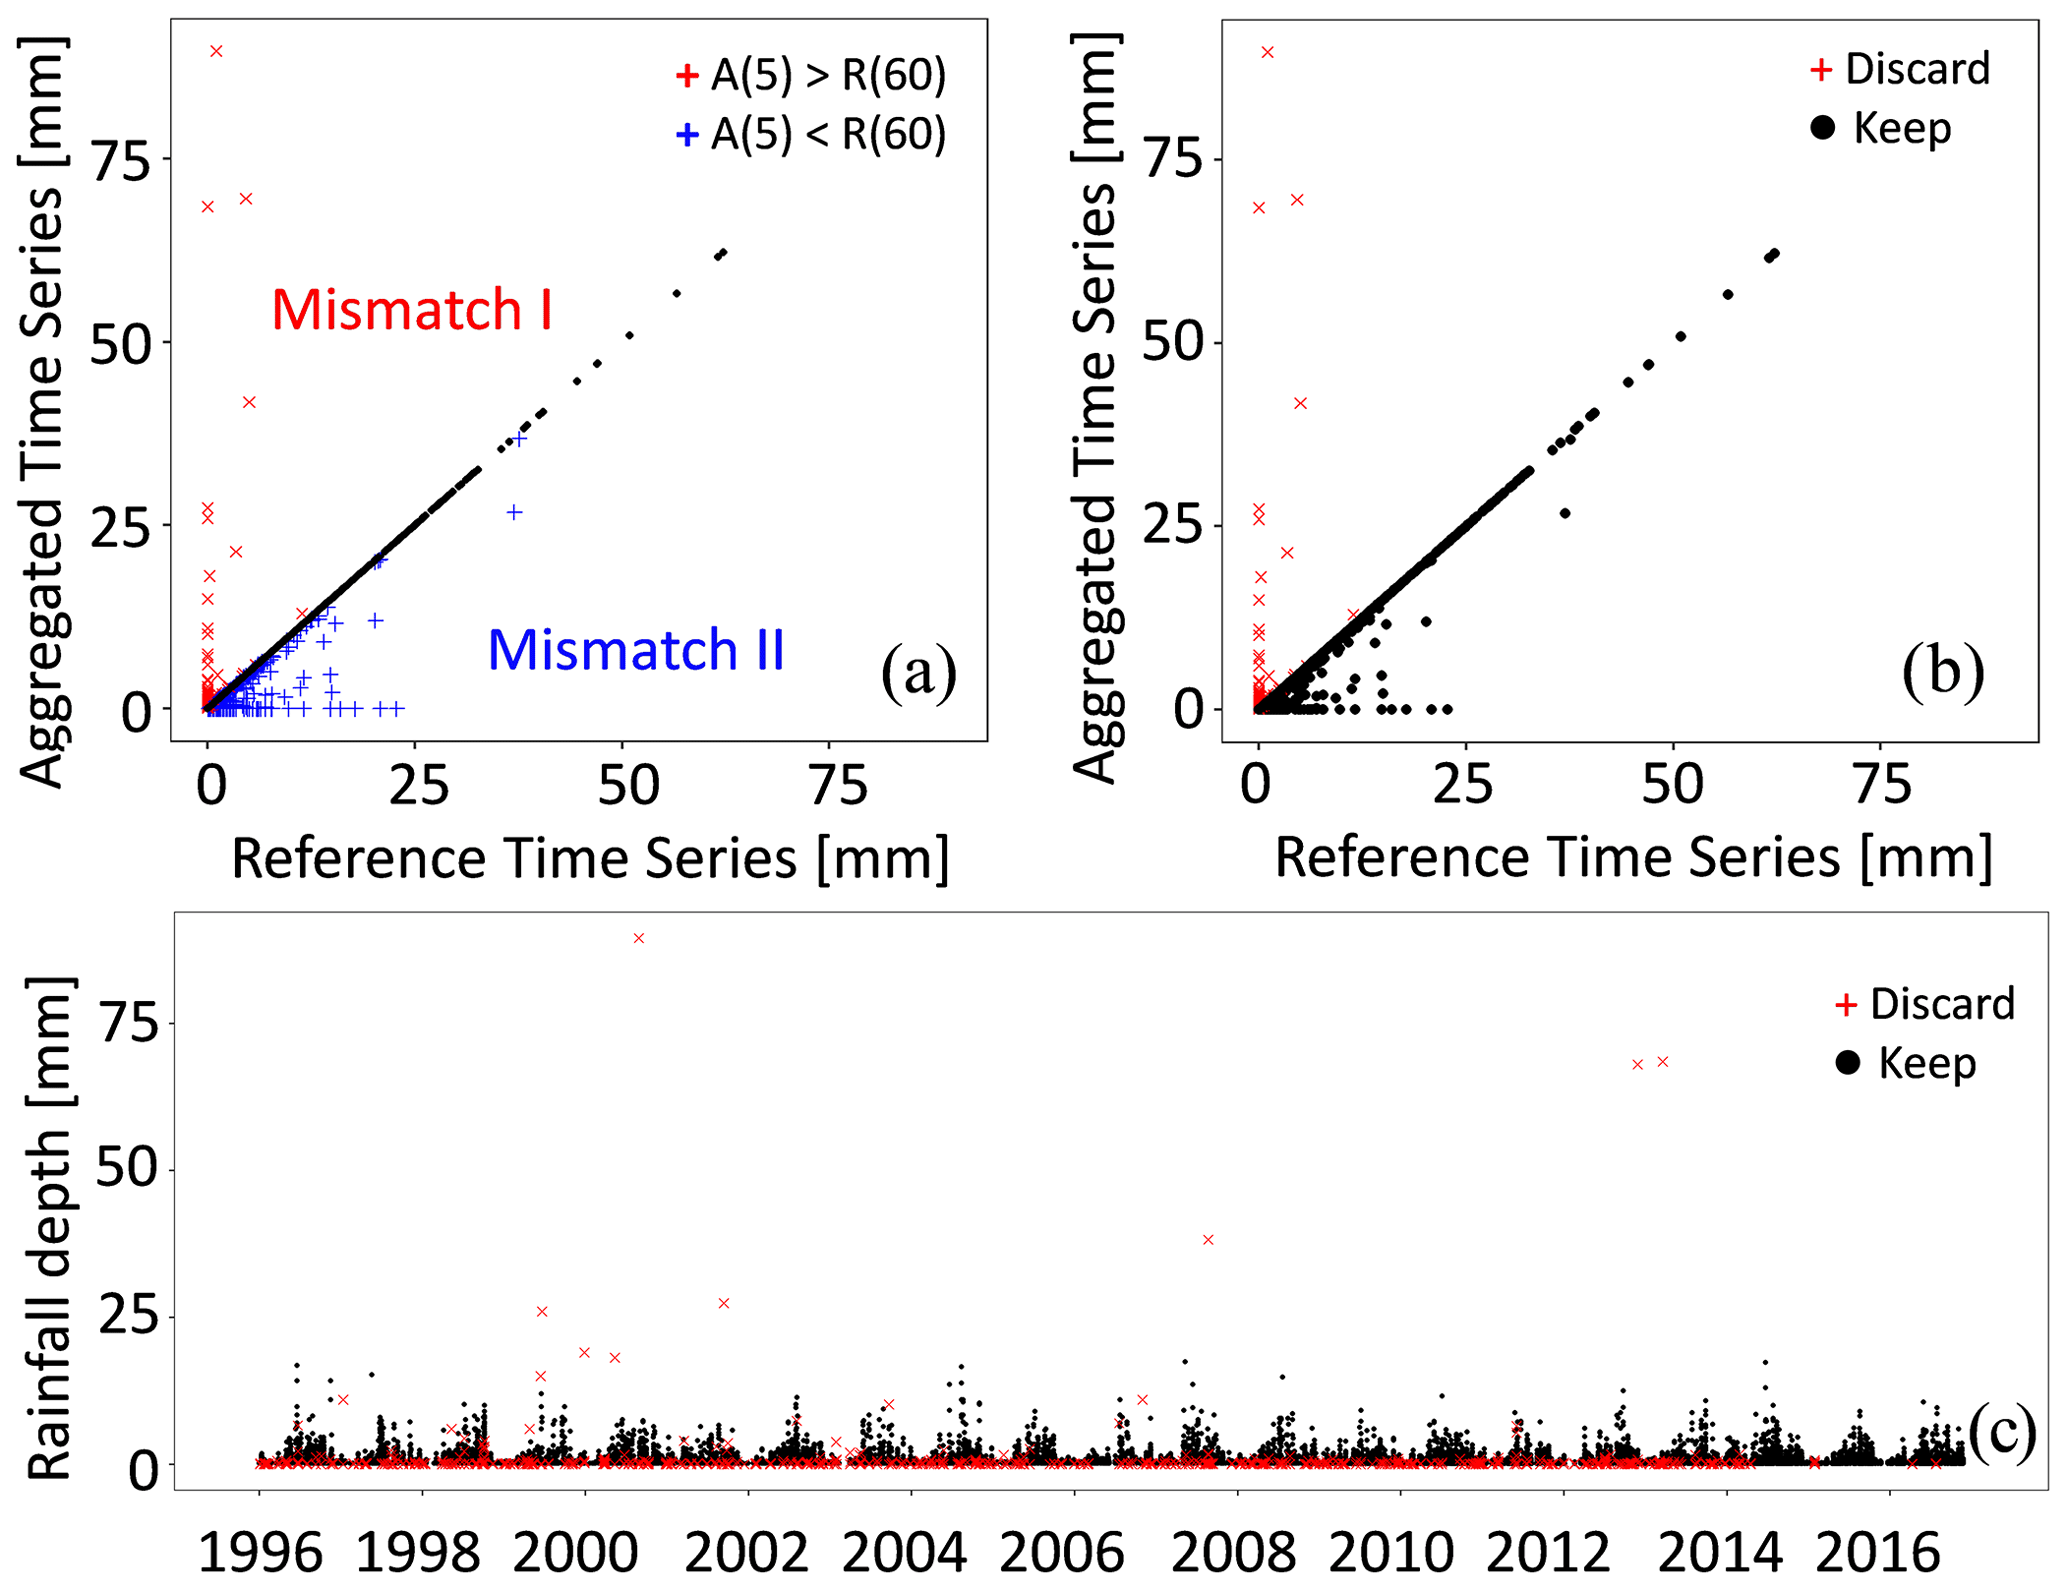
Figure 3Comparison between reference series at 1 h, R(60) and aggregated series at 1 h from the recorded data at 5 min, A(5): in (a) the types of mismatches, in (b) the discarded and kept values and in (c) the cleaned series a 5 min step.
4.2 Trend detection
The quantile regression has been applied to the corrected 5 min time series for three quantile levels, i.e. 0.90, 0.95 and 0.99. Additionally, aggregated series at durations from 10 min to 1 h at 10 min step and of 1, 3, 6, 12 and 24 h have been assessed, for a total of 11 durations.
For the sake of brevity, the results are here reported for three selected stations representative of three different significant locations, i.e. the previous mentioned Udine (#106), Lignano Sabbiadoro (hereinafter Lignano S., #118), which is located along the coastline (Fig. 1) and Musi (#190), located in the eastern part of the Prealps ridges and which records the maximum annual rainfall total in the region (Fig. 1). Table 1 reports the significance of the trend detecting test. It can be noticed that:
-
Udine shows a significant decreasing trend at 5 % for precipitations of 5 and 10 min (0.95 and 0.99 quantiles); an increasing trend at 5 % is detected only at 20 min and 0.9 quantile. Considering a significance level of 10 %, and increasing trend is detected also for precipitations of 24 h (0.9 quantile).
-
Lignano S. shows significant increasing trends at 5 % for almost all the durations and quantile levels.
-
Musi shows increasing significant for all the durations and 0.9 and 0.95 quantiles, as well. The most significant trend at 5 % and for the highest quantile (0.99) is detected only for durations of 10 min, 12 and 24 h.
For the sake of example, Fig. 4 reports the time series of Musi station with the corresponding regression lines for the above highlighted durations. It is notable the significant increase in precipitation at 24 h, especially at 0.99 quantile.
Table 1Significant trends at 5 % and 10 % significance levels obtained for three selected stations (i.e., Udine, Lignano S. and Musi) at 11 durations (D) and 3 quantiles (q1=0.9; q2=0.95; q3=0.99).
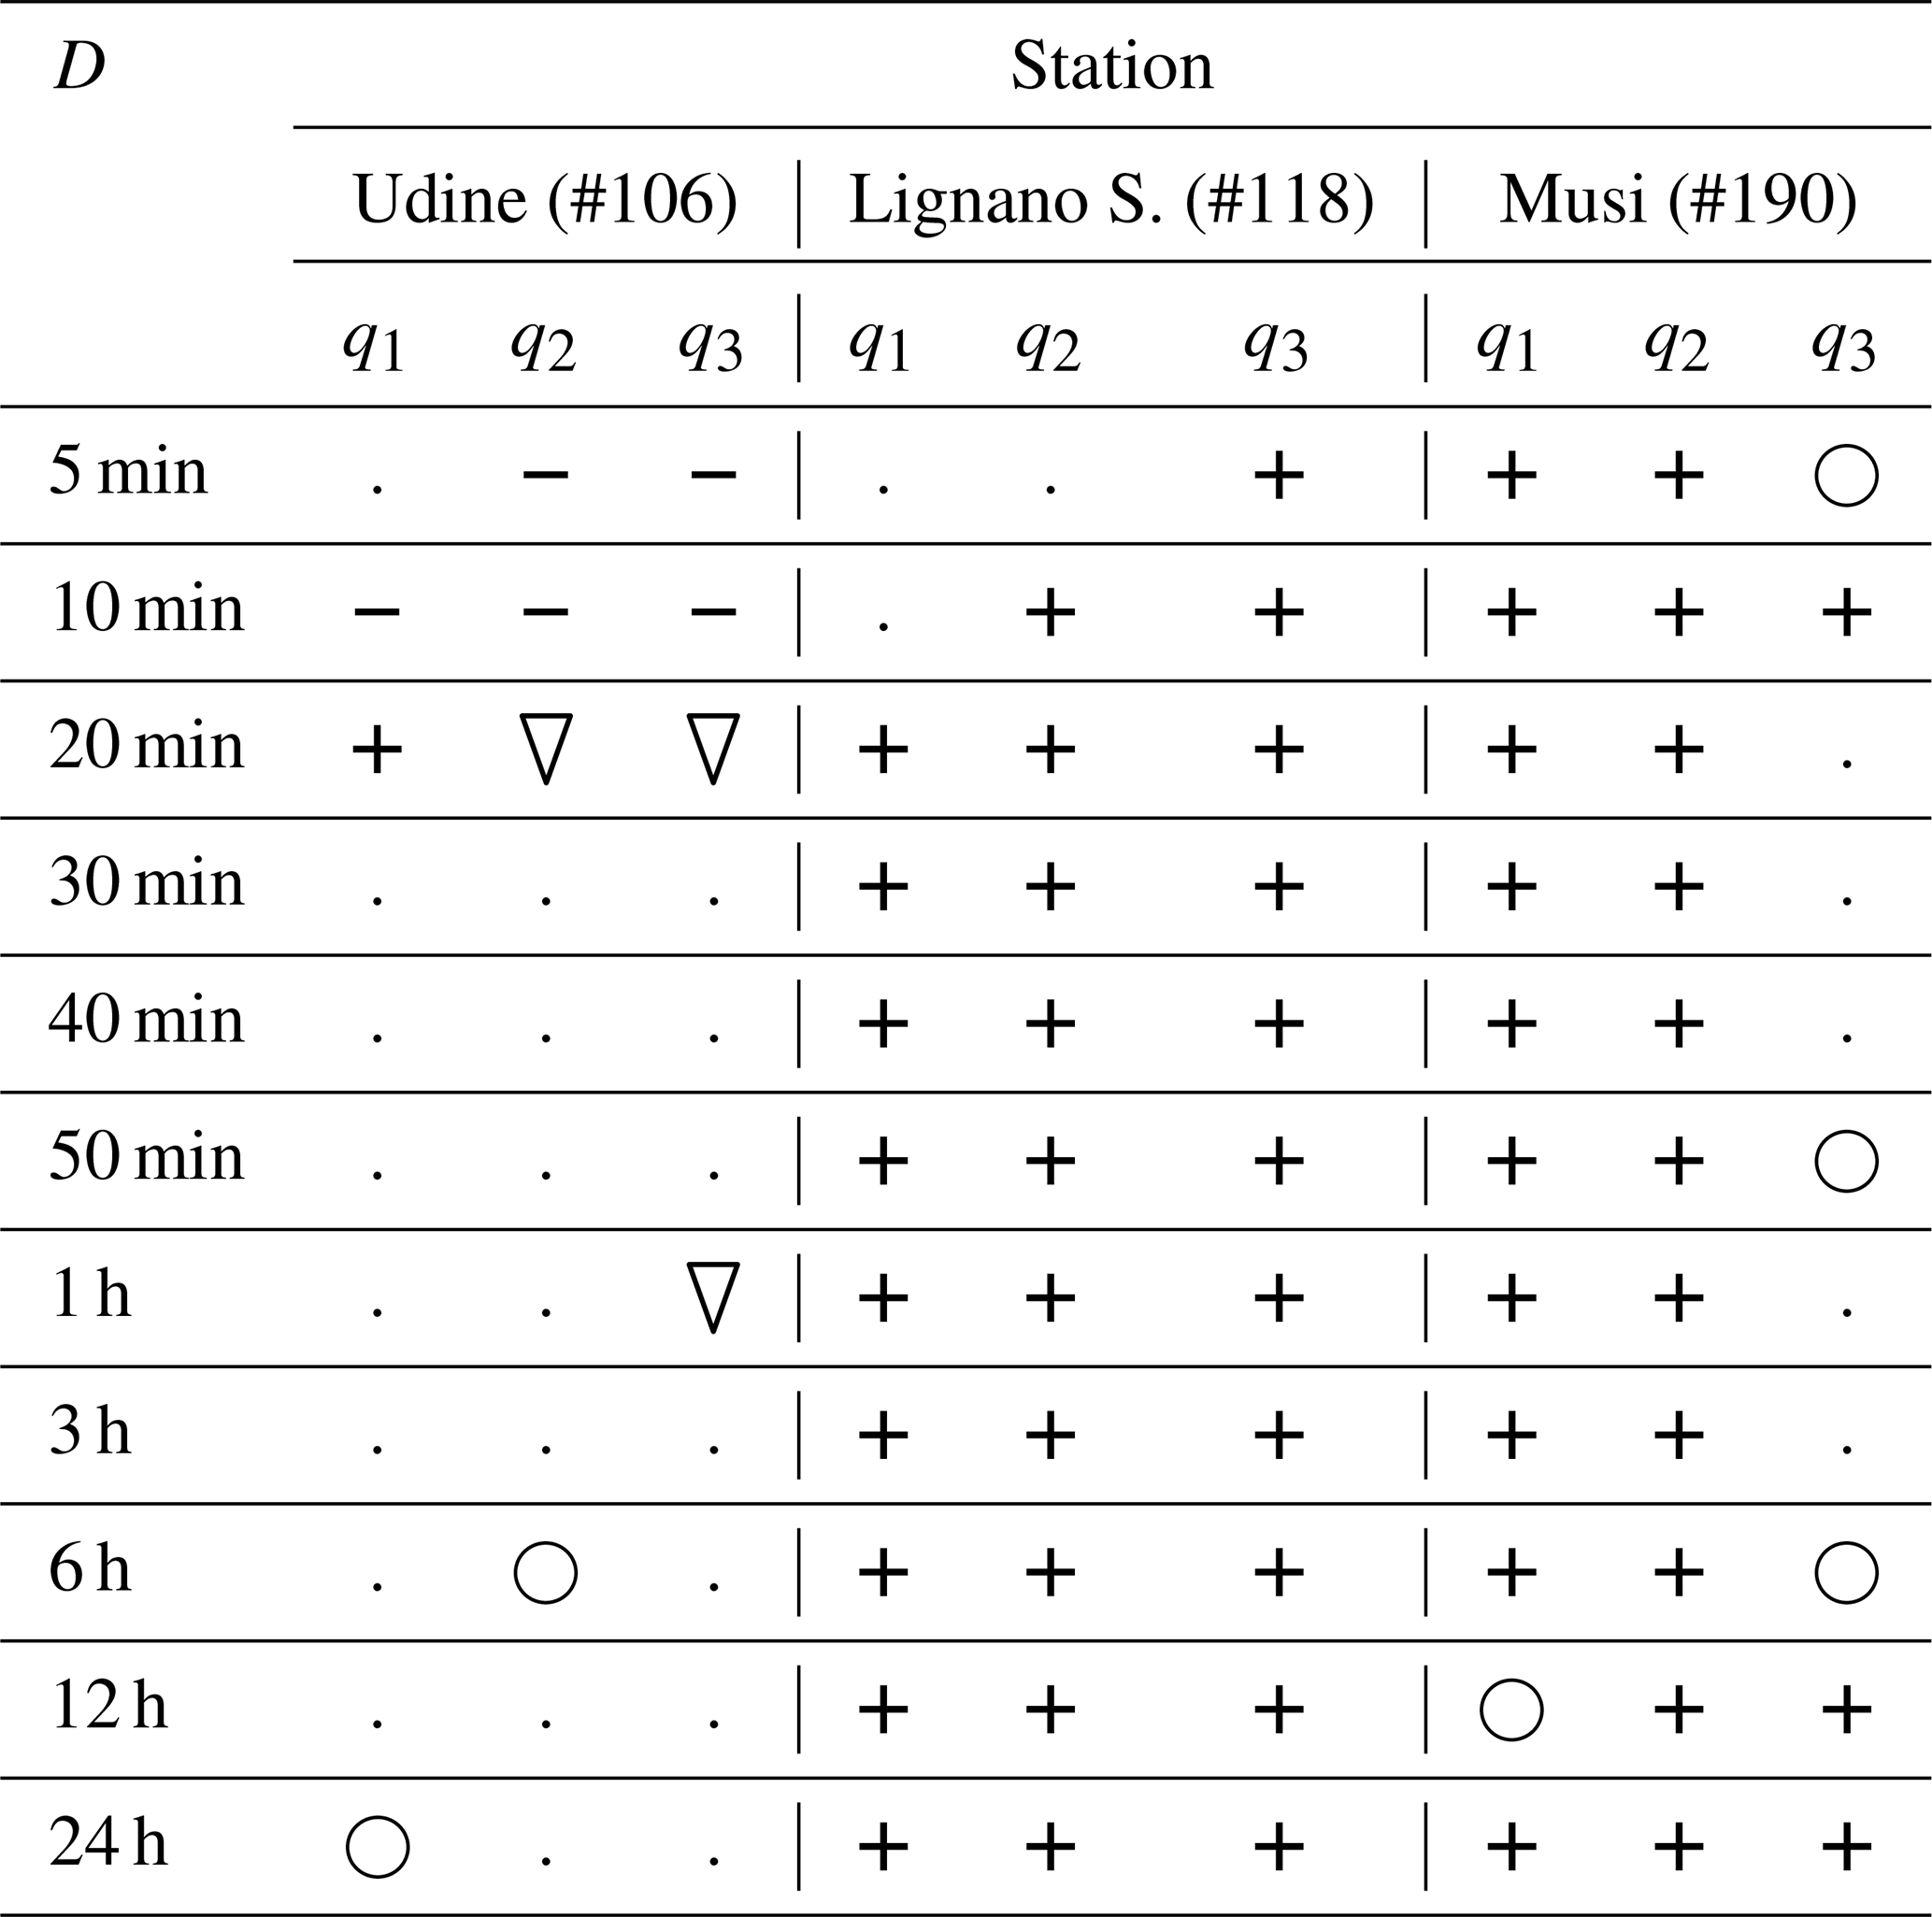
Increasing/decreasing significant at 5 %.
Increasing/decreasing significant at 10 %.
. No trend.
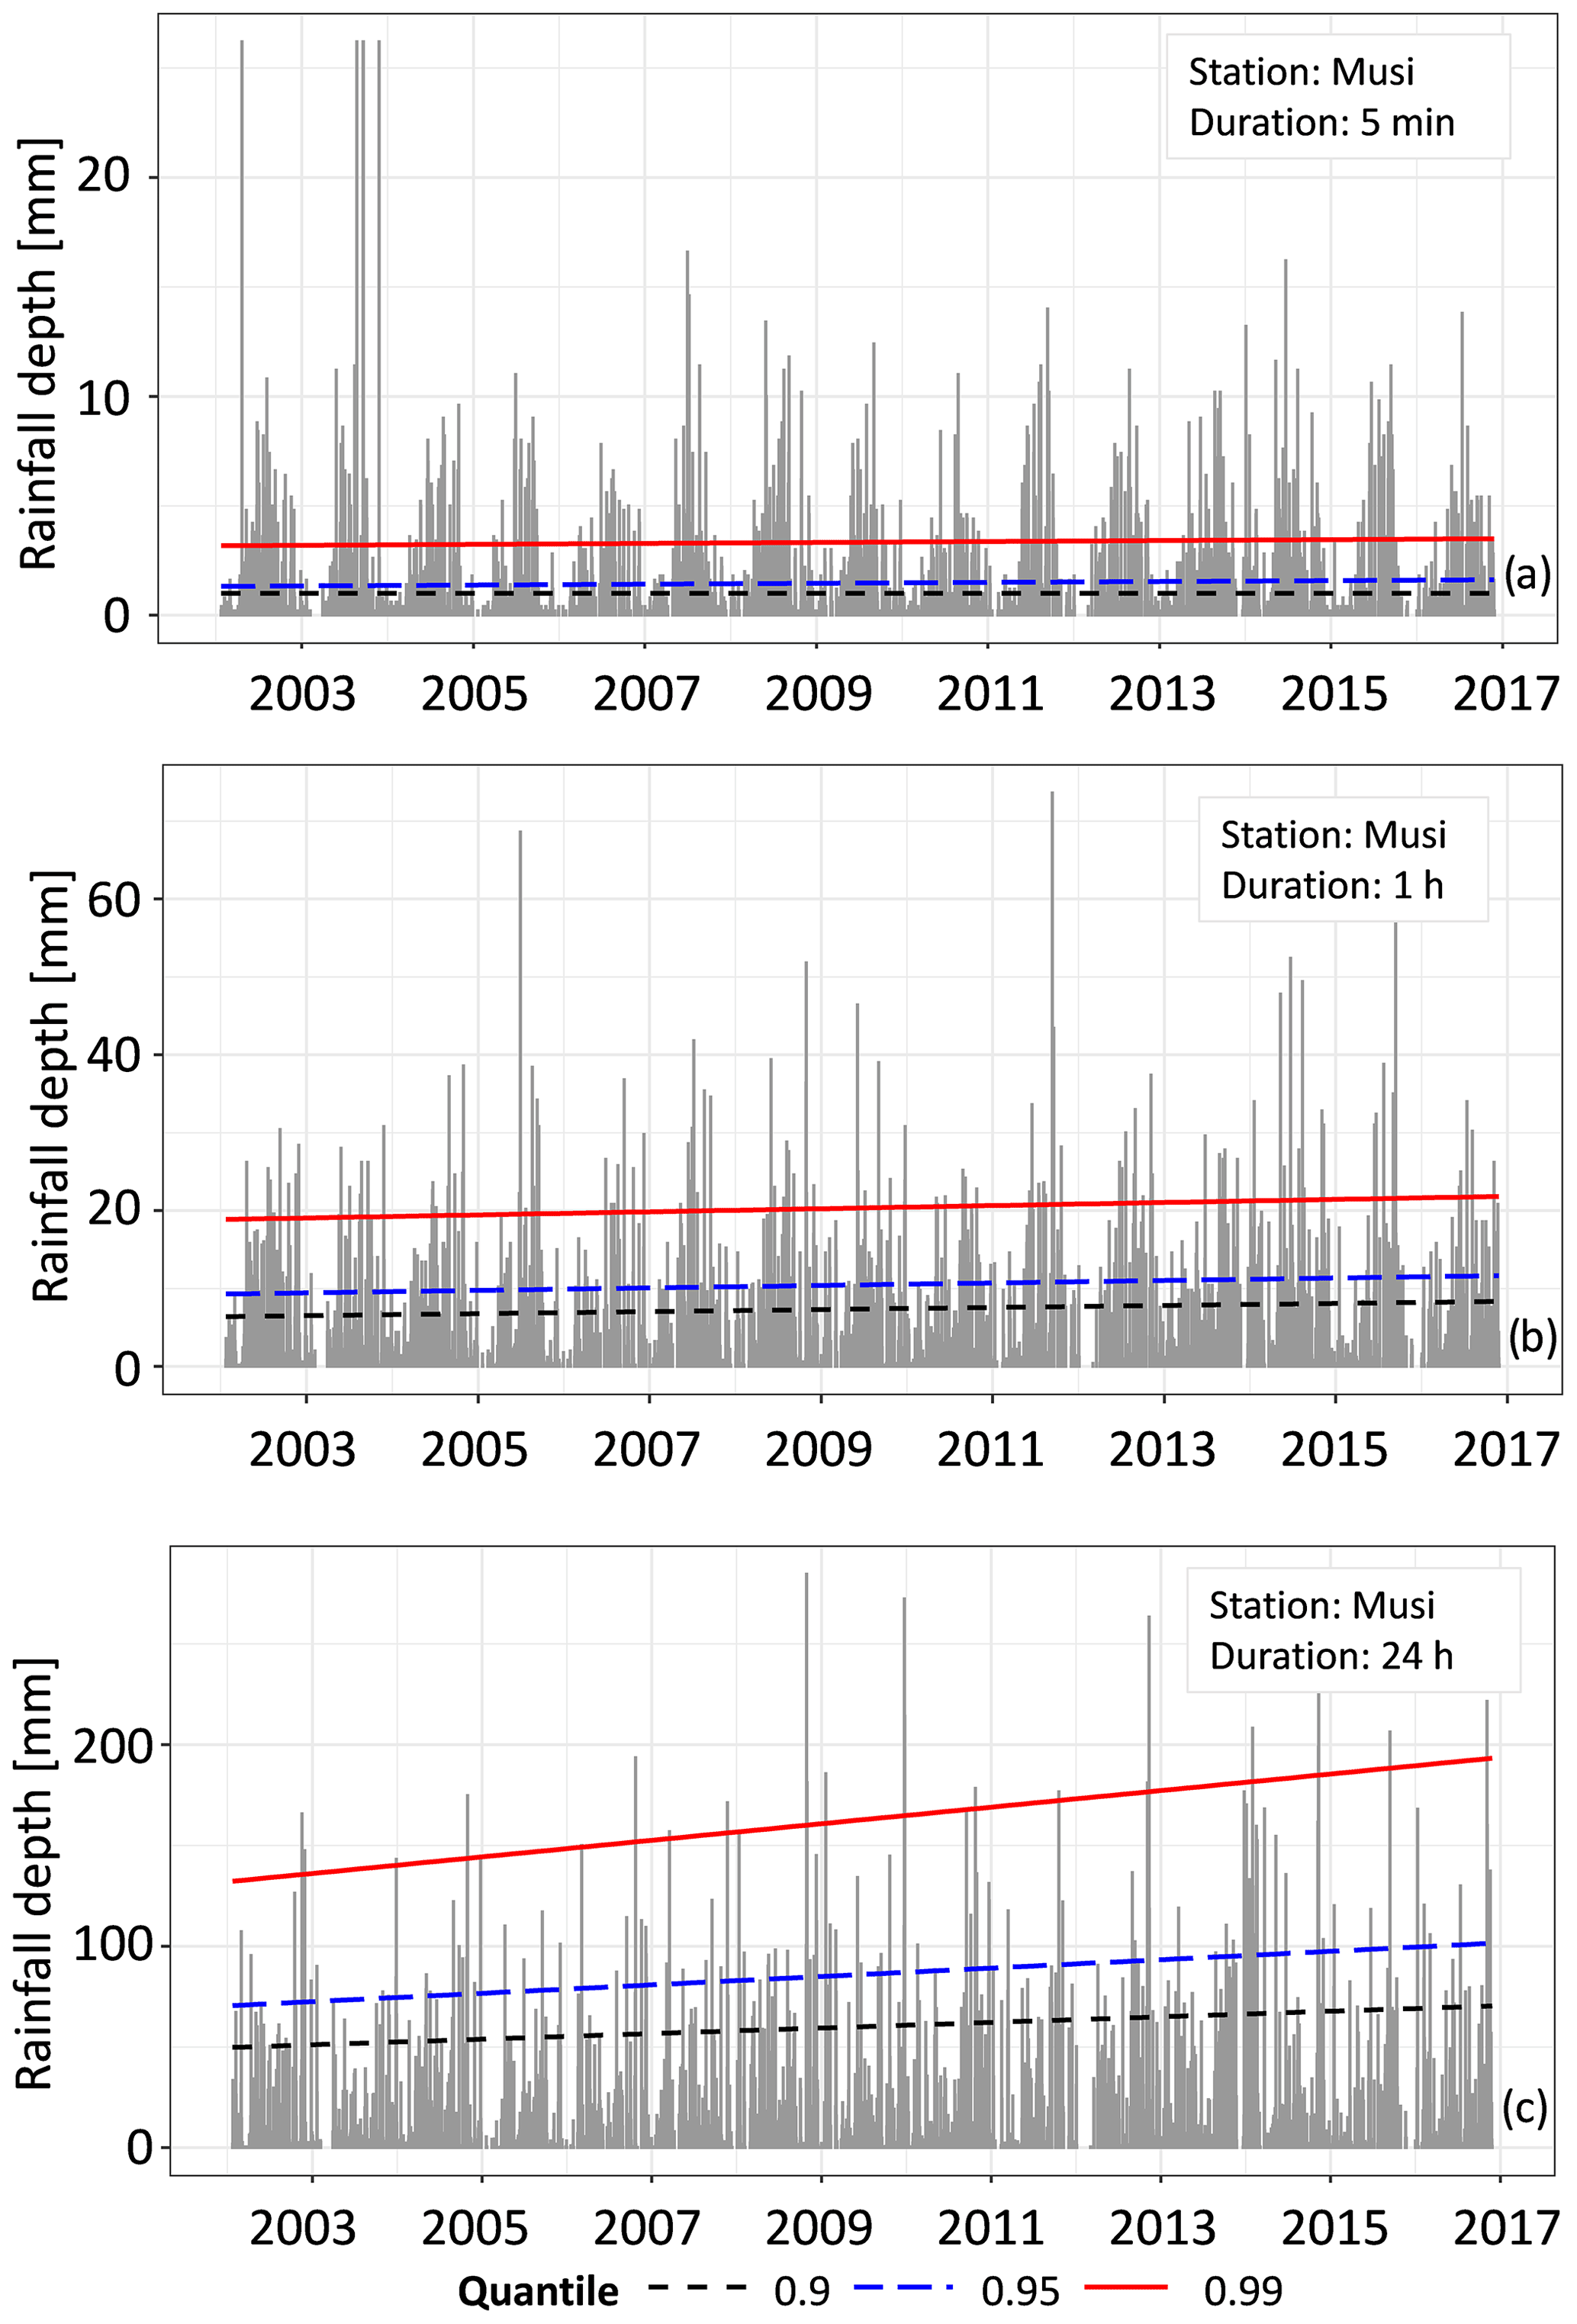
Figure 4Quantile regression lines for quantiles 0.9, 0.95 and 0.99, at the durations of 5 min (a), 1 h (b) and 24 h (c) for the station located in MUSI (#190).
We proposed a comprehensive analysis of the rainfall dataset available for the Friuli Venezia Giulia (FVG), northeastern Italy. The rain-gauges that compose the two main networks are characterized by a sampling frequency rate that varies from 60 to 30, 5 min and 1 min, depending on the historical period and on the station. We checked the consistency of the continuous series at 5 min in order to verify the presence of significant trends through the Quantile Regression (QR) method. The method allows to explore the upper tail of the probability distribution function of the data if very high quantiles are considered. For this reason, we first corrected the original data to remove eventual suspicious outliers, by comparing the series with the validated series at 1 h provided by the local agency that manages the data. The results of the trend detection highlight the presence of significant changes in both short and long precipitations mainly in the station along the coastline and in the Prealps.
Future works aim at further validate the method of data correction and discussing the presence of trend across the entire region, focusing on eventual spatial correlation.
Codes used in this work can be asked to authors upon motivated request.
Data used in this article can be found, on request, at the website of omnia platform by ARPA-OSMER http://omnia.meteo.fvg.it/ (last access: 16 January 2023).
EA is the first and corresponding author. All the authors contributed to the study conception and design. EA collected the data; DT and EA performed the analysis and LVN supervised the work. First draft of the paper was written by EA and all authors commented on previous versions of the manuscript. All authors read and approved the final manuscript.
The contact author has declared that none of the authors has any competing interests.
Publisher’s note: Copernicus Publications remains neutral with regard to jurisdictional claims in published maps and institutional affiliations.
This article is part of the special issue “IAHS2022 – Hydrological sciences in the Anthropocene: Variability and change across space, time, extremes, and interfaces”. It is a result of the XIth Scientific Assembly of the International Association of Hydrological Sciences (IAHS 2022), Montpellier, France, 29 May–3 June 2022.
This paper was edited by Christophe Cudennec and reviewed by two anonymous referees.
Agenzia Regionale per la Protezione e per l’Ambiente del Friuli Venezia Giulia (ARPA-FVG): Return periods of annual maxima series, Technical Report, https://www.meteo.fvg.it/clima/clima_fvg/02_documenti_descrittivi, 2021.
Arnone, E., Pumo, D., Viola, F., Noto, L. V., and La Loggia, G.: Rainfall statistics changes in Sicily, Hydrol. Earth Syst. Sci., 17, 2449–2458, https://doi.org/10.5194/hess-17-2449-2013, 2013.
Arnone, E., Zoratti, V., Formetta, G., Bosa, S., and Petti, M.: Predicting peakflows in mountain river basins and data-scarce areas: a case study in northeastern Italy, Hydrolog. Sci. J., accepted, https://doi.org/10.1080/02626667.2022.2162408, 2023.
Berne, A., Delrieu, G., Creutin, J.-D., and Obled, C.: Temporal and spatial resolution of rainfall measurements required for urban hydrology, J. Hydrol., 299, 166–179, 2004.
Caporali, E., Lompi, M., Pacetti, T., Chiarello, V., and Fatichi, S.: A review of studies on observed precipitation trends in Italy, Int. J. Climatol., 41, E1–25, https://doi.org/10.1002/joc.6741, 2021.
Ceschia, M., Micheletti, S., and Carniel, R.: Rainfall over Friuli Venezia Giulia: High Amounts and Strong Geographical Gradients, Theor. Appl. Climatol., 43, 175–180, 1991.
Dal Gesso, S., Arnone, E., Venturini, M., Cucchi, M., and Petitta, M.: SOON: The Station Observation Outlier finder, in: Managing Water Resources for a Sustainable Future, edited by: Garrote L., Tsakiris G., Tsihrintzis V.A., Vangelis H., and Tigkas D., Proc. of the 11th World Congress of EWRA, Madrid, Spain, 25–29 June 2019, ISBN 978-618-84419-0-3, 2019.
Huang, Y., Bárdossy, A., and Zhang, K.: Sensitivity of hydrological models to temporal and spatial resolutions of rainfall data, Hydrol. Earth Syst. Sci., 23, 2647–2663, https://doi.org/10.5194/hess-23-2647-2019, 2019.
Koenker, R.: Quantile Regression, Cambridge University Press, Cambridge, ISBN 9780511754098, https://doi.org/10.1017/CBO9780511754098, 2005.
Treppiedi, D., Cipolla, G., Francipane, A., and Noto, L. V.: Detecting precipitation trend using a multiscale approach based on quantile regression over a Mediterranean area, Int. J. Climatol., 41, 5938–5955, 2021.
Villarini, G., Smith, J. A., Baeck, M. L., Vitolo, R., Stephenson, D. B., and Krajewski, W. F.: On the frequency of heavy rainfall for the Midwest of the United States, J. Hydrol., 400, 103–120, 2011.
Wang, B. H. and Takase, K: Effects of temporal resolution on hydrological model parameters and its impact on prediction of river discharge, Hydrol. Sci. J., 54, 886–898, https://doi.org/10.1623/hysj.54.5.886, 2009.