the Creative Commons Attribution 4.0 License.
the Creative Commons Attribution 4.0 License.
 | 19 Apr 2024
Comparison of Actual Evapotranspiration assessment by satellite-based model SEBS and hydrological model BBH in northern Tunisia
Zoubeida Bargaoui
Aymen Ben Jaafar
Chris M. Mannaerts
Estimating actual evapotranspiration (AET) in agricultural semi-arid regions is important for crop yield and drought assessment. The Surface Energy Balance System (SEBS) model, a physically based energy balance model using satellite information is used to estimate AET at the 10 d scale, with a 3 km resolution. The bucket bottom hole (BBH) model, a conceptual daily water balance model is calibrated using the equifinality approach and run for simulating daily AET. Five watersheds located in northern Tunisia with areas varying between 56 and 448 km2 were calibrated using daily rainfall and potential evapotranspiration data as entry and river discharge as output data. Sets of model parameters fulfilling both absolute relative errors of simulated discharge less than 20 % and Nash–Sutcliffe coefficients greater than 0.75 were selected. Three years were selected for the comparison (2010, 2017, and 2018). For every year, six subperiods of 10 d are considered belonging to January, March, April, May, July, and September. Boxplots of AET-BBH estimations are plotted to achieve a comparison with AET-SEBS estimates. It is found that AET comparisons are well favorable for January, March, and April while less satisfactory for May and September. They do not match for July. AET-SEBS are much higher in comparison with AET-BBH estimates with an RMSE and MAE equal respectively to 17 and 19 mm 10 d−1. These results may help stakeholders to assess AET coming from different data sources and models.
- Article
(3253 KB) - Full-text XML
- BibTeX
- EndNote


SDG 2; Modelling; Actual Evapotranspiration; Bucket Bottom Hole model (BBH); Surface Energy Balance model (SEBS); Northern Tunisia
According to climate change studies, Tunisia experienced extreme phenomena over the past decade (drought and flooding) which would have a direct impact on agriculture and therefore on the country's food security (Verner, 2013). In this context, it is important to evaluate evapotranspiration, as a proxy for crop yield (Eagleson, 1994). Assessment of actual evapotranspiration is generally achieved using three different approaches (i) surface energy balance modeling (Bastiaanssen et al., 1998; Roerink et al., 2000; Su, 2002), (ii) Hydrological modeling (Kite, 1997; Kobayashi et al., 2001), and (iii) land surface modeling (Wang and Dickinson, 2012; Liou and Kumar Kar, 2014). Because there is a lack of published in situ evapotranspiration data in northern Tunisia, we aim to compare (i) and (ii) methods. We select the Surface Energy Balance (SEBS) model (Su, 2002) which is well-used all over the world except in Tunisia. It is also proposed to consider the Bucket Bottom Hole model (BBH) (Kobayashi et al., 2001) which was previously analyzed for northern Tunisia (Ben Jaafar and Bargaoui, 2020).
The study area is the northern part of Tunisia (North Africa) (Fig. 1). It is generally known for its Mediterranean climate. The main agricultural productions are cereals (wheat and barley) and olives. This area experienced several droughts in the last years. According to the National Journal of the Republic of Tunisia, 14 years from 1993 are identified as dry years for cereal crops resulting in damages for farmers and loss of revenues from cereal yields. Five watersheds are considered: Barbara, Beja, Douimis, Joumine, and Sejnane. The basin's areas vary from 56 to 448 km2 (Fig. 1).
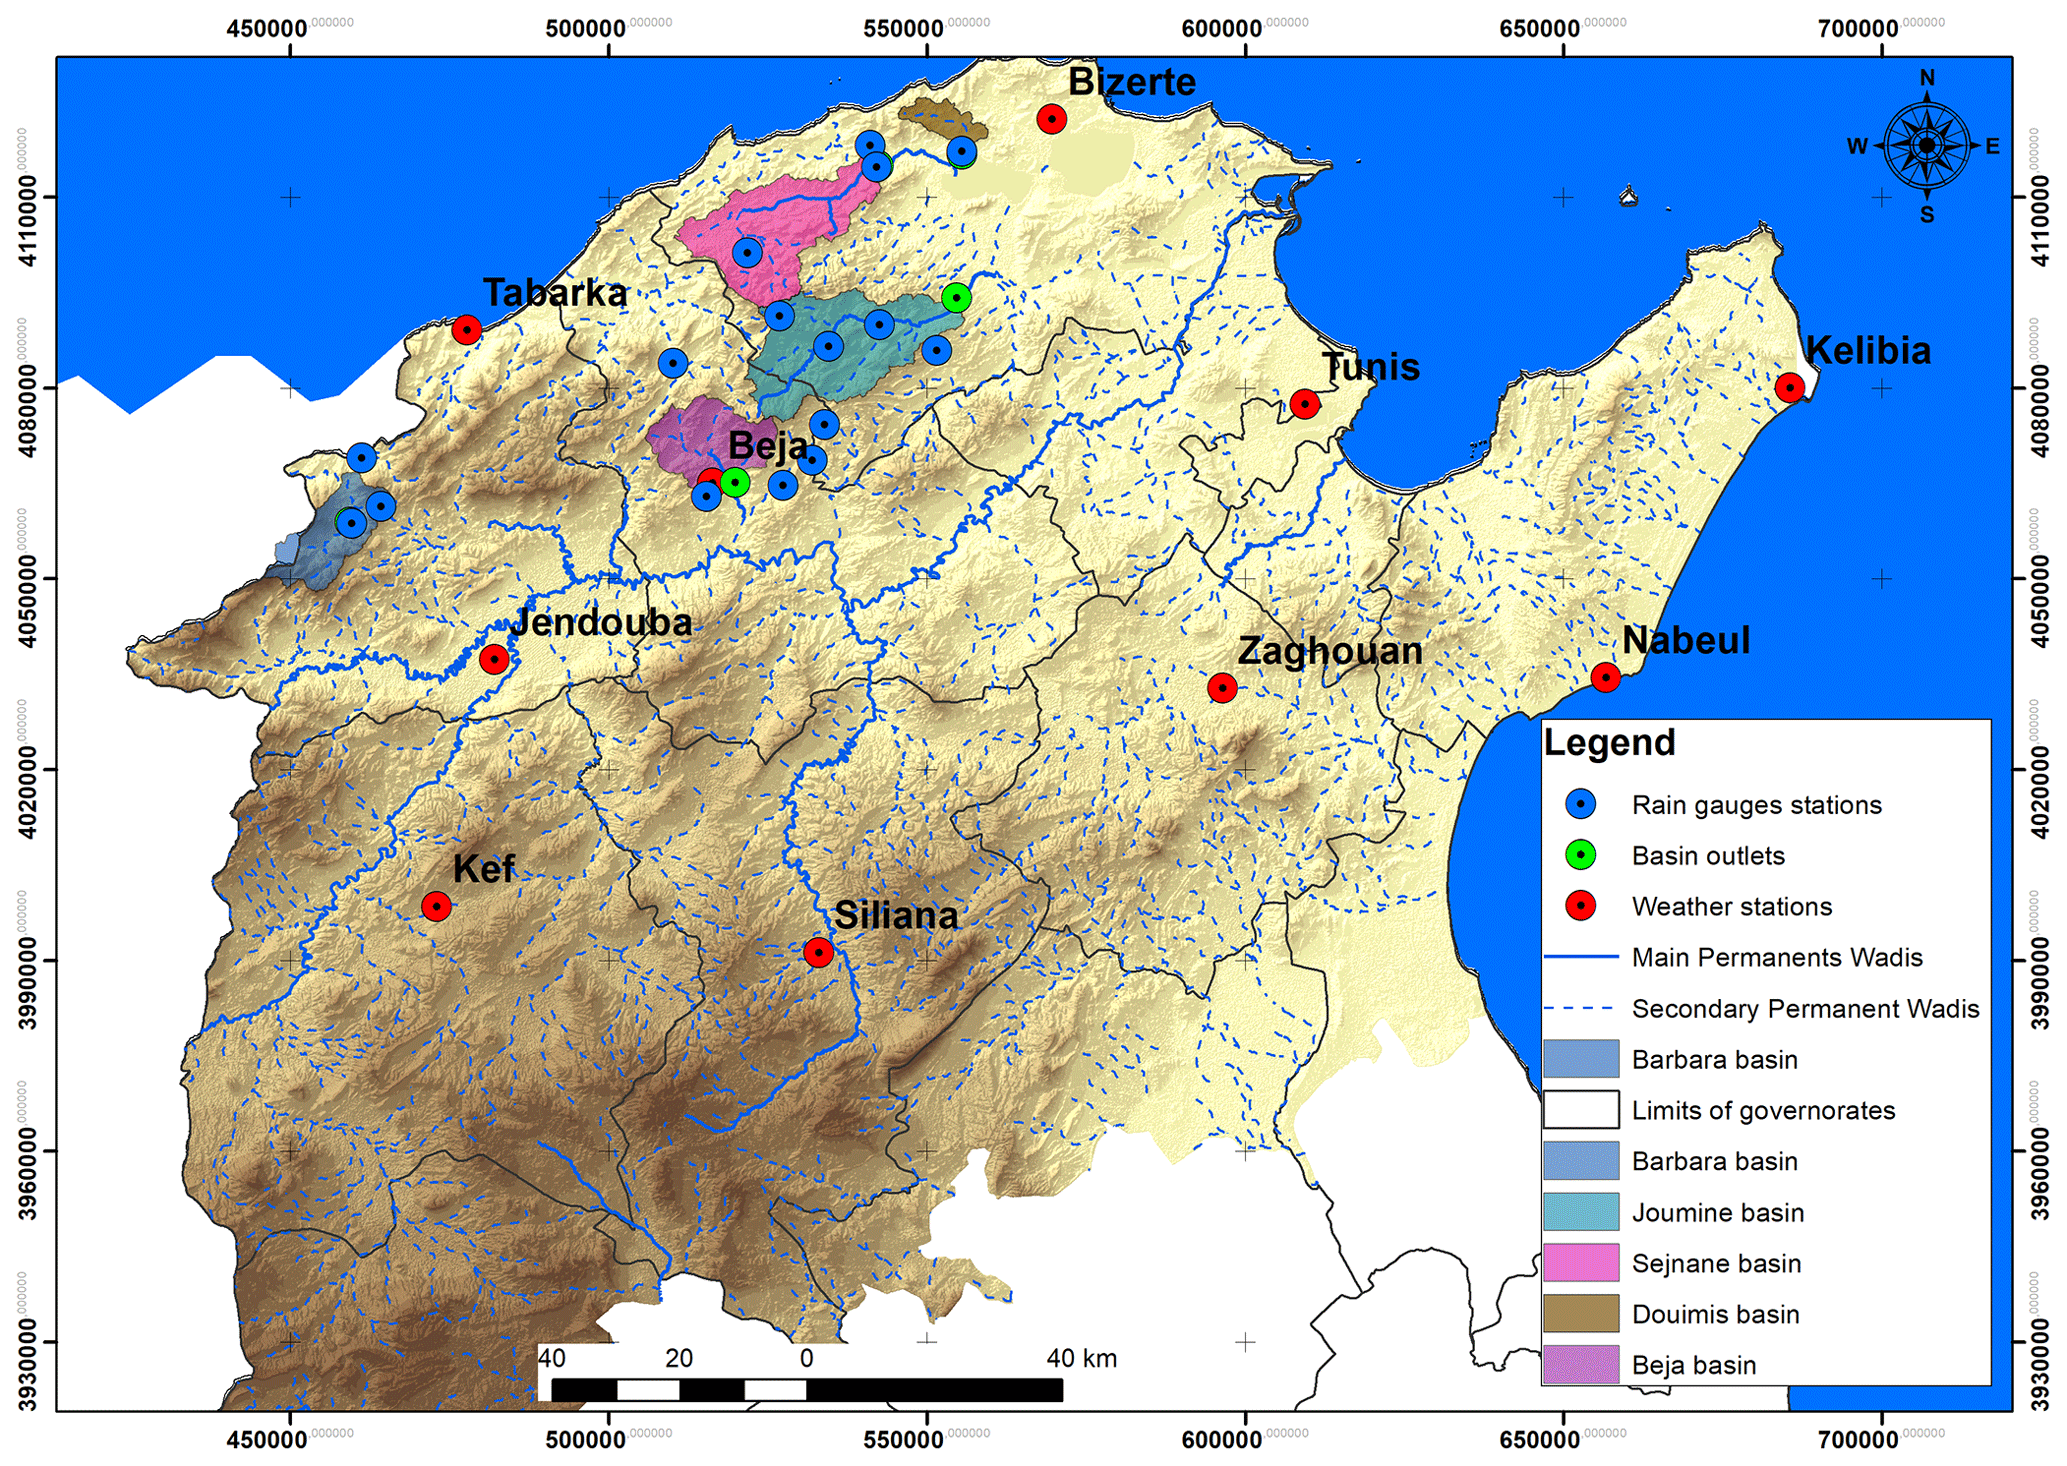
Figure 1Map of the study area with the localization of the five watersheds (Barbara, Beja, Douimis, Joumine, and Sejnane) and the distribution of the meteorological and runoff stations.
2.1 In situ data
2.1.1 Meteorological data
In situ meteorological data are obtained from the National Institute of Meteorology (INM) (https://www.meteo.tn/, last access: 14 February 2024) at the level of ten weather stations: Beja, Bizerte, Jendouba, Kef, Kelibia, Nabeul, Siliana, Tabarka, Tunis and Zaghouan (Fig. 1). Meteorological variables are mean daily air temperature in °C, mean daily air pressure in Pascal, daily duration of sunshine in hours, mean daily wind speed in m s−1, and mean daily specific humidity (kg kg−1). The period from January to September corresponding to the different stages of crop growth for the civil years 2010, 2017, and 2018 are studied.
2.1.2 Hydrological and rainfall data time series
Daily precipitation and runoff data are provided by the Hydrological National Service. The basin precipitation is estimated using the Thiessen method based on a network of available rain gauges (Fig. 1). Observations from the period 1950 to 1990 are used to calibrate the hydrological model (Ben Jaafar and Bargaoui, 2020). Observations from 2010 to 2018 are used also to run the model with calibrated parameters.
2.1.3 PET estimation using meteorological data
Monthly averages of minimum and maximum temperature in °C are used to compute monthly PET using Riou (1980) model. It is an entry variable to run the hydrological model BBH. The nearest meteorological station is considered for each basin (Fig. 1).
2.1.4 Soil map data
Soil texture data are used to estimate soil texture parameters in the BBH model. Soil texture maps are available from the digital agricultural map of Tunisia obtained from the local water and soil divisions.
2.2 Remote sensing data
Remote sensing data consists of The Land Surface Analysis Satellite Application Facility (LSA SAF) product: the Downward Surface Shortwave Flux (DSSF) (W m−2), the Land Surface Temperature (LST) (°C), the Albedo parameter, the fraction of vegetation cover (FVC), and leaf area index (LAI) with a 3 km spatial resolution and instantaneous to daily temporal resolutions. In addition, we use the SPOT-Vegetation data Normalized Difference Vegetation Index (NDVI) product with 10 d and 1 km temporal and spatial resolutions respectively. Moreover, the topographic information (Digital Elevation Model DEM) was produced originally by NASA with a spatial resolution equal to 90 m. We use all data as input into the SEBS model.
ILWIS software environment is used to preprocess the data files. Data were downloaded and then imported and pre-processed using the GEONETcast Toolbox (Maathuis et al., 2011). The resampling of imported products was achieved into a geographic coordinate system datum WGS84 with a common 3 km spatial resolution.
The Surface Energy Balance System SEBS is applied for the study area at 3 km spatial resolution. The hydrological balance model is applied at the scale of the watershed (lumped model). SEBS estimations are summed over the basin's pixels and then averaged to be compared to BBH estimations.
3.1 Bucket Bottom Hole (BBH) model
The BBH model is a water balance model developed by Kobayashi et al. (2001). Model inputs are daily precipitation and potential evapotranspiration. Outputs are mean daily river discharge data, actual evapotranspiration, percolation, and capillary rise. The model has seven parameters which are parameter (a) linked to the field capacity, parameter (b) linked to the recession of soil humidity, (c) representing capillary rise pressure, (p) representing soil porosity, (D) for the thickness of the active soil layer (mm), (η) the inverse of efficient porosity, and (σ) the resistance of vegetation to evapotranspiration. Bargaoui and Houcine (2010) reformulated parameters (a, b, c) using soil texture parameters: field capacity (SFC), saturated hydraulic conductivity (Ks), effective soil porosity (p), and the soil water retention curve shape parameter (B) as well as the thickness of the active soil layer (D). Rawls et al. (1982) and Cosby et al. (1984) models are adopted to estimate Ks and SFC respectively. The weights for computing spatial values of SFC and porosity are obtained considering the percent of basin area occupied by every soil texture type and the arithmetic mean. The geometric mean is used for Ks because it is known to be log-normally distributed.
The three remaining parameters (D, η, σ) are fitted using the observed rainfall and runoff time series. We divide the observations into a training subset (calibration) and a validation subset of 3 years in a systematic way (Ben Jaafar and Bargaoui, 2020). The model is running on the scale of the daily time step and the fitting evaluation adopts the 10 d and monthly time steps. Two criteria are considered to fit the parameters: (i) The relative error in absolute value (AARE) and (ii) the Nash–Sutcliffe coefficient (NSC) (Nash and Sutcliffe, 1970). All solutions with NSC > 0.75 are selected if they perform AARE < 0.2. The ranges of research are respectively mm, , . The generalized fractional sample test (GSST) proposed by Coron et al. (2012) is adopted as well as equifinality (Beven, 2006) to identify model parameters. Finally, the selected sets (D, η, σ) are used to run the model from 2010 to 2018 continuously.
3.2 Surface Energy Balance System SEBS
The SEBS model developed by Su (2002) combines remote sensing products and in situ meteorological data to estimate turbulent surface energy fluxes and the evaporative fraction. AET is estimated using the energy balance equation. The SEBS model considers a dry limit (λE flux = 0) and a wet limit controlling the sensible heat flux. The relative evaporation (Λr) is calculated from the sensible heat flux at wet (Hwet) and dry (Hdry) limits (Su, 2002).
The pre-packaged SEBS model under ILWIS is applied in this work. Considering crop evolution, essentially cereal crops only six 10 d periods are considered: the first 10 d of January (dec1), March (dec7), April (dec10), May (dec13), July (dec19), and September (dec25).
3.3 Comparison of AET-BBH and AET-SEBS estimations
Eighteen 10 d periods (six periods times 3 years) were considered to achieve comparison for each basin. Daily AET-SEBS are summed over 10 d periods and spatially aggregated at the level of the basin to be compared to BBH estimates. The agreement between the actual evapotranspiration estimates is based on regression and box-plot analysis.
Observation periods for BBH calibration are shown in Table 1. The long-term annual water balance is written as
where P, R, and E respectively average long-term precipitation, runoff, and AET. It is found that AET contribution to water balance varies from 49 % to 84 % which highlights its importance in this region. The results of estimating soil texture parameters SFC (capacity field), p (effective soil porosity), and Ks (saturated hydraulic conductivity) are shown in Table 1. The final number of solutions varies from 6 to 13 depending on the basin. The range of selected parameters under the equifinality framework is shown in Table 2.
Table 1BBH model parameters (SFC, Ks, p) and observed ratios of mean annual AET to rainfall and runoff to rainfall.
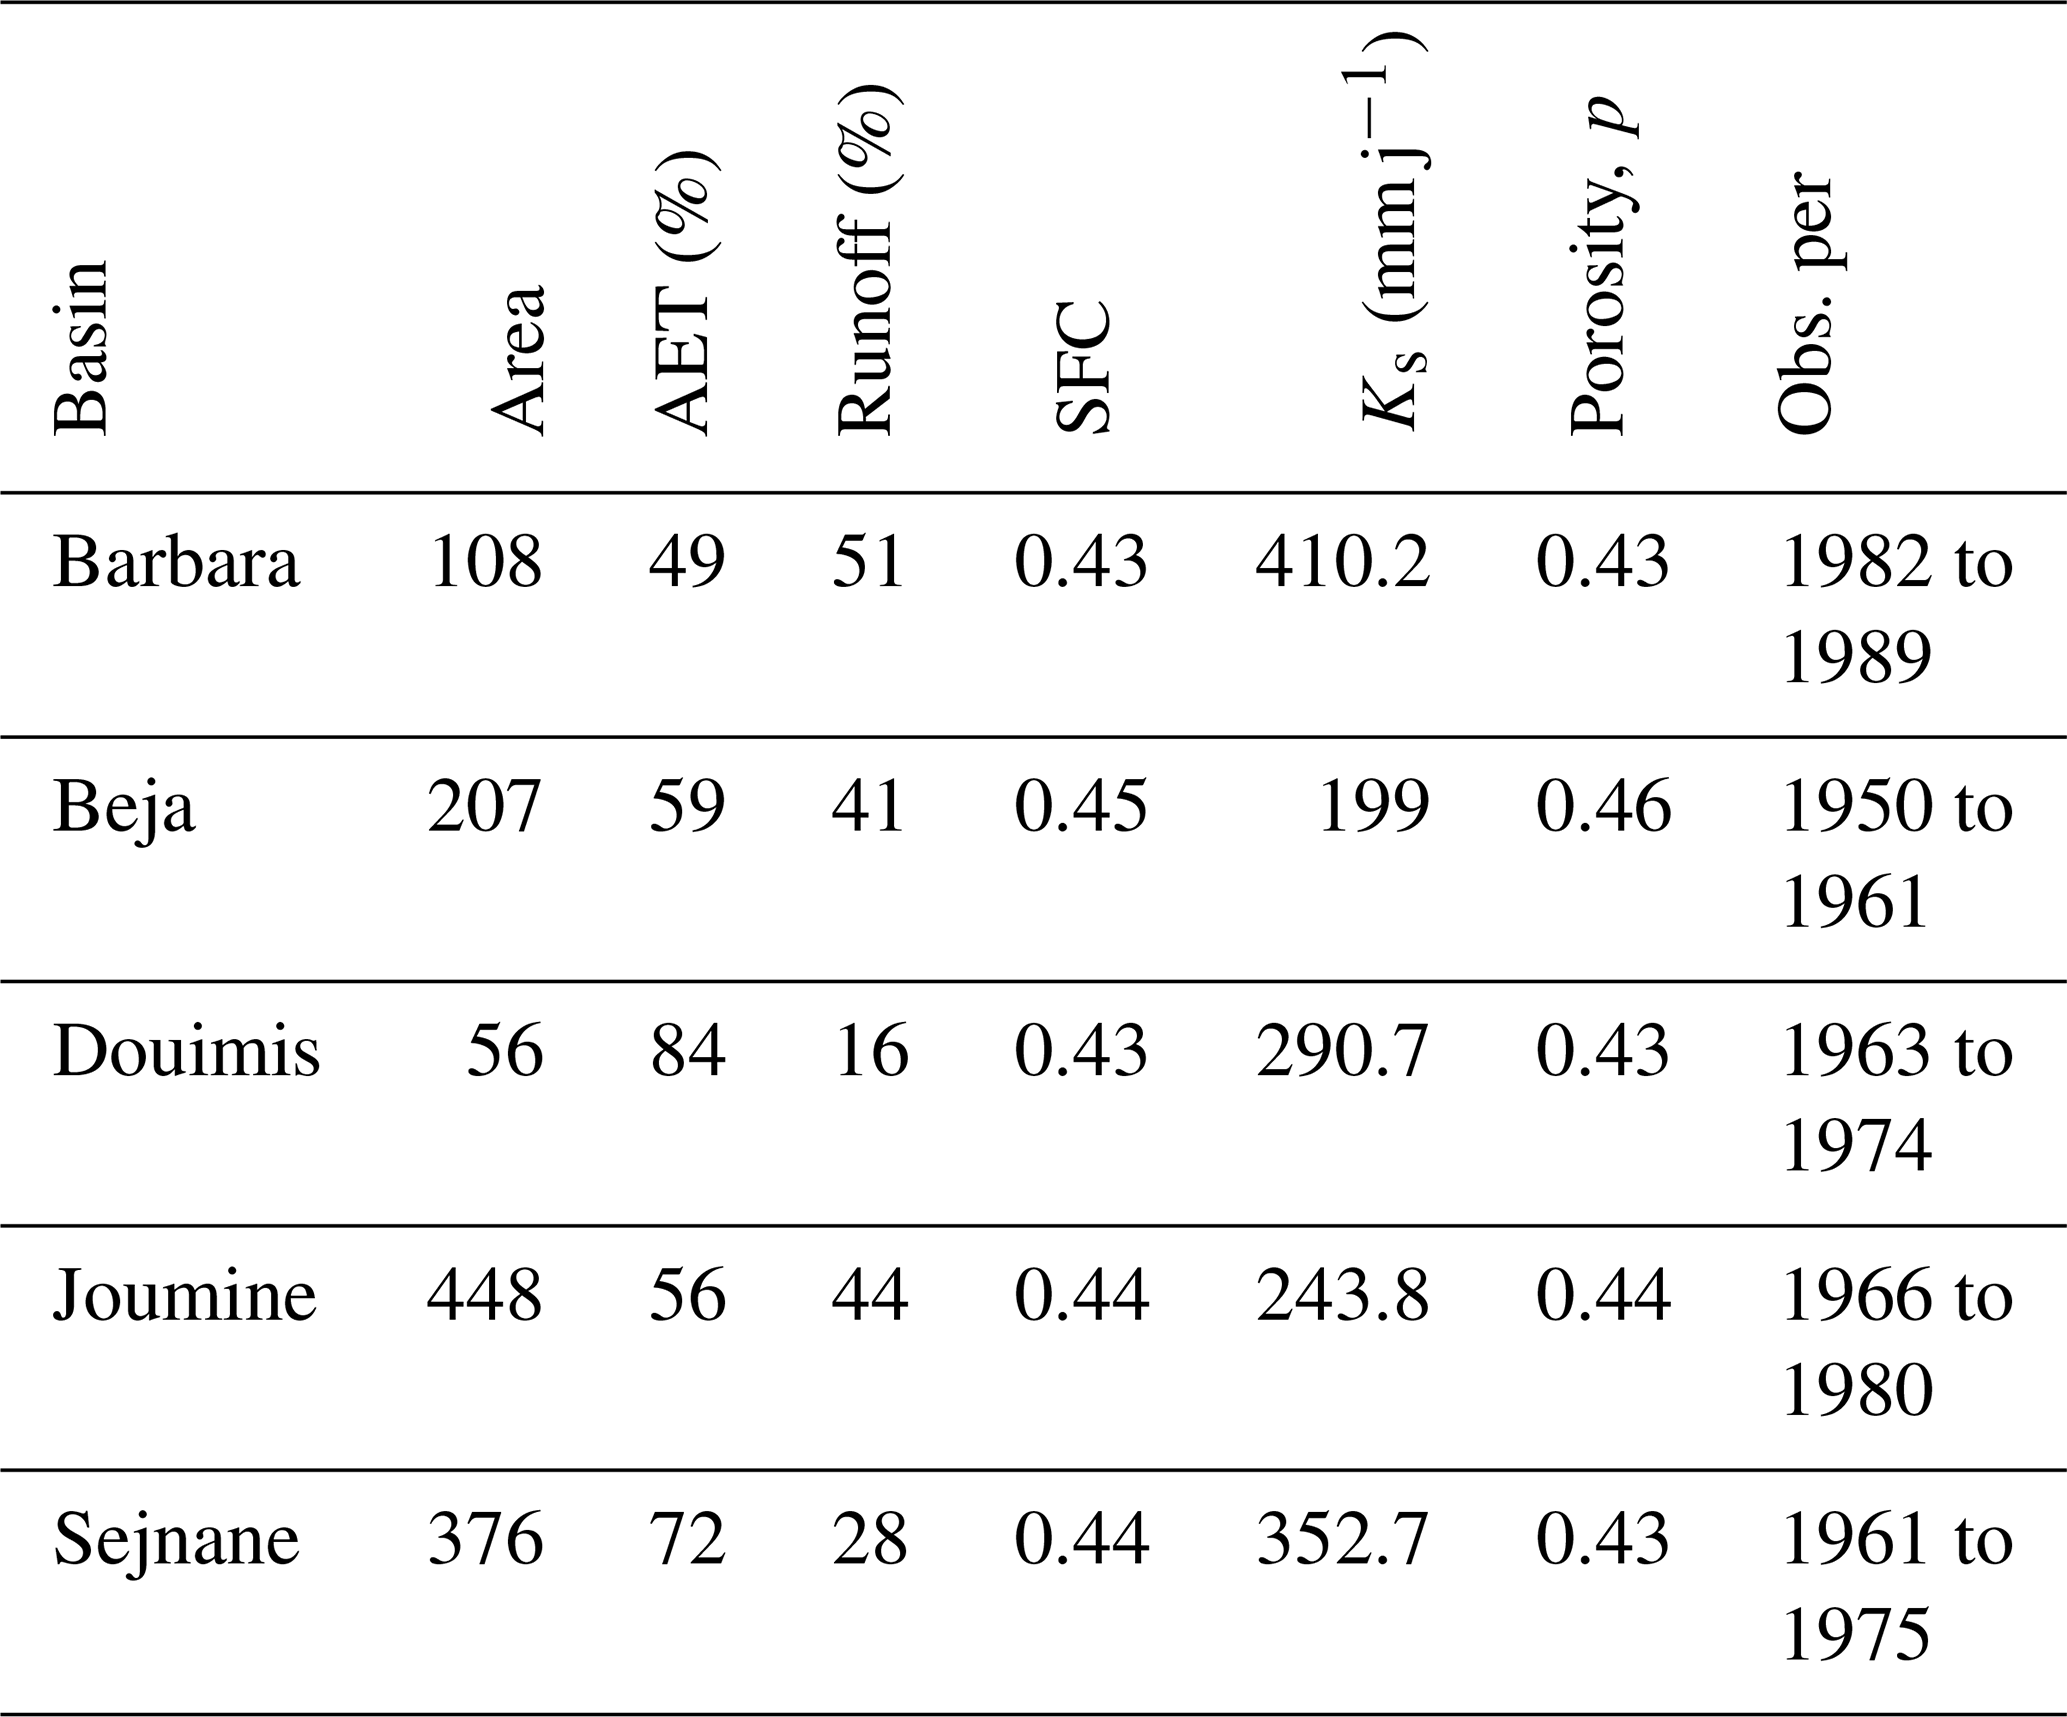
Table 2Range of BBH model parameters (D, η, σ) resulting from the calibrated period for each basin.
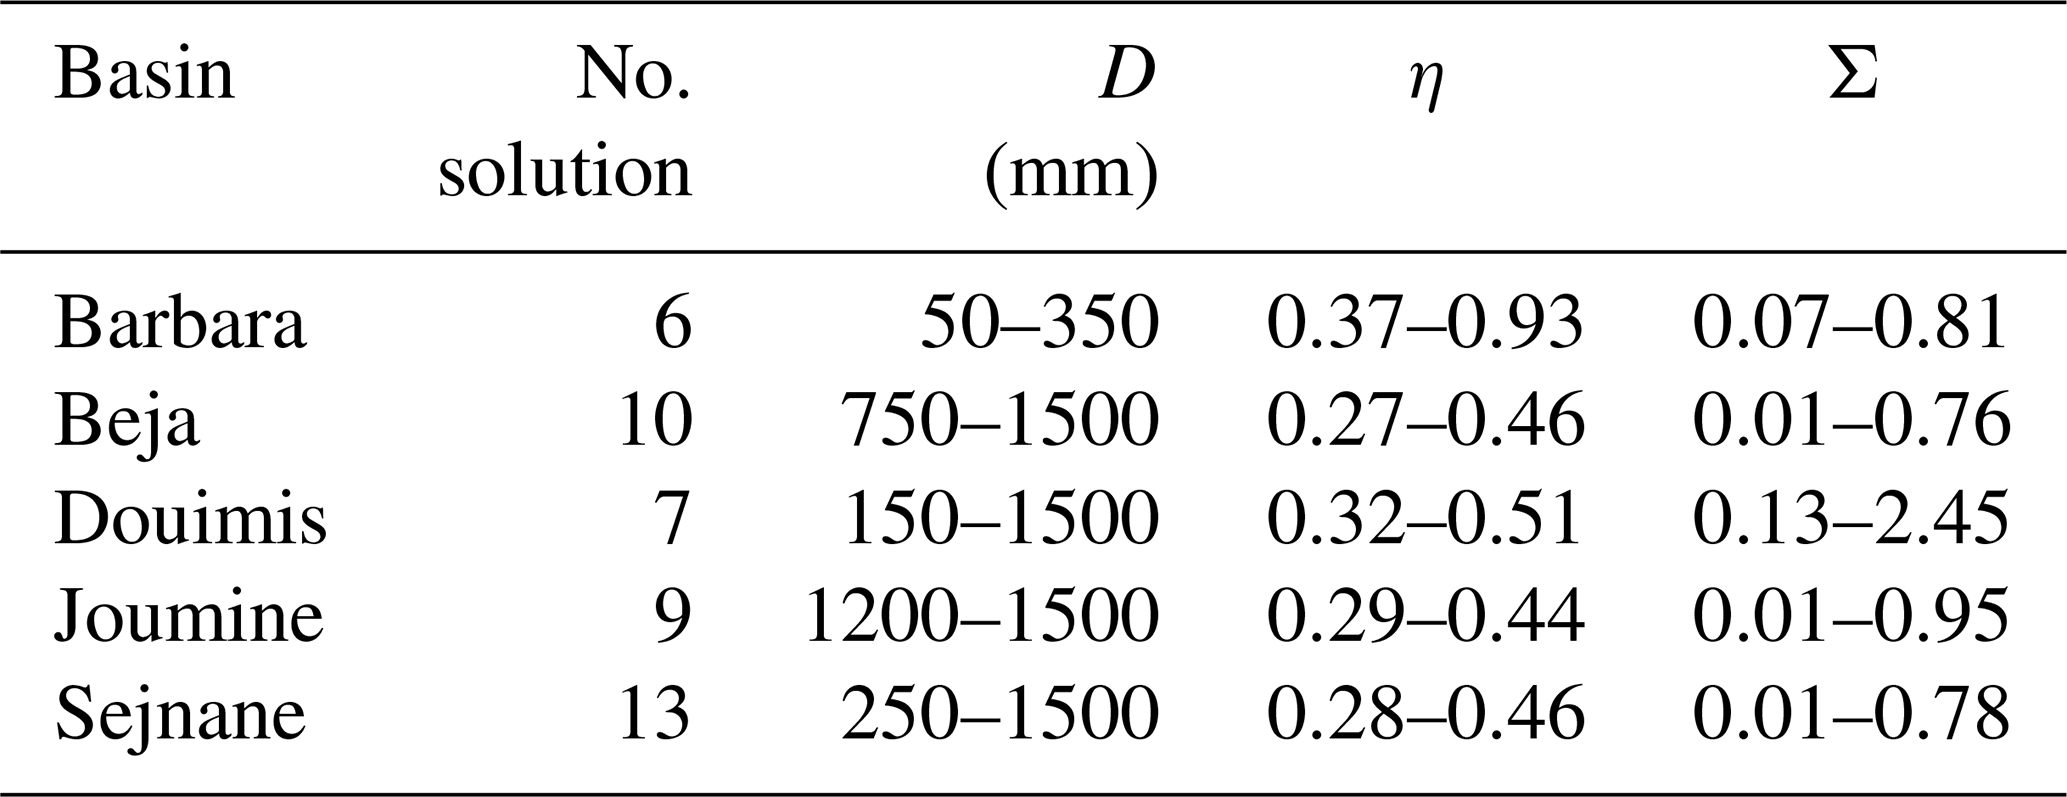
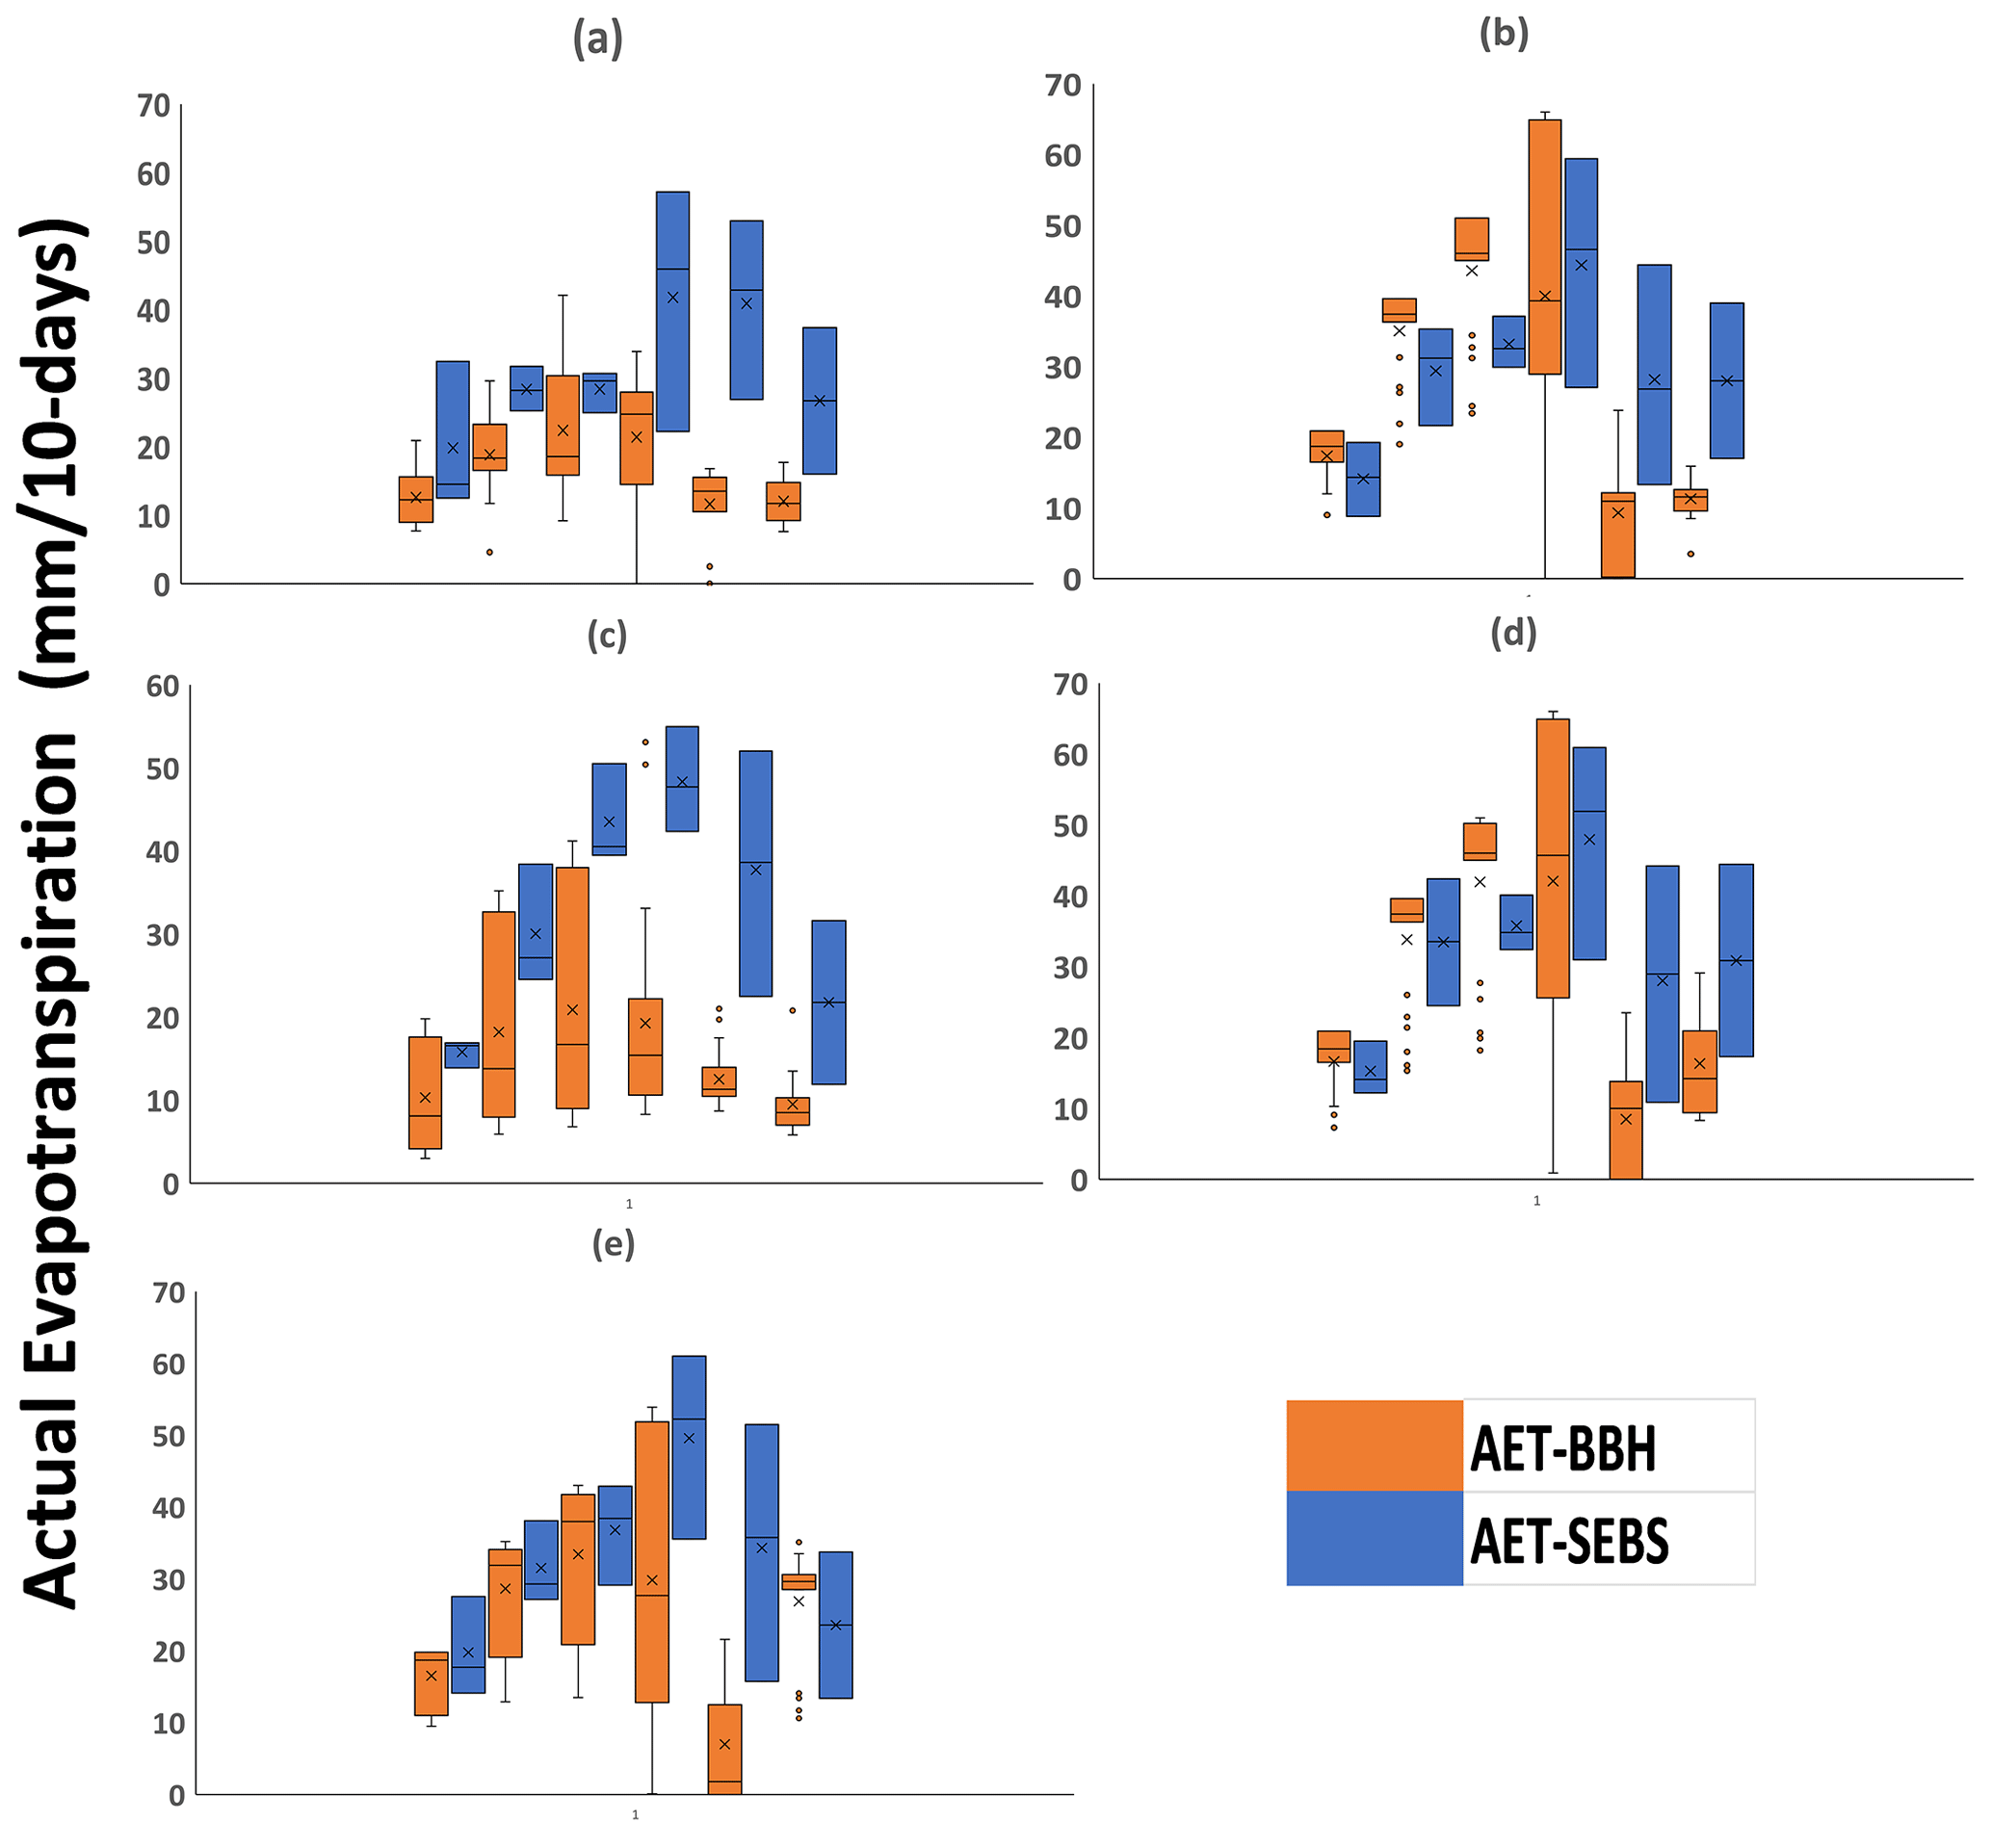
Figure 2 shows the scatterplot per basin using the best solution. For Beja and Douimis basins, significant coefficients of determination are obtained (R2= 0.6) and (R2= 0.5) respectively. Contrary to Barbara, Joumine, and Sejnane with R2≤ 0.4. Merging results of all basins and periods, the MAE is found at 19 mm 10 d−1 and the RMSE at 17 mm 10 d−1. Boxplots of AET-BBH and AET-SEBS estimations per period (6 periods) and basin (5 basins) are presented in Fig. 3. It highlights that AET-SEBS values go well with the set of AET-BBH values described in boxes for the wet season which correspond to the first 10 d of January, March, April, and May, and are not satisfactory for the dry season corresponding to the first 10 d of July and September unless for Joumine and Sejnane basins.
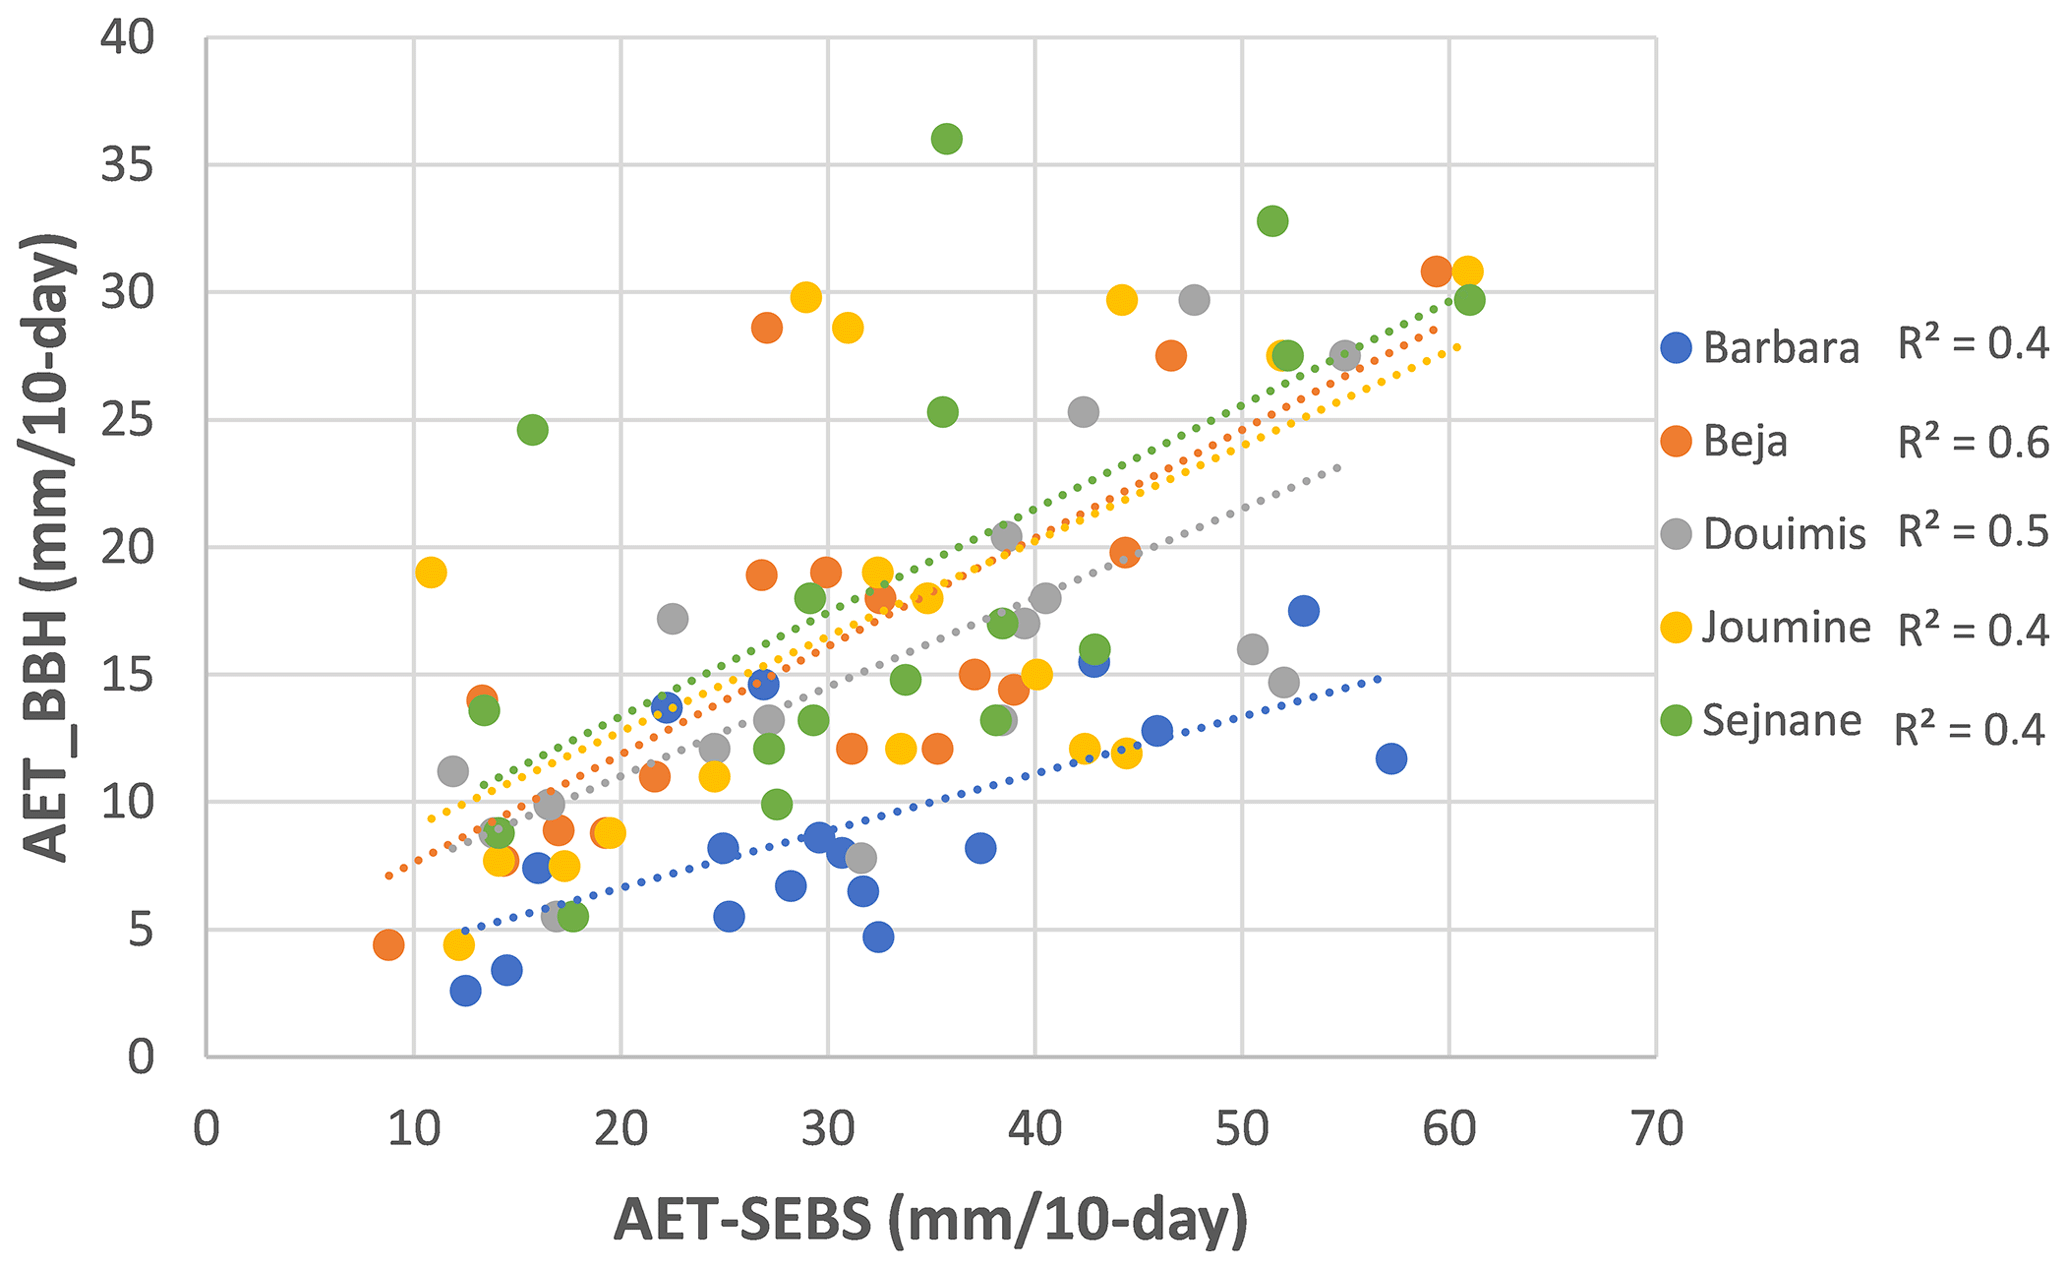
Figure 2Scatter plot of actual evapotranspiration simulated by BBH model (AET-BBH) and derived by the SEBS model (AET-SEBS) at the level of five basin and 10 d periods of 2010, 2017, and 2018.
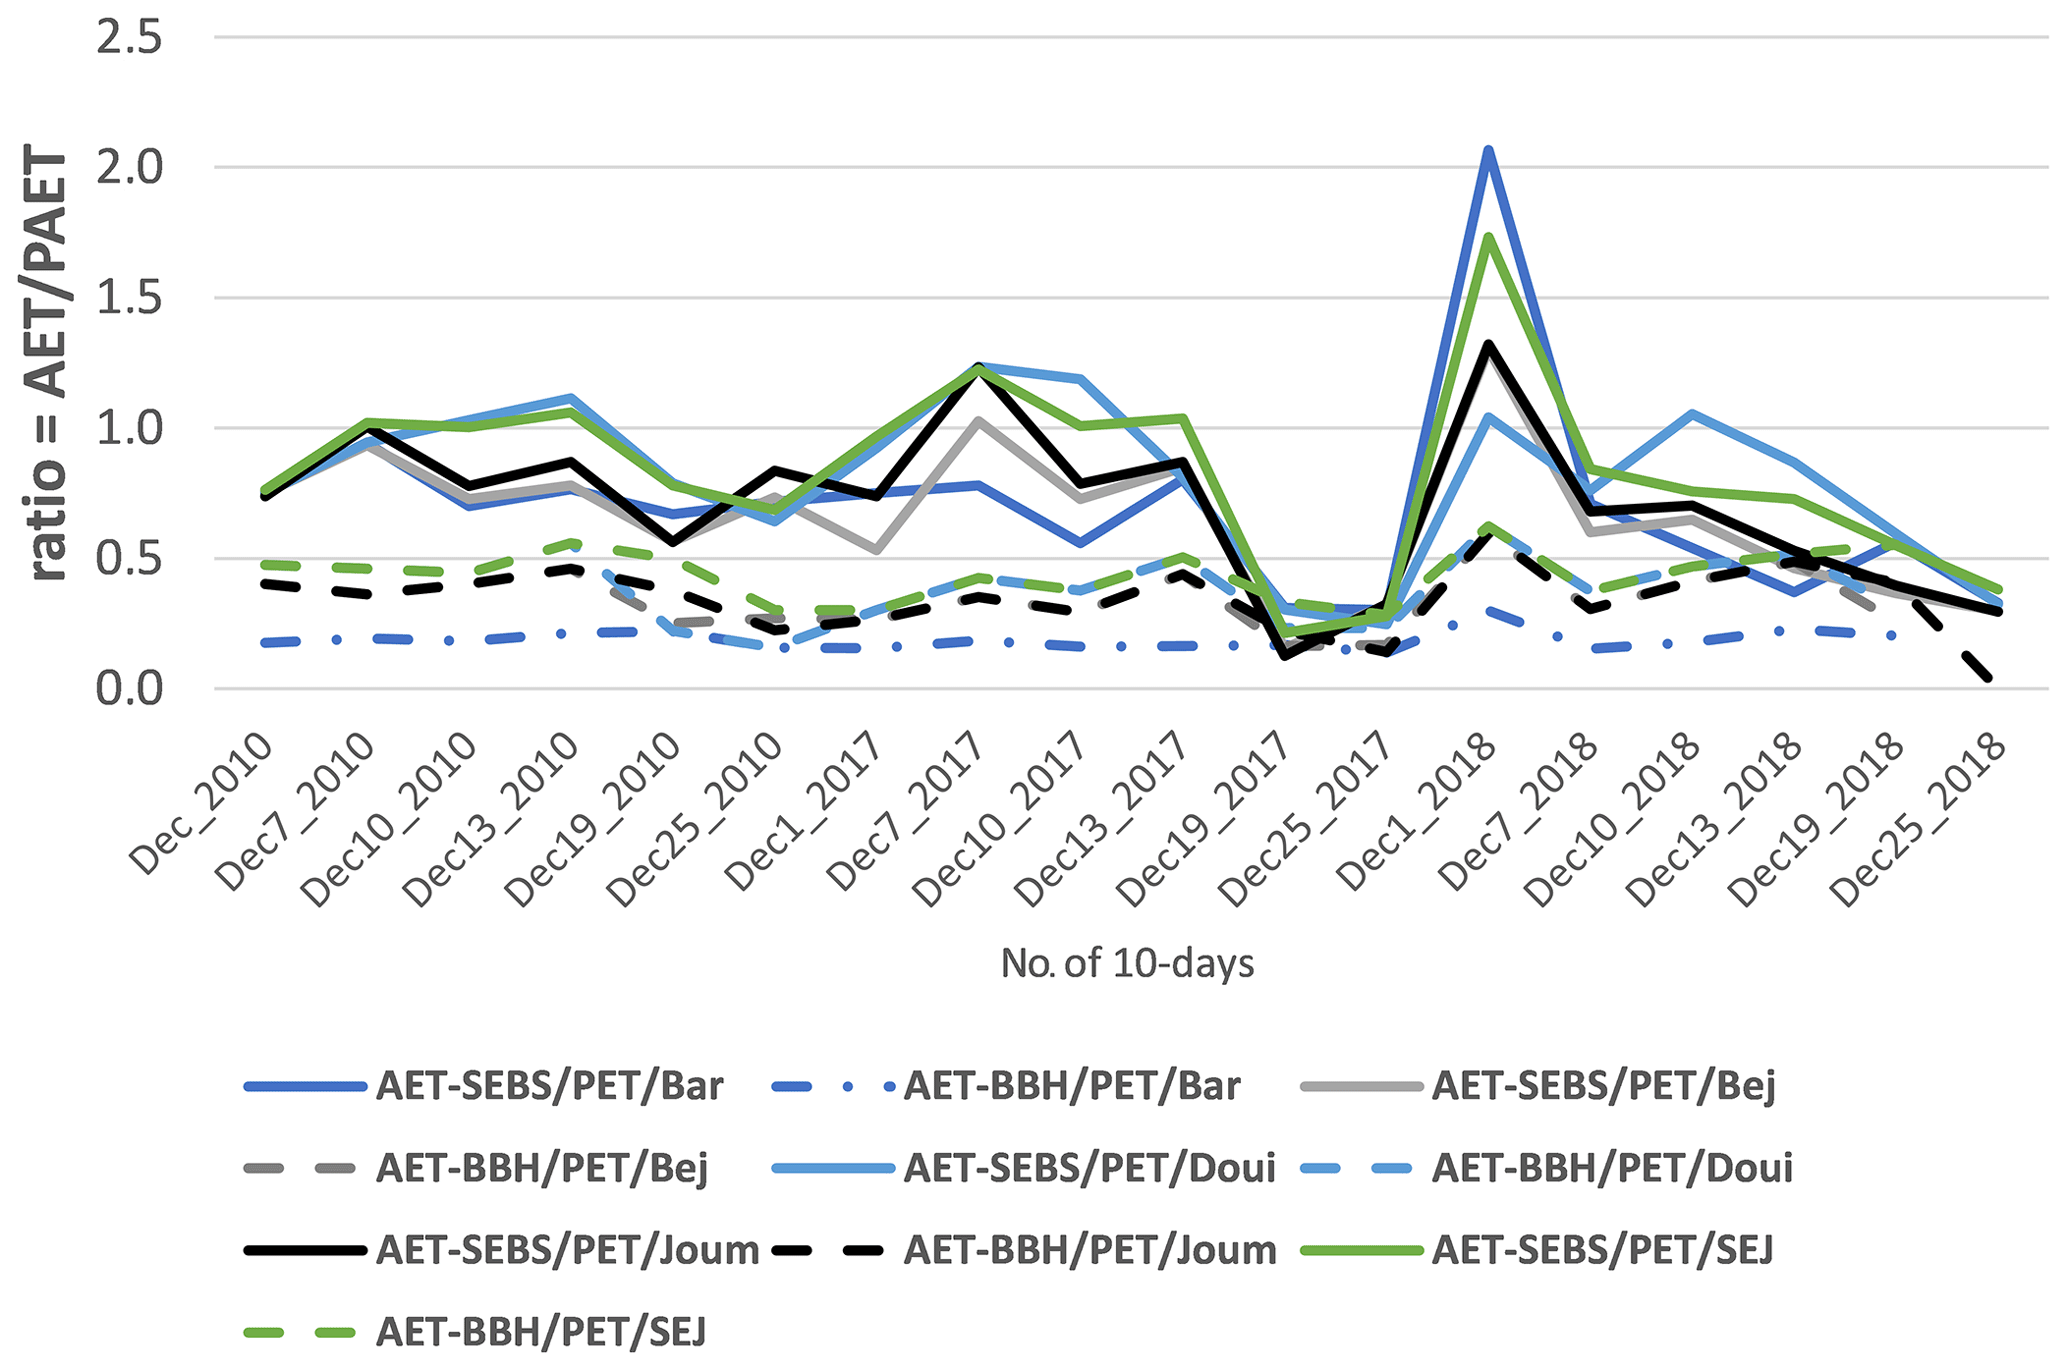
AET estimations are constrained by PET with AET ≤ PET meaning that the ratio should verify the condition AET/PET ≤ 1. Figure 4 shows the time evolution of this ratio for both SEBS and BBH results. The condition is naturally met for BBH. However, it is seen that it is not obvious using SEBS estimations. The pre-packaged SEBS model seems to overestimate AET in northern Tunisia. The same result is found by Lu et al. (2012) and Gibson et al. (2011) over a semi-arid heterogeneous surface. They explain this discrepancy (overestimation) due to the complexity of the SEBS model which uses several parameters. These researchers indicate that the analysis of the remote sensing product and the interpolation of meteorological data over a semi-arid heterogeneous surface can be the potential source of errors that can be spread through the processing sequence. Likewise, studies by Gokmen et al. (2012), and Lu et al. (2012) indicate that in varied landscapes where classes of different land cover are combined into a single pixel, the SEBS model underestimates sensible heat flux leading to an overestimation of AET. As approved by Lu et al. (2012), the SEBS model overestimates evaporative fraction below complex characteristics of the surface cover. As highlighted by Huang et al. (2015), AET overestimation is high in arid and semi-arid areas due to the dominant water stress condition which is approved by our case study as the 3 chosen years are declared as stressed years.
Two models are selected to assess the actual evapotranspiration in northern Tunisia at the basin scale. The SEBS model adopts surface energy balance modeling and Satellite data (LST, DSSF, LAI, NDVI, Albedo) as well as ground meteorological data. The lumped hydrological model (BBH) is based on water balance modeling and ground data. Parameters of the BBH model are calibrated concerning two performance criteria using two thresholds: absolute relative bias < 0.2 and the Nash coefficient > 0.75 and adopting an equifinality framework. The set of calibrated parameters (D, η, σ) with the best value of Nash criteria is adopted to calculate the AET. Values vary from 10 to 60 mm 10 d−1 depending on the periods. We underline an overestimation of AET-SEBS compared to AET-BBH with a mean absolute error (MAE) and a root means square error RMSE of about 17 and 19 mm 10 d−1. Therefore, other models and products as MOD 16 and LSA SAF AET should be investigated for estimating actual evapotranspiration in northern Tunisia.
The SEBS model is included under Ilwis environment which is free at https://www.itc.nl/ilwis/download/ilwis33/ (University of Twente, 2024). The code of the BBH model was developed The code of the BBH model was developed under the programming language Fortran by Zoubeida Bargaoui and we have no permission to publish it.
The hydrometeorological data are not publicly accessible. These data are purchased from the National Institute of Meteorology of Tunisia, and we have not been allowed to publish the observed data.
NA: satellite data, data processing, SEBS model running, writing. ZB: calculation code, ground data, supervision, writing. ABJ: run of the BBH model. CMM: know-how on using satellite data and the SEBS model.
The contact author has declared that none of the authors has any competing interests.
Publisher's note: Copernicus Publications remains neutral with regard to jurisdictional claims made in the text, published maps, institutional affiliations, or any other geographical representation in this paper. While Copernicus Publications makes every effort to include appropriate place names, the final responsibility lies with the authors.
This article is part of the special issue “IAHS2022 – Hydrological sciences in the Anthropocene: Past and future of open, inclusive, innovative, and society-interfacing approaches”. It is a result of the XIth Scientific Assembly of the International Association of Hydrological Sciences (IAHS 2022), Montpellier, France, 29 May–3 June 2022.
This paper was edited by Christophe Cudennec and reviewed by two anonymous referees.
Bargaoui, Z. and Houcine, A.: Sensitivity to calibration data of simulated soil moisture related to drought indices, Science et changements planétaires / Sécheresse, 21, 294–300, https://doi.org/10.1684/sec.2010.0263, 2010.
Bastiaanssen, W. G. M., Menenti, M., Feddes, R. A., and Holtslag, A. A. M.: A remote sensing surface energy balance algorithm for land (SEBAL). 1. Formulation, J. Hydrol., 212/213, 198–212, https://doi.org/10.1016/S0022-1694(98)00253-4, 1998.
Ben Jaafar, A. and Bargaoui, Z.: Generalized Split-Sample Test Interpretation Using Rainfall-Runoff Information Gain, J. Hydrol. Eng., 25, 04019057, https://doi.org/10.1061/(ASCE)HE.1943-5584.0001868, 2020.
Beven, K. J.: A manifesto for the equifinality thesis, J. Hydrol., 320, 18–36, https://doi.org/10.1016/j.jhydrol.2005.07.007, 2006.
Coron, L., Andréassian, V., Perrin, C., Lerat, J., Vaze, J., Bourqui, M., and Hendrickx, F.: Crash testing hydrological models in contrasted climate conditions: An experiment on 216 Australian basins, Water Resour. Res., 48, W05552, https://doi.org/10.1029/2011WR011721, 2012.
Cosby, B. J., Hornberger, G. M., Clapp, R. B., and Ginn, T. R. A.: Statistical Exploration of the Relationships of Soil Moisture Characteristics to the Physical Properties of Soils, Water Resour. Res., 20, 682–690, https://doi.org/10.1029/WR020i006p00682, 1984.
Eagleson, P.: The evolution of modern hydrology, Adv. Water Resour., 17, 3–18, https://doi.org/10.1016/0309-1708(94)90019-1, 1994.
Gibson, L. A., Münch, Z., and Engelbrecht, J.: Particular uncertainties encountered in using a pre-packaged SEBS model to derive evapotranspiration in a heterogeneous study area in South Africa, Hydrol. Earth Syst. Sci., 15, 295–310, https://doi.org/10.5194/hess-15-295-2011, 2011.
Gokmen, M., Vekerdy, Z., Verhoef, A., Verhoef, W., Batelaan, O., and Tol, C.: Integration of Soil Moisture in SEBS for Improving Evapotranspiration Estimation under Water Stress Conditions, Remote Sens. Environ., 121, 261–274, https://doi.org/10.1016/j.rse.2012.02.003, 2012.
Huang, C., Li, Y., Gu, J., Lu, L., and Li, X.: Improving Estimation of Evapotranspiration under Water-Limited Conditions Based on SEBS and MODIS Data in Arid Regions, Rem. Sens.-Basel, 7, 16795–16814, https://doi.org/10.3390/rs71215854, 2015.
Kite, G. W.: Manual for the SLURP hydrological model, Natl. Hydrol. Res. Inst., Saskatoon, SK, Canada, 10, 120 pp., https://api.semanticscholar.org/CorpusID:128060145 (last access: 14 February 2024), 1997.
Kobayashi, T., Matsuda, S., Nagai, H., and Teshima, J.: A bucket with a bottom hole (BBH) model of soil hydrology, IAHS-AISH publication, 270, 41–45, https://api.semanticscholar.org/CorpusID:140579764 (last access: 14 February 2024), 2001.
Lu, J., Li, Z. L., Tang, R., Tang, B. H., Wu, H., Yang, F., Labed, F., and Zhou, G.: Evaluating the SEBS-estimated evaporative fraction from MODIS data for a complex underlying surface, Hydrol. Process., 27, 3139–3149, https://doi.org/10.1002/hyp.9440, 2012.
Liou, Y. A. and Kumar Kar, S.: Evapotranspiration estimation with remote sensing and various surface energy balance algorithms – a review, Energies, 7, 2821–2849, https://doi.org/10.3390/en7052821, 2014.
Maathuis, B., Mannaerts, C., Retsios, B., Schouwenburg, M., and Lemmens, R.: Geonetcast toolbox: installation, configuration and user guide of the Geonetcast Toolbox plug-in for ILWIS 3.7.2: XML version 1.3: e-book, University of Twente, Faculty of Geo-Information Science and Earth Observation (ITC), http://www.itc.nl/library/Papers_2012/general/GNC_Toolbox.pdf (last access: 14 February 2024), 2011.
Nash, J. E. and Sutcliffe, J. V.: River flow forecasting through conceptual model's part I – A discussion of principles, J. Hydrol., 10, 282–290, https://doi.org/10.1016/0022-1694(70)90255-6, 1970.
Rawls, W., Brakensiek, D., and Saxton, K.: Estimation of soil water properties, T. ASAE, 25, 1316–1320, https://doi.org/10.13031/2013.33720, 1982.
Riou, Ch.: Une formule empirique simple pour estimer l'évapotranspiration potentielle moyenne en Tunisie, Les cahiers de l'ORSTOM, Série Hydrologie Bondy, 17, 129–137, http://geoprodig.cnrs.fr/items/show/152353 (last access: 14 February 2024), 1980.
Roerink, G., Su, Z., and Menenti, M.: S-SEBI: A simple remote sensing algorithm to estimate the surface energy balance, Phys. Chem. Earth Pt. B, 25, 147–157, https://doi.org/10.1016/S1464-1909(99)00128-8, 2000.
Su, Z.: The Surface Energy Balance System (SEBS) for estimation of turbulent heat fluxes, Hydrol. Earth Syst. Sci., 6, 85–100, https://doi.org/10.5194/hess-6-85-2002, 2002.
University of Twente: ILWIS 3.3, https://www.itc.nl/ilwis/download/ilwis33/, last access: 14 February 2024.
Verner, D.: Tunisia in a Changing Climate: Assessment and Actions for Increased Resilience and Development, Word Bank Studies, https://doi.org/10.1596/978-0-8213-9857-9, ISBN: 978-0-8213-9857-9, e-ISBN: 978-0-8213-9858-6, 2013.
Wang, K. and Dickinson, R. E.: A review of global terrestrial evapotranspiration: observation, modeling, climatology, and climatic variability, Rev. Geophys., 50, RG2005, https://doi.org/10.1029/2011RG000373, 2012.