the Creative Commons Attribution 4.0 License.
the Creative Commons Attribution 4.0 License.
 | 19 Apr 2024
SAR, SARin, RDSAR and FF-SAR Altimetry Processing on Demand for Cryosat-2, Sentinel-3 & Sentinel-6 at ESA's Altimetry Virtual Lab
Jérôme Benveniste
Salvatore Dinardo
Luciana Fenoglio-Marc
Christopher Buchhaupt
Michele Scagliola
Marcello Passaro
Karina Nielsen
Marco Restano
Américo Ambrózio
Giovanni Sabatino
Carla Orrù
Beniamino Abis
This paper presents the RDSAR, SAR/SARin & FF-SAR altimetry processors available in the ESA Altimetry Virtual Lab (AVL) hosted on the EarthConsole® platform. An overview on processors and features as well as preliminary analyses using AVL output data are reported to demonstrate the quality of the ESA Altimetry Virtual Lab altimetry services. Soon additional processors from ESA research contracts will be added to the AVL portfolio to continue providing innovative solutions to the radar altimetry community.
- Article
(5010 KB) - Full-text XML
- BibTeX
- EndNote


UPH16; SDG6.5; Water Level; Synthetic Aperture Radar Altimetry; FF-SAR; SARvatore; SAMOSA+
Since 1970s radar altimetry plays a key role in supporting research activities on oceanography and climate change. In the last decade, with the advent of improved SAR & FF-SAR processing schemes (Raney, 1998; Egido and Smith, 2017) and advanced retrackers such as those of the SAMOSA family (Ray et al., 2015), radar altimetry demonstrated its capability to provide useful data in challenging areas such as polar regions, the coastal zone and in the inland water domain.
The European Space Agency (ESA) research contracts in the field of radar altimetry are constantly innovating processing baselines providing prototyped products tailored for specific areas of interest. The smooth provisioning of these innovative products to researchers is of upmost importance to improve official altimetry products from ESA's Cryosat-2, Sentinel-3 and Sentinel-6 missions.
This motivated ESA to support the development of a dedicated virtual space to allow users processing on-line and on-demand altimetry data with advanced customizable processing baselines not yet deployed in ESA official ground segments.
The EarthConsole® Altimetry Virtual Lab (AVL), funded by ESA, aims at providing a virtual space to (1) Support the Altimetry community in the development & operation of new Earth Observation applications and (2) Foster collaboration by leveraging on knowledge-sharing tools.
The Altimetry Virtual Lab has been developed on the new EarthConsole® platform (https://earthconsole.eu/, last access: 24 December 2023) and hosts the SARvatore (SAR Versatile Altimetric TOolkit for Research & Exploitation) family of processors which was previously available in the ESA Grid Processing On-Demand (G-POD) environment.
All Altimetry Virtual Lab services are available via the Network of Resources (NoR), an ESA initiative aiming at facilitating the use of cloud environments. Research, development, or pre-commercial projects may be eligible to receive a voucher to exploit the EarthConsole® Altimetry Virtual Lab services free of charge or at very competitive prices.
The scope of this presentation is to feature and provide an update on the SARvatore family of altimetry services portfolio for the exploitation of CryoSat-2, Sentinel-3 & Sentinel-6 data from L1A (FBR) data products up to RDSAR, SAR/SARin & FF-SAR Level-2 geophysical data products.
The Altimetry Virtual Lab is a virtual space hosted on the EarthConsole® platform (http://www.earthconsole.eu, last access: 24 December 2023) and designed on the needs of the altimetry community to support the development and operations of new Earth Observation applications, and foster collaboration by leveraging on knowledge-sharing tools.
To achieve these objectives, the Altimetry Virtual Lab offers:
-
P-PRO (Parallel Processing) and P-PRO ON DEMAND services. to perform bulk or on-demand processing with the SARvatore (SAR Versatile Altimetric Toolkit for Research & Exploitation) family of processors;
-
G-BOX (Algorithm Development and Execution Environment) service. to develop and test new algorithms and perform post-processing analyses on a virtual machine (VM) with fast access to the dataset offered by the Copernicus Data and Information Access Services – DIAS. The VM comes with the most commonly used software for altimetry data analysis already installed: Broadview Radar Altimetry Toolbox (BRAT) (http://www.altimetry.info/toolbox/, last access: 24 December 2023), Panoply (https://www.giss.nasa.gov/tools/panoply/download/, last access: 24 December 2023), Python and SNAP (https://step.esa.int/main/download/snap-download/, last access: 24 December 2023);
-
I-APP (Application Integration) service. to receive expert support for the integration of new processors which are not currently available in the EarthConsole® catalogue;
-
I-SHARE service. to take advantage from a set of tools to network with colleagues, keep up with the latest news and publications and share results from the altimetry domain.
Through the P-PRO & P-PRO ON DEMAND services, users can access the SARvatore (SAR Versatile Altimetric TOolkit for Research & Exploitation) family of processors which was previously available in the ESA Grid Processing On-Demand (G-POD) environment.
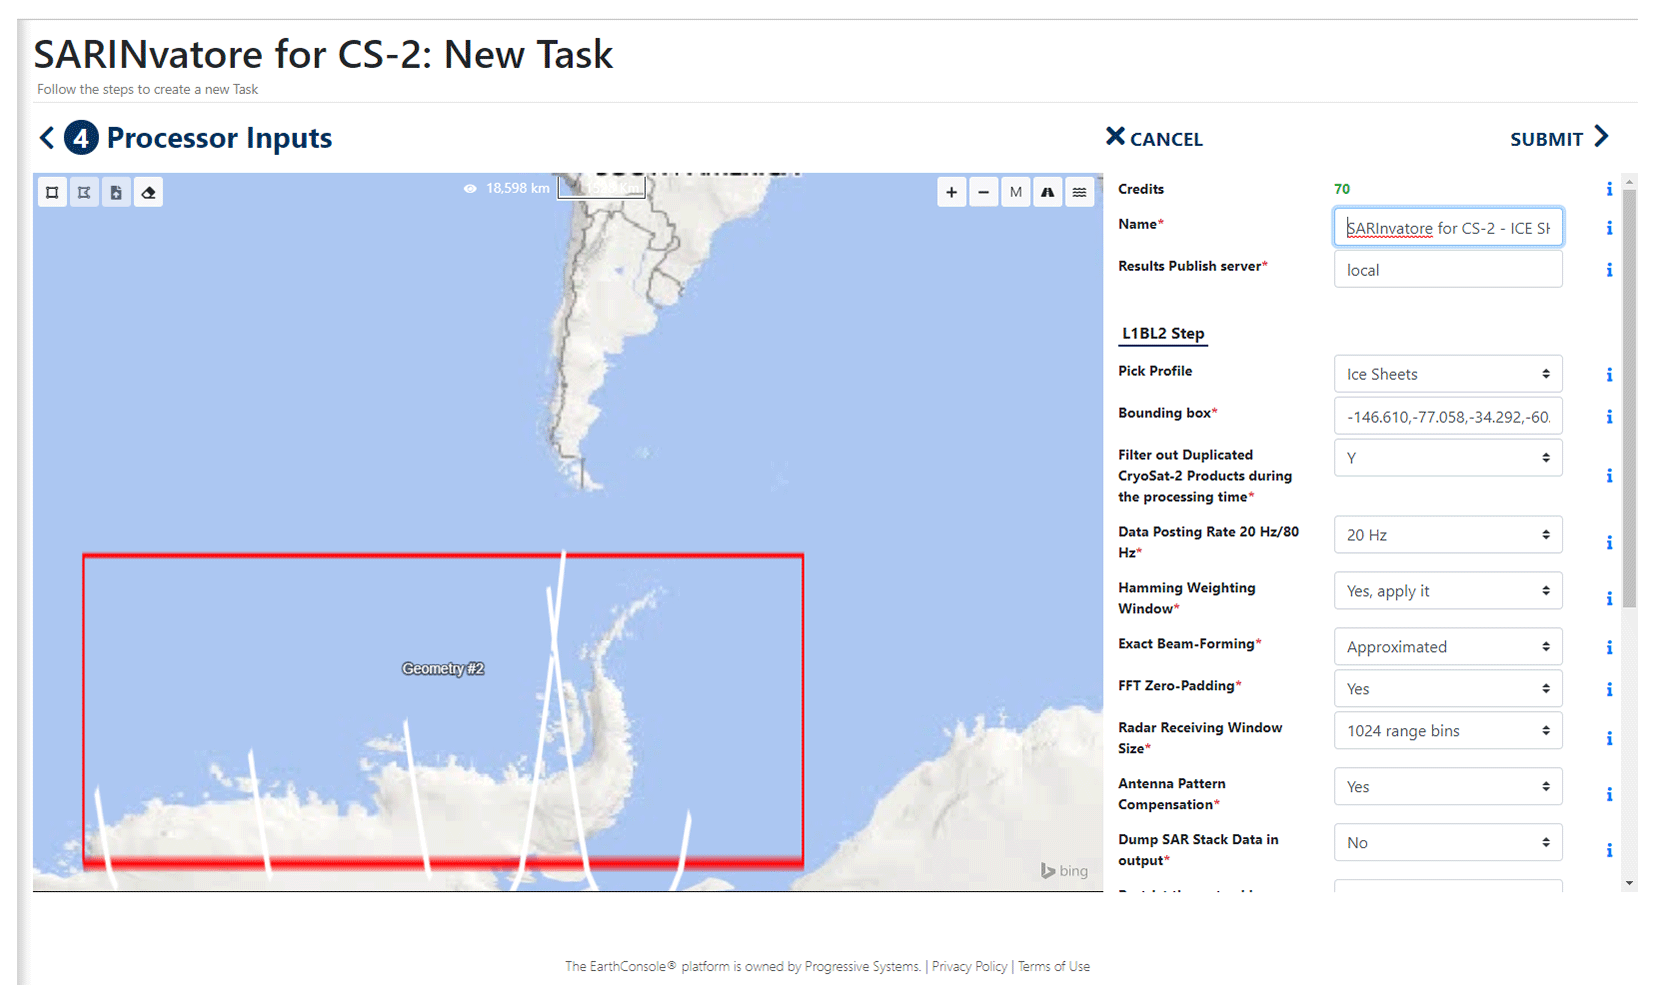
Figure 1AVL graphical interface showing the selected area of interest (red box) and the selectable processing options (image credit: https://earthconsole.eu/, last access: 24 December 2023).
The AVL graphical interface (Fig. 1) allows users to: (1) select, in all the services, a geographical area of interest within the time-frame related to the L1A (FBR) & L1b data products availability in the service catalogue, (2) set specific options to tailor the processing for the specific area of interest (e.g. open ocean, coastal zone, inland water, sea ice…).
After the task submission, users can follow, in real time, the status of the processing. The output data products are generated in standard NetCDF format, therefore being compatible with the multi-mission BRAT toolbox and typical tools.
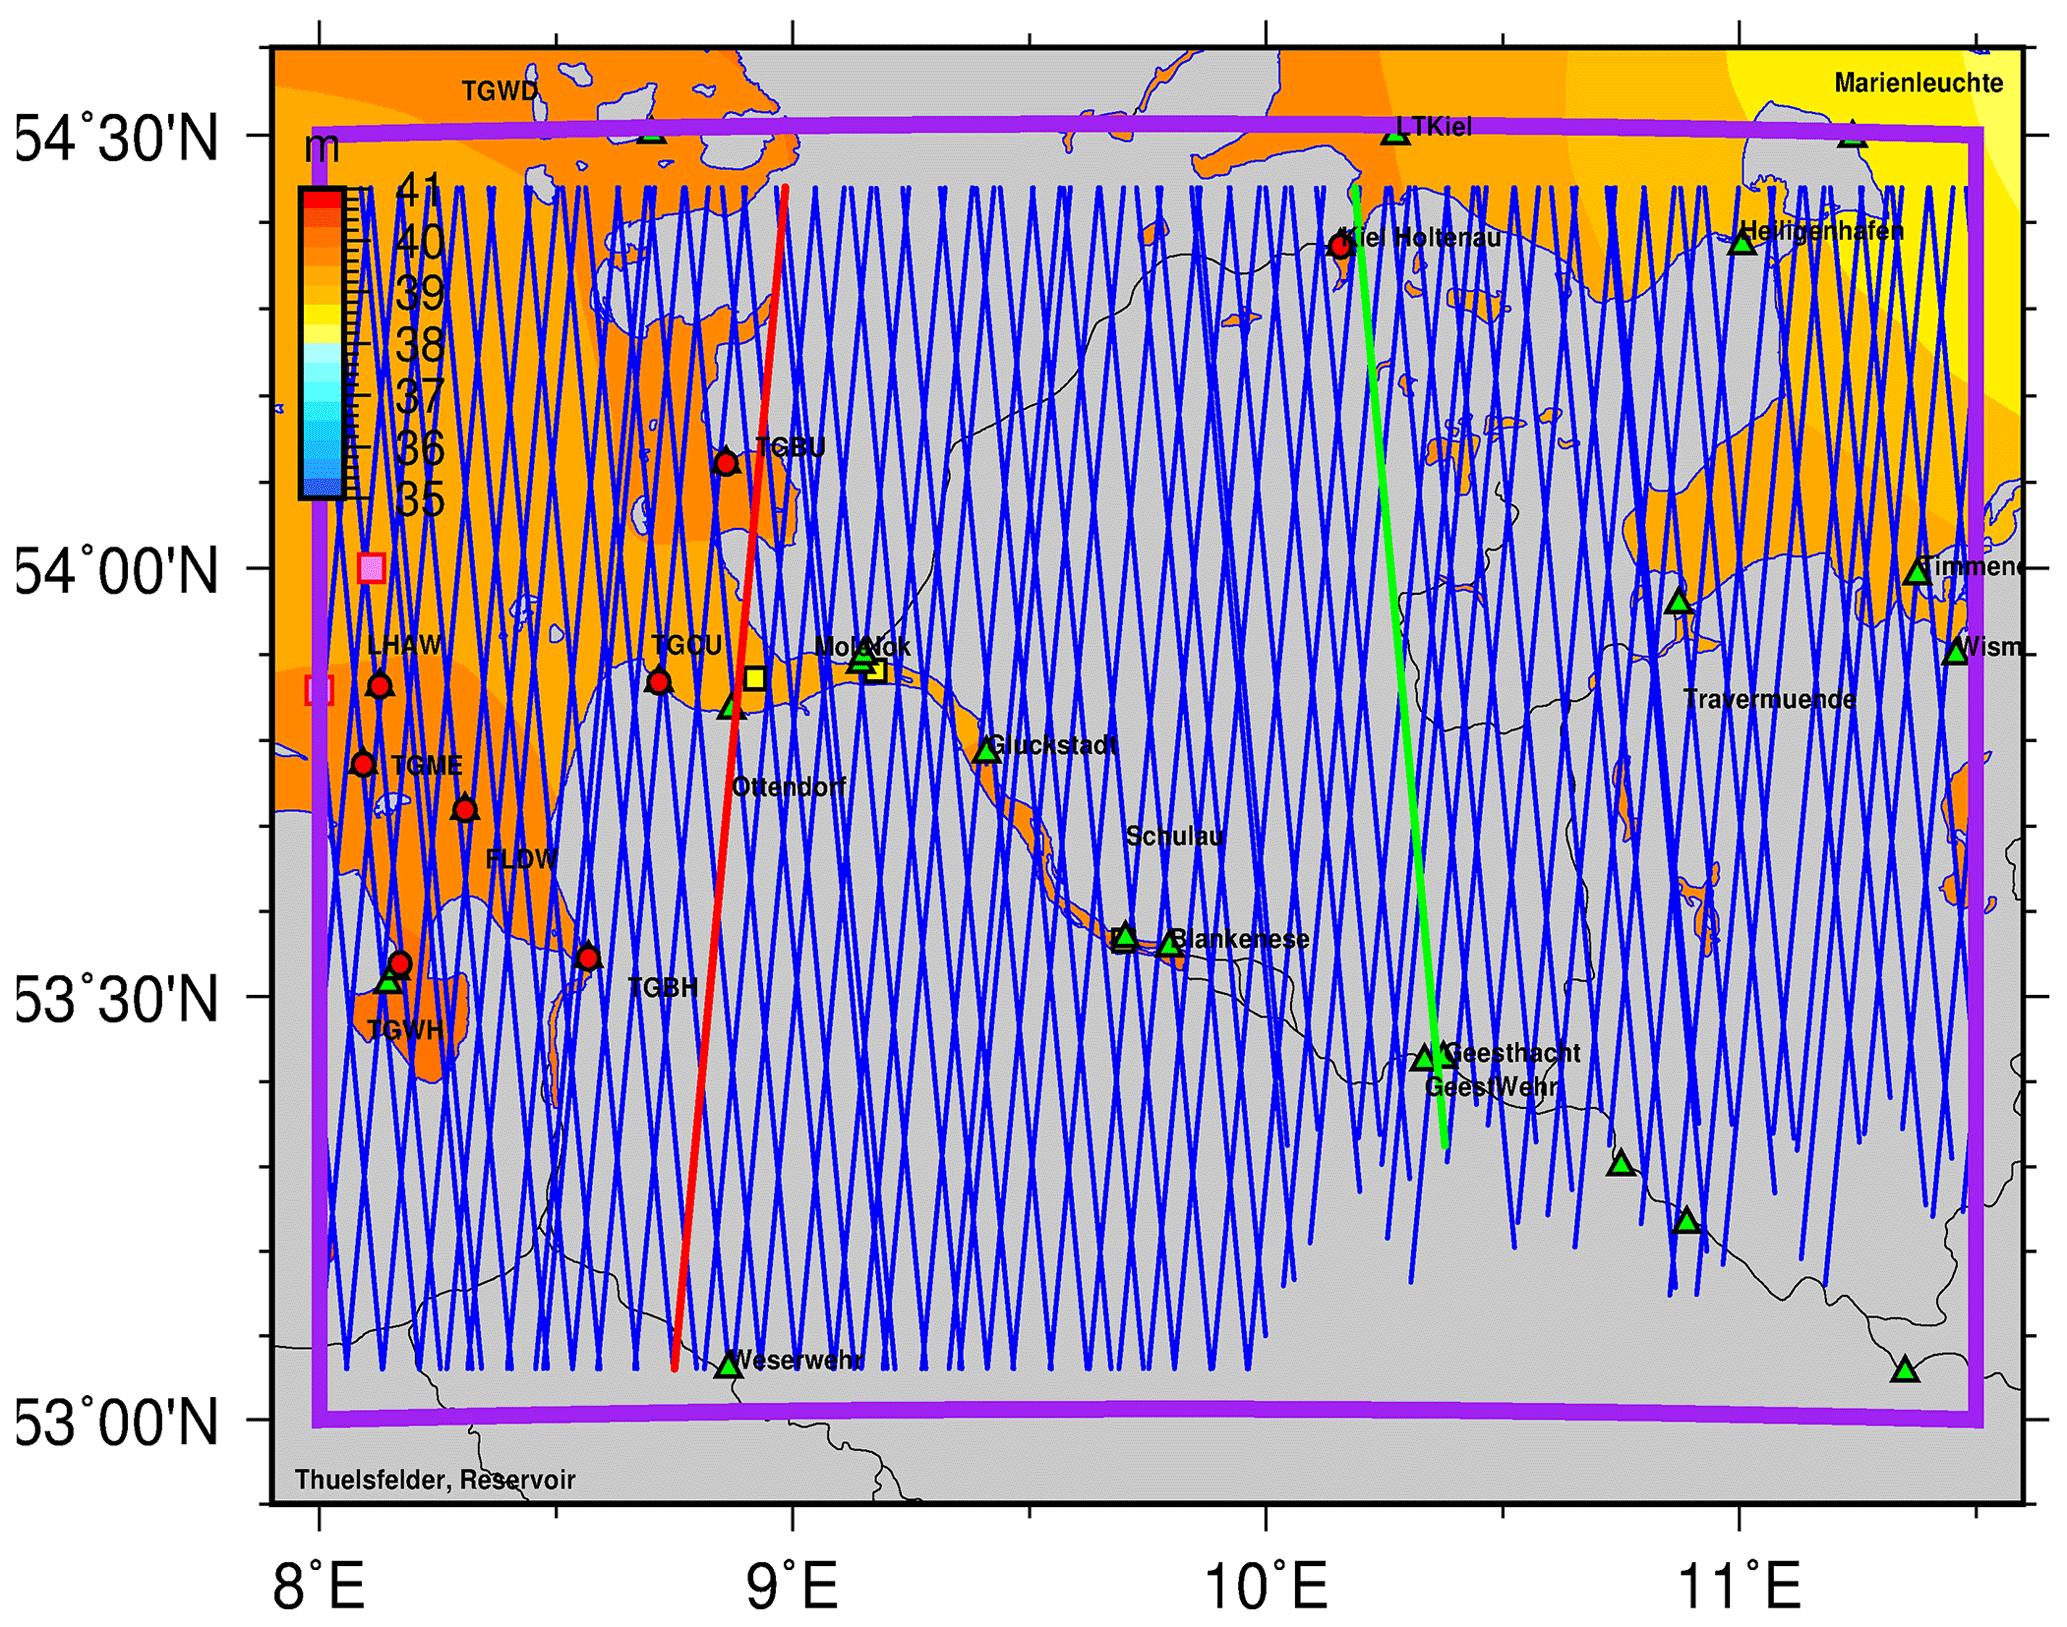
Figure 2CryoSat-2 ground-tracks in open sea and in Elbe estuary and river.
At present, the following processors are part of the portfolio:
-
The SARvatore (SAR Versatile Altimetric TOolkit for Research & Exploitation) for CryoSat-2 and Sentinel-3 services developed by the Altimetry Team in the R&D division at ESA-ESRIN. The SARvatore services are versatile and allow the users to customize and adapt the processing at L1b & L2 according to their specific requirements by setting a list of configurable options (ESA, 2013). The scope is to provide users with specific processing options not available in the operational processing chains (e.g. range walk correction, stack sub-setting, extended receiving window, zero padding, high-posting rate and burst weighting at L1b & SAMOSA+, SAMOSA++ and ALES+ SAR retrackers at L2).
-
The TUDaBo SAR-RDSAR (Technical University Darmstadt – University Bonn SAR-Reduced SAR) for CryoSat-2 and Sentinel-3 service (Buchhaupt et al., 2018; Buchhaupt, 2019). It allows users to generate reduced SAR, unfocused SAR & LRMC data. Several configurable L1b & L2 processing options and retrackers (BMLE3, SINC2, TALES, SINCS) are available. The processor will be extended during an additional activity related to the ESA HYDROCOASTAL Project (https://www.satoc.eu/projects/hydrocoastal/, last access: 24 December 2023) to account in the open ocean for the vertical motion of the wave particles (VMWP) in unfocused SAR (retracker SINCS-OV) and in a simplified form of the fully focused SAR called here Low Resolution Range Cell Migration Correction-Focused (LRMC-F).
-
The ALES + SAR for CryoSat-2 and Sentinel-3 service. It allows users to process official L1b data and produces L2 NetCDF products by applying the empirical ALES+ SAR sub-waveform retracker (Müller et al., 2020; Passaro et al., 2021), including a dedicated SSB solution, developed by DGFI-TUM in the frame of the ESA Sea Level CCI (http://www.esa-sealevel-cci.org/, last access: 24 December 2023) & BALTIC+ SEAL Projects (http://balticseal.eu/, last access: 24 December 2023).
-
The Aresys Fully Focused SAR for CryoSat-2, Sentinel-3 & Sentinel-6 services. They provide the capability to produce FF-SAR L1b products thanks to the Aresys 2D transformed frequency domain AREALT-FF1 processor prototype (Guccione et al., 2018). Output products also include geophysical corrections and threshold peak (Davis, 1997) & ALES-like empirical sub-waveform retracker estimates (ALES + FF-SAR).
In the next section, some analyses in the inland water domain are presented to demonstrate the potential of the SARvatore processors. A full description of the adopted processing options can be found here: https://earthconsole.eu/knowledge-base-2/processors-manuals/ (last access: 24 December 2023).
3.1 Elbe estuary
This case study analyses the CryoSat-2 data provided by the AVL Aresys FF-SAR processor over the Elbe estuary and river (Fig. 2). The time period from January 2019 and February 2020 includes a full CryoSat-2 geodetic orbit (ground track repeat cycle: 369 d). The selected setting for FFSAR is: multi-look posting rate 200 Hz (∼35 m separation between two consecutive estimates), zero padding applied (set to 2), bandwidth factor 0.5 (∼1 m resolution in the along-track direction), Threshold retracker (Davis, 1997). The goal is to investigate the quality of the FF-SAR data.
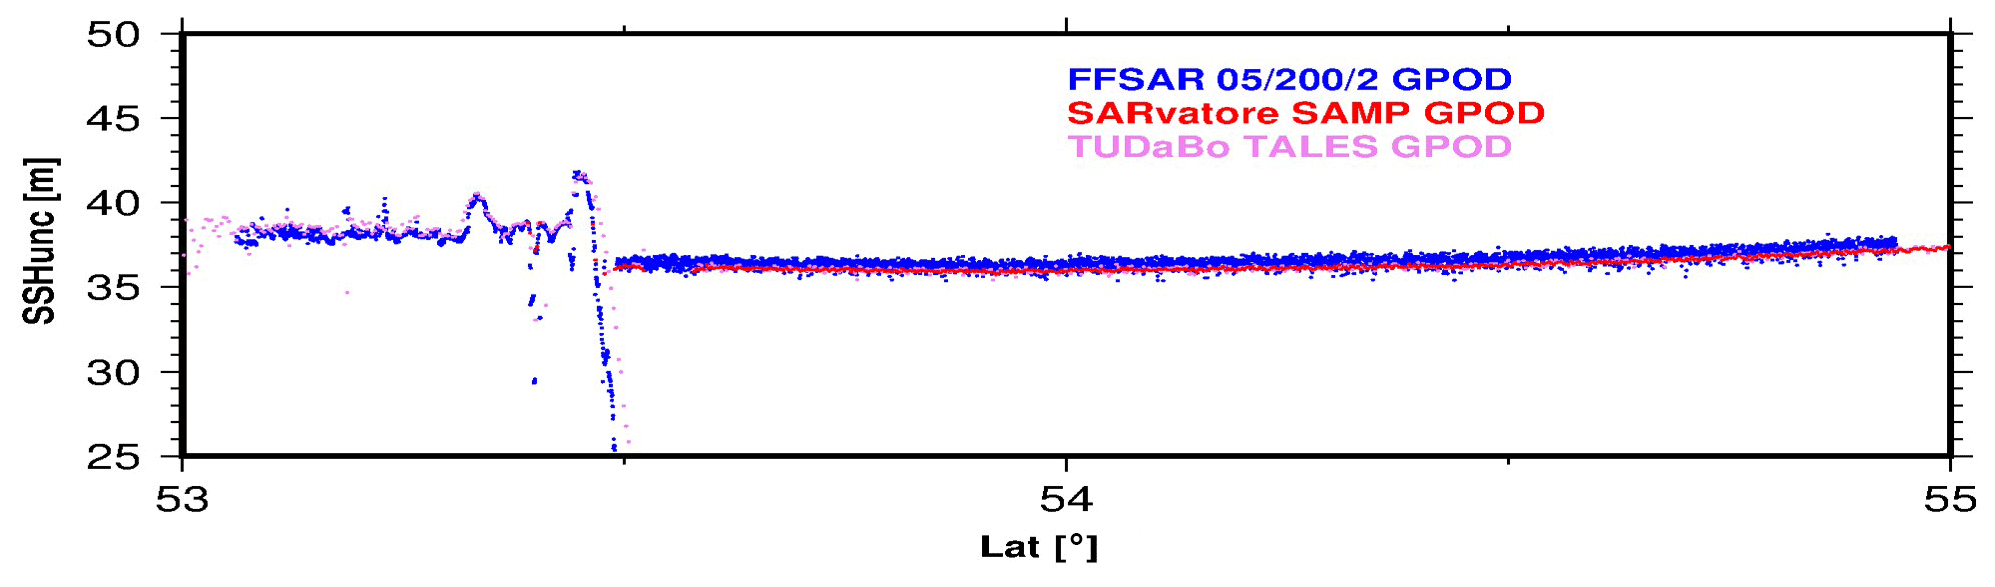
Figure 3Uncorrected heights in open sea from FF-SAR (blue), unfocused SAR (red) and reduced SAR (violet) along open sea ground-track location.
The river Elbe has about 300–400 m width between Geerstacht and Neue Darchau and is larger in the estuarine part which is affected by ocean tides. It ends in the German Bight at Ottendorf. The studied section is a downstream reach of ∼150 km long. From an along-track comparison in coastal and open ocean of FFSAR with EarthConsole® (former GPOD) SARVatore and TUDaBo unfocused SAR data (Fig. 3) at 20 Hz posting rate (∼300 m separation between two consecutive estimates), FF-SAR data look noisier than the other products. This is expected considering the improved resolution in along-track (∼1 m) w.r.t. conventional unfocused SAR (330 m resolution in the along-track direction).
In the estuarine intertidal and in river parts FF-SAR provides a smooth surface and more data due to its higher sampling.
3.2 Canadian River in the Mississippi basin
In this case study, CryoSat-2 data processed with the AVL Aresys FF-SAR processor over the Canadian River in the Mississippi basin were evaluated. This river has a width of a few hundred meters. The FF-SAR derived water levels were evaluated using ICESat-2 laser altimetry data and gauge data from the USGS (https://maps.waterdata.usgs.gov/mapper/index.html, last access: 24 December 2023).
In the study we considered water levels based on different retrackers including ALES+ FF-SAR and threshold retrackers. To enhance the amount of data we selected a posting rate of 500 Hz (∼14 m separation between two consecutive estimates) and the bandwidth of 0.5 (∼1 m resolution in the along-track direction). To compare the altimetry data to the gauge data we need to create a water level time series at the location of the gauge. We use the CryoSat-2 FF-SAR data and ICESat-2 data to compile a time series.
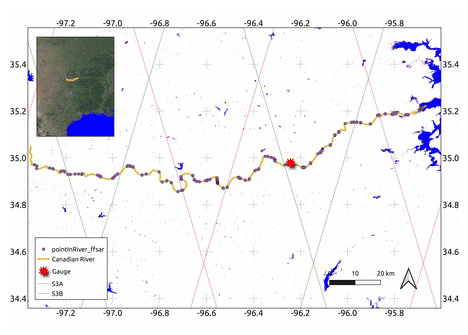
Figure 4Study area (aerial image: © Google Earth 2019).
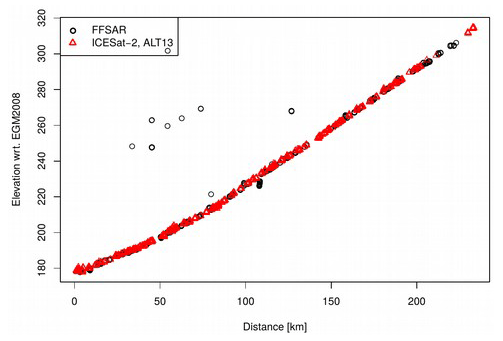
The time series is constructed using data available along a reach of approximately 200 km (Figs. 4 and 5).
Firstly, the data is projected to the centreline of the river. Providing the data as a function of space and time, the data is then combined via a state-space model (Nielsen et al., 2022).
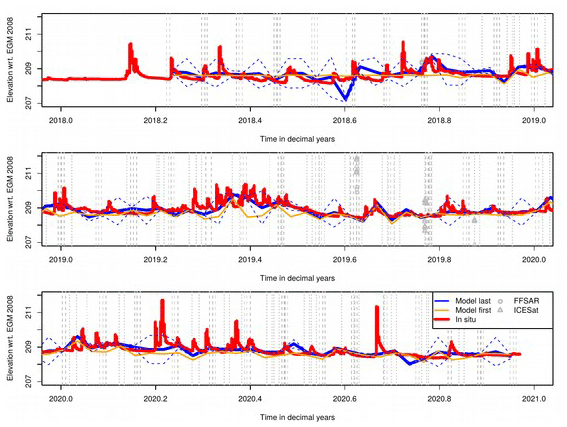
Figure 6The reconstructed water level time series (blue) compared to the gauge water levels (red). The grey lines indicate the times where data is available.
As seen in Fig. 6, we can identify the main water level signal. We find RMSE values of approximately 30 cm and a correlation of 0.6. The result is similar for all the retrackers.
3.3 Lake Bracciano
Lake Bracciano is of volcanic origin, located 32 km northwest of Rome. It is one of the major lakes of Italy and has a circular perimeter of approximately 32 km and a diameter of 7 km. Its in flow is from precipitation only as there are no inflowing rivers. As the lake serves as a drinking water reservoir for the city of Rome, it has been under control since 1986 to avoid the pollution of its waters.
Because of a drought that has hit Italy in 2017 and for the intensive water drainage by the Regional Water Supply Agency (ACEA), Lake Bracciano has suffered a significant drop of the water level between March and December 2017, as registered as well by in-situ measurements (https://braccianosmartlake.com, last access: 24 December 2023).
Since Sentinel-3A Orbit Number 213 over flies Lake Bracciano and considering the satellite's 27 d repeat period, water level variations detected by the SRAL altimeter can be regularly compared to insitu measurements to measure the performance of the instrument and the data processing algorithm estimating the radar range over such a very small lake.
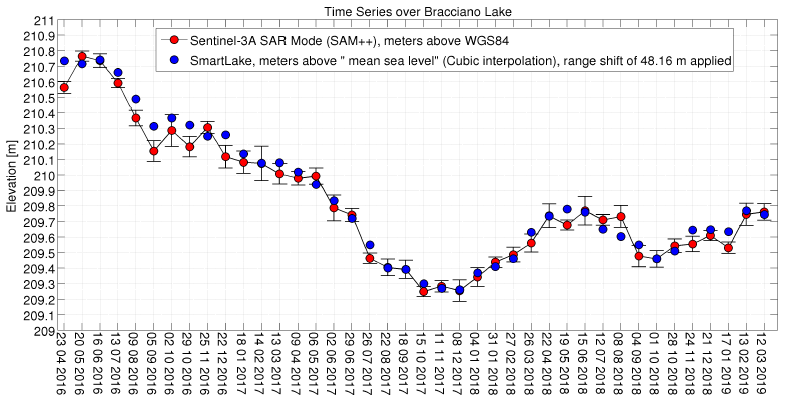
Figure 7The time series of the Bracciano Lake water level variation from April 2016 to March 2019 as measured by Sentinel-3A.
The time series of the Bracciano Lake water level variation since April 2016 to March 2019 as measured by Sentinel-3A is shown in Fig. 7 (red points). The data have been processed in the AVL SARvatore for Sentinel-3 service and retracked using the SAMOSA++ retracker (Dinardo et al., 2017). The insitu measurements provided by Bracciano Smart Lake web platform (https://braccianosmartlake.com, last access: 24 December 2023) are depicted in blue.
The standard of the difference (STDD) between altimetry and in-situ is about 6 cm whereas the error bar average size is around 4 cm. Both in-situ and altimetry data have recorded the drop of the lake water level occurred during summer 2017. The lake is then slowly recovering the pre-drought level.
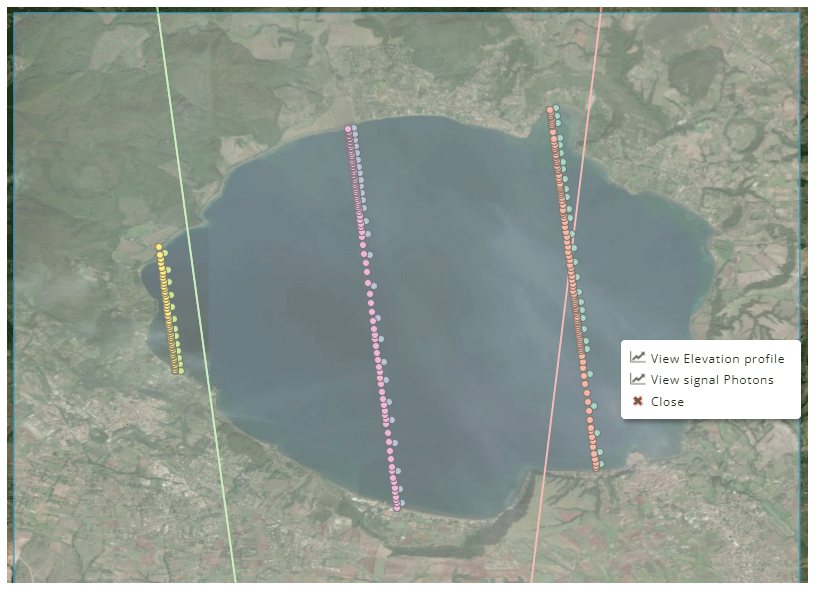
Figure 8Position of ICESat-2 tracks (crossing the lake) and estimates from its beams (see points inside the lake) over Lake Bracciano. Only in the optimal case measurements from all 6 beams are available (image credit: https://openaltimetry.org/data/icesat2/, last access: 24 December 2023).
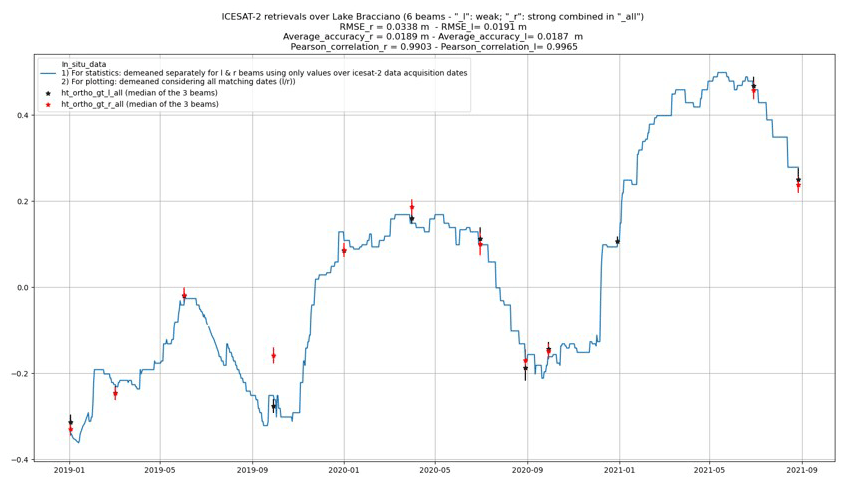
Figure 9Time series of the Bracciano Lake water level variation from January 2019 to September 2021 as measured by filtered ICESat-2 ATL13 data. In the title and legend “r” refers to strong beams and “l” to weak beams.
The ICESat-2 laser altimeter is also collecting measurements over lake Bracciano with its 6 beams (three pairs of strong and weak beams, Fig. 8). The repeat cycle of the mission is of 91 d. This laser altimeter generates individual laser footprints of nearly 14 m (in diameter). The ICESat-2 ATL13 products (available at https://openaltimetry.org/data/icesat2/, last access: 24 December 2023) are specialized geophysical data products that give along-track and near-shore water surface height distribution within the water masks.
Heights of surface water level is computed from strong beams (gt1r, gt2r, and gt3r) and weak beams (gt1l, gt2l, and gt3l). Data have been filtered to remove outliers using a typical mean SD criterion and quality flags (set as in Xu et al., 2021).
Then, at each date, the median of all available weak/strong beam estimates is taken and kept separated. In this way, there will be a “weak” orthrometric height time series (ht_ortho_gt_l_all) and a “strong” orthometric height time series (ht_ortho_gt_r_all). These can be seen in Fig. 9 along with the in-situ data time series.
The accuracy is taken as the standard deviation of the orthometric height time series.
Comparing to in-situ data, results in terms of RMSE are both at cm level (the “weak” time series performs better, RMSE is 1.9 vs. 3.3 cm, probably because of a non-negligible outlier in the `strong' time series around September 2019). Weak beams perform better also in providing one additional estimate around January 2021 which is missing in the strong beam time series. The accuracy is below 2 cm and the Pearson correlation is above 99 % for both time series.
As expected from the higher resolution of ICESat-2, associated with footprints not contaminated by the presence of land, the reported RMSE are lower than the one indicated for the unfocused SAR SAMOSA++ Sentinel-3 estimates in the first analysis of this subsection.
The unavailability of ICESat-2 data is severe in 2021 and this is probably due to the cloud coverage, which is along with the 91 d repeat cycle, the main limitation in using ICESat-2 data in the inland water domain.
As ICESat-2 data are not available through the ESA Altimetry Virtual Lab, the presented analysis aimed at providing an example of possible synergies between radar and laser altimetry.
This paper presented the ESA Altimetry Virtual Lab available on the EarthConsole® platform reporting some preliminary inland water altimetry analyses.
Soon additional processors from ESA research contracts will be added to the AVL portfolio to continue providing innovative solutions to the radar altimetry community.
Some training material and a brochure including all the information needed to access the services are available at: https://earthconsole.eu/knowledge-base/ (section “Earth Console Library”; Earth Console, 2021).
SAR and Fully-Focused SAR algorithms are freely available in Python through the ESA DeDop suite (https://dedop.org/; ESA, 2017) and the SMAP processor (https://github.com/cls-obsnadir-dev/SMAP-FFSAR; Guccione, 2018), respectively.
The conceptualization was done by JB and MR. JB ensured the funding acquisition, the project management and supervision. The methodology and software were developed, validated and reviewed by SD, LFM, CB, MS, MP, KN, AA, MR and JB. GS, BA and CO implemented the Altimetry Virtual Lab in the EarthConsole®. The original draft was prepared by MR. The review and editing were done by all authors.
The contact author has declared that none of the authors has any competing interests.
Publisher's note: Copernicus Publications remains neutral with regard to jurisdictional claims made in the text, published maps, institutional affiliations, or any other geographical representation in this paper. While Copernicus Publications makes every effort to include appropriate place names, the final responsibility lies with the authors.
This article is part of the special issue “IAHS2022 – Hydrological sciences in the Anthropocene: Past and future of open, inclusive, innovative, and society-interfacing approaches”. It is a result of the XIth Scientific Assembly of the International Association of Hydrological Sciences (IAHS 2022), Montpellier, France, 29 May–3 June 2022.
The ESA Altimetry Virtual Laboratory, hosted in the EarthConsole®, is funded by the European Space Agency via the contract number 4000135127/21/I-DT-lr.
This paper was edited by Christophe Cudennec and reviewed by two anonymous referees.
Buchhaupt, C.: Model Improvement for SAR Altimetry, PhD Thesis, University of Darmstadt, https://tuprints.ulb.tu-darmstadt.de/9015/ (last access: 24 December 2023), 2019.
Buchhaupt, C., Fenoglio-Marc, L., Dinardo, S., Scharroo, R., and Becker, M.: A fast convolution-based waveform model for conventional and unfocused SAR altimetry, Adv. Space Res., 62, 1445–1463, https://doi.org/10.1016/j.asr.2017.11.039, 2018.
Davis, C. H.: A robust threshold retracking algorithm for measuring ice-sheet surface elevation change from satellite radar altimeters, IEEE T. Geosci. Remote, 35, 974–979, https://doi.org/10.1109/36.602540, 1997.
Dinardo, S., Fenoglio, L., Buchhaupt, C., Becker, M., Scharroo, R., Fernandes, J. M., and Benveniste, J.: Coastal SAR and PLRM altimetry in German Bight and West Baltic Sea, Adv. Space Res., 62, 1371–1404, https://doi.org/10.1016/j.asr.2017.12.018, 2017.
Earth Console: Homepage, https://earthconsole.eu/knowledge-base/ (last access: 24 December 2023), 2021.
Egido, A. and Smith, W. H. F.: Fully Focused SAR Altimetry: Theory and Applications, IEEE T. Geosci. Remote, 55, 392–406, https://doi.org/10.1109/TGRS.2016.2607122, 2017.
ESA: Guidelines for the SAR (Delay-Doppler) L1b Processing, https://earth.esa.int/eogateway/documents/20142/37627/Guidelines-for-the-SAR-Delay-Doppler-L1b-Processing.pdf (last access: 24 December 2023), 2013.
ESA: The DeDop toolbox, ESA [code], https://dedop.org/ (last access: 24 December 2023), 2017.
Guccione, P., Scagliola, M., and Giudici, D.: 2D Frequency Domain Fully Focused SAR Processing for High PRF Radar Altimeters, Remote Sens.-Basel, 10, 1943, https://doi.org/10.3390/rs10121943, 2018 (code available at: https://github.com/cls-obsnadir-dev/SMAP-FFSAR, last access: 24 December 2023).
Müller, F., Passaro, M., Dettmering, D., and Baltic+ SEAL: Algorithm Theoretical Baseline Document (ATBD), Version 2.1. Technical report delivered under the Baltic+ SEAL project, https://doi.org/10.5270/esa.BalticSEAL.ATBDV2.1, 2020.
Nielsen, K., Zakharova, E., Tarpanelli, A., Andersen, O. B., and Benveniste, J.: River levels from multi mission altimetry, a statistical approach, Remote Sens. Environ., 270, 112876, https://doi.org/10.1016/j.rse.2021.112876, 2022.
Passaro, M., Müller, F. L., Oelsmann, J., Rautiainen, L., Dettmering, D., Hart-Davis, M. G., Abulaitijiang, A., Andersen, O. B., Høyer, J. L., Madsen, K. S., Ringgaard, I. M., Särkkä, J., Scarrott, R., Schwatke, C., Seitz, F., Tuomi, L., Restano, M., and Benveniste, J.: Absolute Baltic Sea Level Trends in the Satellite Altimetry Era: A Revisit, Front. Mar. Sci., 8, 647607, https://doi.org/10.3389/fmars.2021.647607, 2021.
Raney, R. K.: The delay/Doppler radar altimeter, IEEE T. Geosci. Remote, 36, 1578–1588, https://doi.org/10.1109/36.718861, 1998.
Ray, C., Martin-Puig, C., Clarizia, M. P., Ruffini, G., Dinardo, S., Gommenginger, C., and Benveniste, J.: SAR Altimeter Backscattered Waveform Model, IEEE T. Geosci. Remote, 53, 911–919, https://doi.org/10.1109/TGRS.2014.2330423, 2015.
Xu, N., Zheng, H., Ma, Y., Yang, J., Liu, X., and Wang, X.: Global Estimation and Assessment of Monthly Lake/Reservoir Water Level Changes Using ICESat-2 ATL13 Products, Remote Sens.-Basel, 13, 2744, https://doi.org/10.3390/rs13142744, 2021.
- Abstract
- Keywords
- Introduction
- Implementation and validation of SAR altimeter processing algorithms
- Analyses of water level in the inland water domain
- Conclusions
- Code and data availability
- Author contributions
- Competing interests
- Disclaimer
- Special issue statement
- Acknowledgements
- Review statement
- References