the Creative Commons Attribution 4.0 License.
the Creative Commons Attribution 4.0 License.
 | 19 Apr 2024
Bayesian inference of synthetic daily rating curves by coupling Chebyshev Polynomials and the GR4J model
Rafael Navas
Pablo Gamazo
R. Willem Vervoort
In fluvial dynamics studies, there are instances where it becomes necessary to estimate the daily discharge of a river in locations where only one instantaneous level record is available per day. In such cases, there may be no rating curve, or one that is unreliable, making it difficult to make accurate discharge estimates. A daily rating curve would be an estimate of the daily discharge of a river, from a single instantaneous stage level. This work proposes to estimate synthetic (non-gauged) daily rating curves from nearby gauged locations using a rainfall-runoff model. A rainfall-runoff model (GR4J) is coupled with an instantaneous/stage–daily/discharge relationship based on third order Chebyshev polynomials. The parameters in the joint daily rating curve and rainfall-runoff model are optimized and uncertainty is quantified with Bayesian inference and the Delayed Rejection Adaptive Metropolis algorithm assuming model residuals to be normally distributed N(0,σ). A case study with four gauging sites in New South Wales, Australia, and periods with no changes in the stage-discharge relationship were selected. The method is implemented four times across the gauging sites, where three sites are assumed gauged and one site is assumed to have only instantaneous water level records. The results of this methodology can help provide a more comprehensive understanding of the hydrological functioning of systems, where only one instantaneous stage level per day is available. This is particularly useful in situations where historical observations or satellite altimetry data in rivers is used to estimate daily flows.
- Article
(1937 KB) - Full-text XML
- BibTeX
- EndNote


UPH 16; UPH 17; modelling; new monitoring
Runoff time-series give valuable information for water resources. In practice, hydrometric stations measure only river stage. Runoff time series are estimated through the rating curve (RC), which is the relationship between paired instantaneous stage and discharge measurements (gaugings). RCs usually are approximated with a power law (WMO, 2010), but alternative approaches are polynomial regression, splines and fuzzy regression (Fenton, 2018; Jalbert et al., 2011; McMahon and Peel, 2019). Despite the plethora of techniques, building the RC is still complex since it depends on the availability of gaugings, variable hydraulic conditions, and understanding the physical process governing the stage-discharge relationship (Le Coz, 2012).
Piecewise relationships (Lee et al., 2010; Reitan and Petersen-Øverleir, 2009), hysteresis, backwater effects (Dottori et al., 2009; Hidayat et al., 2011; Kim et al., 2021; Petersen-Øverleir, 2006), changes in the river bed over time (Bhandari et al., 2023; Morlot et al., 2014), aquatic vegetation dynamics (Perret et al., 2021), or lack of gaugings (Lang et al., 2010; Pedersen et al., 2019; Reistad et al., 2007) are some limitations for building a RC. This is particularly true at low or high stages, where, for operational or safety reasons, gaugings are absent and extrapolation techniques are needed (Di Baldassarre and Claps, 2011; Lang et al., 2010; Reistad et al., 2007). Some example extrapolation techniques are conveyance slope, areal comparison of peak discharges, flood rooting, step backwater and hydraulic modelling (WMO, 2010). All these methods are based on the availability of instantaneous discharges and most of them require additional field information.
The quality of the rating curve data and approximation defines the uncertainty of the observed discharge and affects the performance of the hydrological model as well as the optimization procedure (McMillan et al., 2010; Sellami et al., 2013). But what happens if we take advantage of this link to estimate the rating curve? Perhaps due to the complexity of the problem, only a few authors have investigated this. For example: Sikorska and Renard (2017) re-calibrate the rating curve using a Bayesian framework which couples the rating curve with the hydrological model outputs, and therefore consider structural and parametric uncertainties in the discharge prediction. Jian et al. (2017) use only water levels and a hydrological model to make discharge predictions. They calibrate the model using Spearman Rank correlation and the inverse rating curve. Equifinality is crucial in these kinds of problems since the parameters of the hydrological model could compensate for the errors associated with the parametric uncertainty of the rating curve (Lima et al., 2019).
The aim of this work is to take advantage of the link between stream stage observations and hydrological model outputs to develop a framework to estimate daily discharge at sites with incomplete rating curves. The daily rating curve represents the relationship between an instantaneous water level within a day and the mean daily discharge. The concept is introduced to address the problem of scaling between instantaneous water level observations and discharge simulations. The size of the basin affects the sub-daily variability of discharge (Blöschl and Sivapalan, 1995), affecting the estimated mean daily discharge and the magnitude of estimated discharges is further influenced by the nonlinearity of the rating curve (Kiang et al., 2018). These factors add uncertainties to discharge computation. The working hypothesis is that parametric uncertainties from a daily rating curve model and a hydrological model can be quantified using Bayesian Inference, resulting in an estimate of the daily rating curve based on sparse or limited data. For example, this approach could be used to estimate rating curves in a cross-catchment approach where at some locations only one instantaneous level data per day is available, for example, based on satellite altimetry of rivers (Kittel et al., 2021).
The study area is located in the headwater of the Lachlan River, which flows from the Great Dividing Range into Wyangala Dam (a tributary of the Murray-Darling river system, New South Wales, Australia). Average annual rainfall is around 1100 mm; monthly precipitation being generally uniform throughout the year. Annual evaporation varies from 900 to 1200 mm with strong seasonal behaviour between winter and summer. Groundwater is governed by fractured rocks and topography.
Figure 1 shows the location of the gauging sites. The stage discharge relationships at the gauging sites are well known and have relatively dense data sets (Water Data Online, http://www.bom.gov.au/waterdata/, last access: 14 September 2023). The simulation period chosen is from 2008 to 2013 to maximize the data availability with no significant changes in the stage-discharge relationship. Generally, the scatter of percentage differences between instantaneous discharge and daily discharge increases as daily discharge increases (Fig. 2). These differences are normally distributed with a zero mean being more homogeneous as basin size increases (Fig. 2). Climatological forcing using mean areal daily values of potential evapotranspiration and precipitation for each basin was generated using the gridded SILO – Australian climate database (Scientific Information for Land Owners, https://www.longpaddock.qld.gov.au/silo/, last access: 11 September 2023), which provides values at an approximate 5 km grid scale. Potential evapotranspiration is calculated by the FAO56 Penman–Monteith formula. Further information about the interpolation techniques used in SILO can be found in Jeffrey et al. (2001).
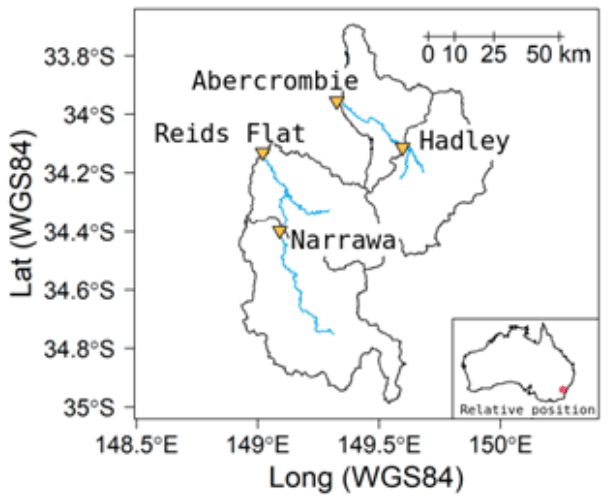
Figure 1Gauging sites of Abercrombie and Lachlan rivers: Lachlan River at Reids Flat (3742 km2), Lachlan River at Narrawa (2256 km2), Abercrombie River at Abercrombie (2636 km2), and Abercrombie River at Hadley (1635 km2).
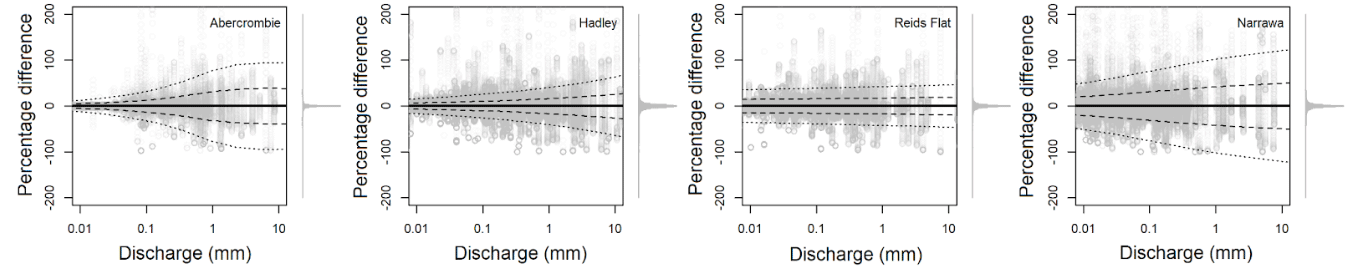
Figure 2Percentage difference of reported 15 min discharge and mean daily discharge as a function of daily discharge (lines: Generalised Additive Models for Location Scale and Shape, continuous line: 50th percentile, dashed line: 25–75th percentiles, pointed line: 5–95th percentiles).
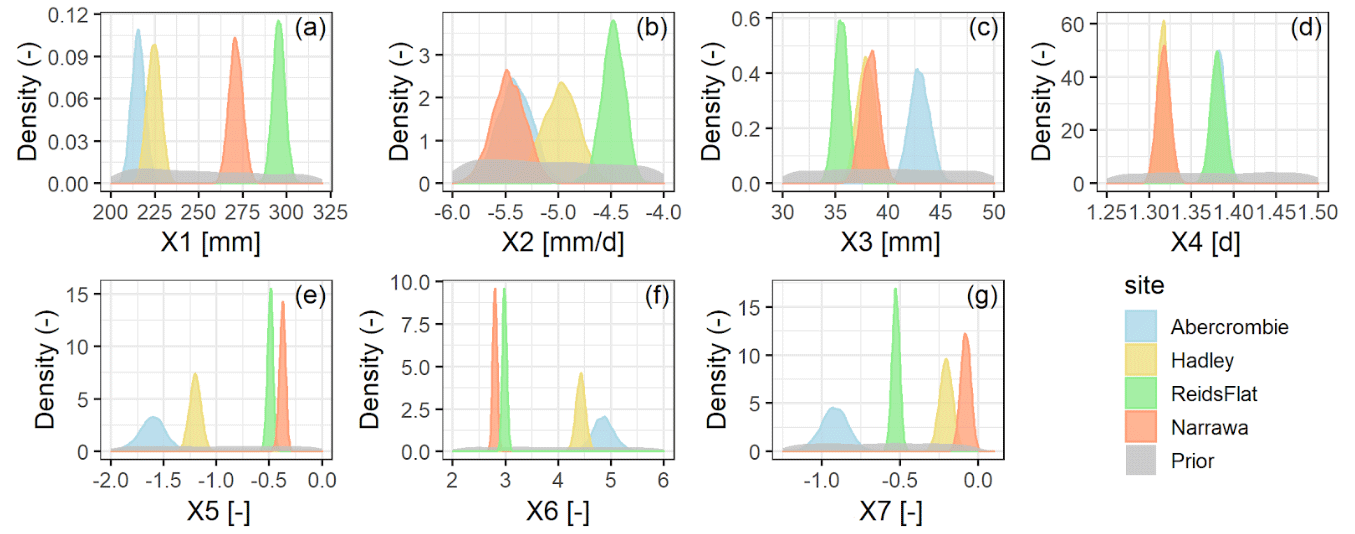
Figure 3Prior and posterior density functions of parameters of the GR4J (a, b, c, d) and daily rating curve models (e, f, g) for the four hypothetical instantaneous water level sites.
The daily rating curve is the relationship between mean daily discharge (Q) and an arbitrary instantaneous water level within the day (H). It differs from the classical definition of RC since the latter works with paired instantaneous values of stages and discharges. We propose a daily rating curve model coupled with a rainfall-runoff model to obtain flow estimates at sites where only one instantaneous water level value is available per day. This work uses a cross catchment verification where a single rainfall-runoff model is fitted across the four sites (Fig. 1), and where one of the sites is assumed to have only instantaneous water level records, this is called the test site. Next, the daily discharge on the test site with only water level records is derived from the hydrological model to estimate the daily rating curve model. At the same time, the coupled models are optimized by Bayesian inference.
3.1 Rainfall–Runoff Model
The rainfall-runoff model simulates discharges at the 4 sites. It is based on the GR4J model (Perrin et al., 2003). GR4J is used since it is a simple lumped rainfall-runoff model with 4 parameters (X1: the production storage capacity; X2: the groundwater exchange coefficient; X3: one day ahead maximum capacity of the routing storage; and X4: the time base of unit hydrograph). Furthermore, the GR4J model is available in several programming languages and packages like Fortran or R with a very low computational cost (Andrews et al., 2011; Coron et al., 2017).
The model requires the daily time series of precipitation and potential evapotranspiration as input variables. The implementation of the GR4J uses the same set of parameters for all sites, and the model predicting different gauging sites only differs in the climatological forcing. This approach considers that the characteristics of basins are similar, and the transfer of parameters across the different basins can be performed with a minor loss of prediction skill, which is, of course, a strong assumption that we aim to handle with the Bayesian Inference.
A general formulation of the rainfall-runoff model follows Eq. (1):
where Q is the discharge (mm d−1), the subscript u is the gauging site, and GR4J() is the rainfall-runoff model as function of the climatological forcing denoted by ϕ (precipitation and potential evapotranspiration in mm d−1), and X1, X2, X3, X4 the GR4J parameters.
3.2 Daily rating curve model
The daily rating curve model is built from instantaneous observed water levels and daily simulated discharges using GR4J. This preliminary approach assumes that the stage-discharge relationship could have up to one possible changing point caused by a change in the hydraulic controls or flows above the bank full stage. This assumption is represented using 3rd order Chebyshev polynomials (Eq. 2). Chebyshev polynomials instead of other models overcome some problems of the automatic generation of rating curves, being a computationally efficient alternative (Fenton, 2018) with a reduced number of parameters.
where u=test is the instantaneous water level test site, X5, X6, X7 are the 3rd order Chebyshev coefficients and h* is a transformation which rescales the stage between −1 to 1 (McMahon and Peel, 2019).
3.3 Bayesian Inference
Bayesian inference is often used for parameter optimization and uncertainty estimation. The method estimates the probability density function of the parameters of the model (known as a posterior distribution) by using a likelihood function and prior distributions of parameters and the Bayes theorem.
In this preliminary implementation, the likelihood function assumes that residual errors are Gaussian, homoscedastic and independent:
where L is likelihood function, σ the variance of residuals, and ϵ the model residuals as . On the full gauged sites, Qobs is given by the daily observed discharges downloaded from the Bureau of Meteorology of Australia. At the water level test site, Qobs is imposed by the daily rating curve Eq. (2).
The Bayesian Inference of the coupled models is using the Delayed Rejection Adaptive Metropolis algorithm (DRAM). This technique finds an ensemble of parameters values that represent parameter distributions and uncertainties. The implementation is using the package FME in the R environment (Soetaert and Petzoldt, 2010). Prior distributions of parameters have been defined by Gaussian probability distributions for parameters X1 and X2, and non-informative uniform distributions for parameters X3 to X7 as well as σ.
4.1 Application of the Bayesian Inference
The prior and posterior distributions of parameters resulting from applying the DRAM algorithm across the instantaneous water level test sites are shown in Fig. 3. Posterior distributions of the parameters differ between the test cases, where each test case represents a different gauging station with only daily instantaneous values. Differences might be caused by the assumption that all basins are parameterized with the same set of parameters, ignoring catchment differences. Depending on which catchment is the test case, this would change the parameter distributions. A clear demonstration of this effect is shown by the time base of the unit hydrograph (X4, Fig. 3d). The parameter X4 is related to the size, shape and slope of the basin. Posterior distributions of X4 are similar for test cases which have similar basin characteristics, such as Abocrombie and Reids Flat. However not too much physical interpretation should be given to the parameters of GR4J since the parameters cannot always be related to the physical characteristics of the basins (Narbondo et al., 2020). In contrast, the daily rating curve model shows no similarities between parameters across gauging sites.
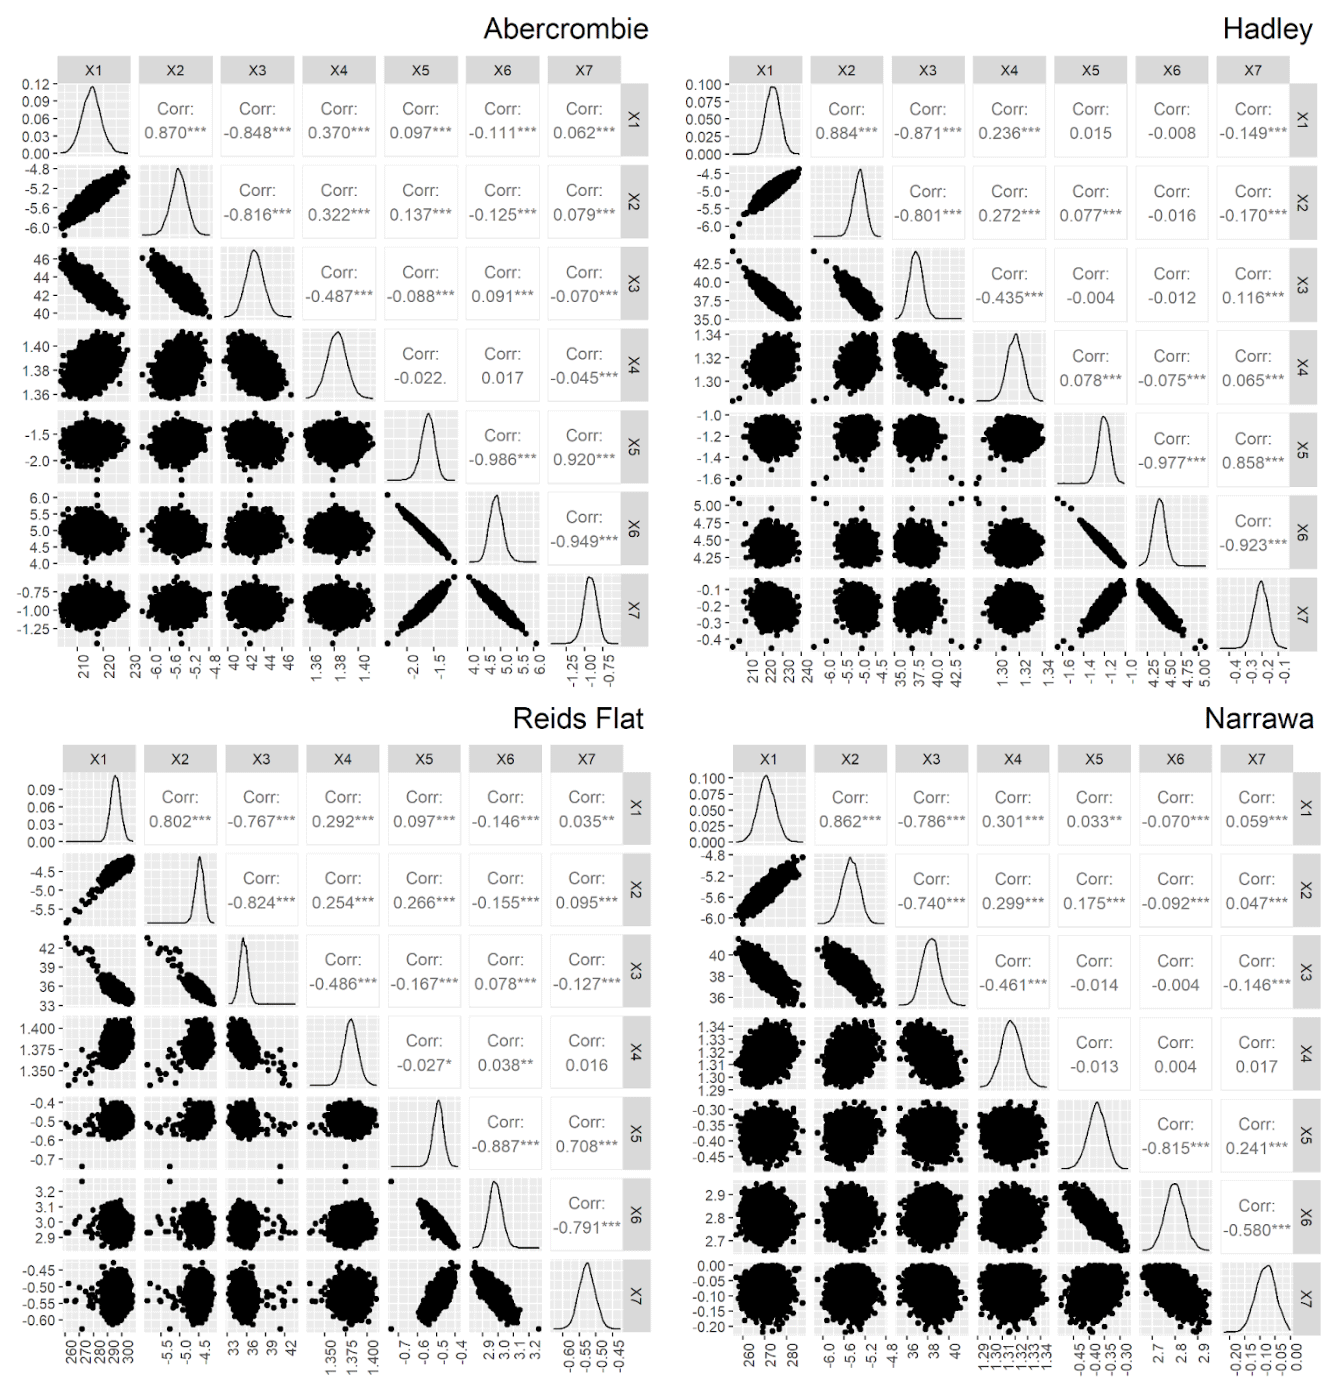
Despite being a parsimonious hydrological model the X1, X2, X3 parameters of GR4J were correlated (Fig. 4). This has been highlighted before for GR4J (Yang et al., 2018; Arsenault and Brissette, 2014; Qi et al., 2020). The rating curve model also showed a high correlation between the parameters (Fig. 4), indicating a possible overparameterization that could be due to the choice of the degree of the Chebyshev polynomials. Here 3rd degree polynomials were included to allow for changes in the stage-discharge relationship. However, there is no interaction between the parameters of the rating curve and the parameters of the hydrological model (Fig. 4). This could be due to the effect introduced by the coupled scheme, which incorporates discharge observations from neighbouring basins, reducing the problem of equifinality in the coupling of the rating curve and hydrologic model, compared to similar work (Lima et al., 2019).
4.2 Daily rating curve estimation, potential applications and limitations
Two simulations of the daily discharge have been generated for the sites where only daily water level data are available. The first simulation is generated by the rainfall-runoff model, and the second by the daily rating curve model. Figure 5 shows the residuals of both simulations as a function of observed discharges. Two models overestimate the low flow with the GR4J estimations being less biased. Additionally, for medium to high flows, the overestimation decreases and the scatter of residuals of the daily rating curve is lower than for GR4J.
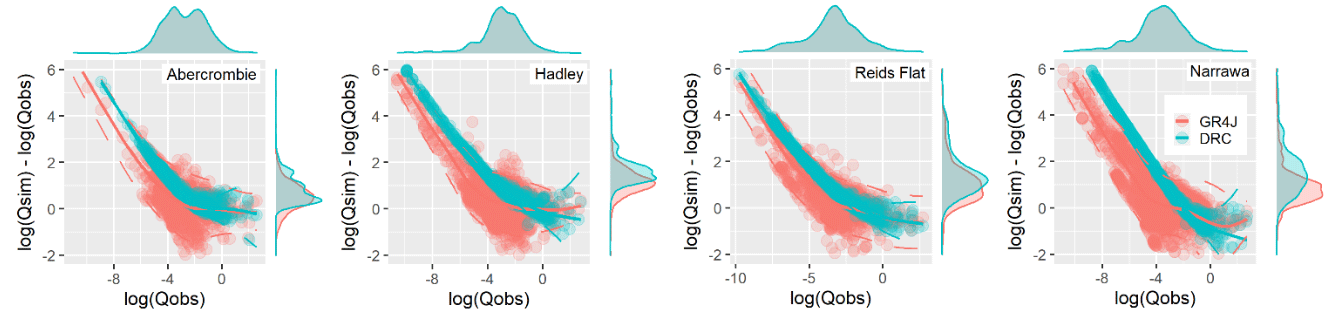
Figure 5GR4J and Daily Rating Curve (DRC) residuals as a function of daily discharges at the water level site and probability density function of log discharges (top) and log residuals (right).
Daily rating curves tend to overestimate/underestimate the flow at low/high stages (Fig. 6). Overall change points in the estimated rating curves are relatively smooth, which would point to potential overparameterization discussed in Sect. 4.1. An interesting finding of this work is that the upper part of the daily rating curve has similarities with the instantaneous rating curve. In contrast, the lower part of the daily rating curve has non-negligible errors that could come from the simplistic structure of the rainfall-runoff model (Flores et al., 2021). Also, it could be related to the structure of the differences between instantaneous discharge and daily discharge (Fig. 2); It is noted that the best fit is obtained for Reids Flat, which is the larger basin with the lowest sub-daily discharge variability.
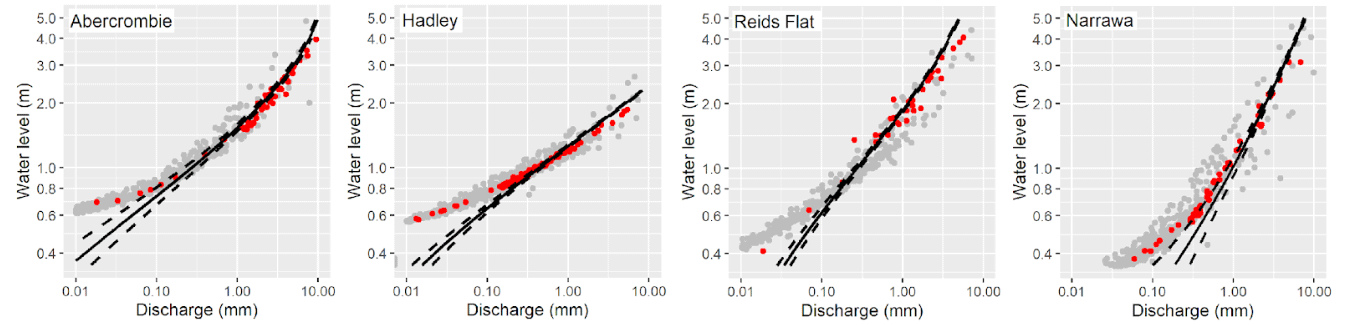
Figure 6Daily rating curve estimation (black line) with the 95 % credible interval (dashed lines), observed daily discharges (grey dots), and observed instantaneous discharges (red dots).
The daily rating curve is a new concept that aims to establish a relationship between the stage and discharges in a different time scale. This addresses the problem of scaling between instantaneous water level observations and discharge simulations of a hydrological model which delivers mean discharges over a time step (a time aggregation), which is often forgotten. Although Fig. 6 compares the daily rating curve with actual instantaneous gaugings, it is important to remember that the daily approach has a different purpose and potential use that should not be confused with the classic instantaneous rating curve. We believe that the main potential of this approach could be data assimilation at sites with only water level records, such as from satellite altimetry. The presented approach also has some limitations which require further research. Temporal changes in the river geometry could be one of the most important constraints (Bhandari et al., 2023; Morlot et al., 2014), for this reason, the study period was limited to a period of time without significant changes in the stage-discharge relationship. Other problems, such as hysteresis or backwater, could occur in other study areas. In these cases, autoregressive models or more elegant formulations of the rating curve model could be included in the framework (Petersen-Øverleir, 2006).
This work introduces a framework to estimate daily rating curves at partly gauged sites. The concept of daily rating curves differs from the classical approach since it uses daily values of discharges rather than instantaneous values. Bayesian optimization of the model parameters results in a significant overestimation of the flow at the low stages and moderate underestimation at the high stages. For medium stages, the daily rating curves do not differ greatly from the instantaneous rating curves. These results suggest that the daily rating curves have the potential to be used to estimate flows from stage levels under average conditions, which should be evaluated by extending the analysis to a broader set of river basins.
FME R package version 1.3.6.2 (URL: https://CRAN.R-project.org/package=FME, last access: 14 September 2023, https://doi.org/10.18637/jss.v033.i03, Soetaert and Petzoldt, 2010) was used for the Bayesian Inference. Other codes are available from the corresponding author on request.
The discharge and water level dataset are available at http://www.bom.gov.au/waterdata/ (Bureau of Meteorology, 2023). The climate dataset is available at https://www.longpaddock.qld.gov.au/silo/ (Queensland Government, 2023).
RN: data curation, methodology, software, visualization, writing – original draft preparation. PG: Resources. RWV: conceptualization, supervision, writing – review & editing.
The contact author has declared that none of the authors has any competing interests.
Publisher’s note: Copernicus Publications remains neutral with regard to jurisdictional claims in published maps and institutional affiliations.
This article is part of the special issue “IAHS2022 – Hydrological sciences in the Anthropocene: Variability and change across space, time, extremes, and interfaces”. It is a result of the XIth Scientific Assembly of the International Association of Hydrological Sciences (IAHS 2022), Montpellier, France, 29 May–3 June 2022.
We sincerely appreciate all the valuable comments and suggestions the reviewers made on the original draft. Their efforts contributed to significantly improving the manuscript.
This research has been supported by the Instituto Nacional de Investigación Agropecuaria (grant no. FPTA-341) and the Comisión Sectorial de Investigación Científica (grant no. I+D 2018-ID108).
This paper was edited by Christophe Cudennec and reviewed by two anonymous referees.
Andrews, F. T., Croke, B. F. W., and Jakeman, A. J.: An open software environment for hydrological model assessment and development, Environ. Modell. Softw., 26, 1171–1185, https://doi.org/10.1016/j.envsoft.2011.04.006, 2011.
Arsenault, R. and Brissette, F. P.: Continuous streamflow prediction in ungauged basins: The effects of equifinality and parameter set selection on uncertainty in regionalization approaches, Water Resour. Res., 50, 6135–6153, https://doi.org/10.1002/2013WR014898, 2014.
Bhandari, B., Markert, K., Mishra, V., Markert, A., and Griffin, R.: Investigation of Data-Driven Rating Curve (DDRC) Approach, Water, 15, 604, https://doi.org/10.3390/w15030604, 2023.
Blöschl, G. and Sivapalan, M.: Scale issues in hydrological modelling: A review, Hydrol. Process., 9, 251–290, https://doi.org/10.1002/hyp.3360090305, 1995.
Bureau of Meteorology: Water Data Online, Water Information, Bureau of Meteorology [data set], http://www.bom.gov.au/waterdata/, last access: 14 September 2023.
Coron, L., Thirel, G., Delaigue, O., Perrin, C., and Andréassian, V.: The suite of lumped GR hydrological models in an R package, Environ. Modell. Softw., 94, 166–171, https://doi.org/10.1016/j.envsoft.2017.05.002, 2017.
Di Baldassarre, G. and Claps, P.: A hydraulic study on the applicability of flood rating curves, Hydrol. Res., 42, 10–19, https://doi.org/10.2166/nh.2010.098, 2011.
Dottori, F., Martina, M. L. V., and Todini, E.: A dynamic rating curve approach to indirect discharge measurement, Hydrol. Earth Syst. Sci., 13, 847–863, https://doi.org/10.5194/hess-13-847-2009, 2009.
Fenton, J. D.: On the generation of stream rating curves, J. Hydrol., 564, 748–757, https://doi.org/10.1016/j.jhydrol.2018.07.025, 2018.
Flores, N., Rodríguez, R., Yépez, S., Osores, V., Rau, P., Rivera, D., and Balocchi, F.: Comparison of Three Daily Rainfall-Runoff Hydrological Models Using Four Evapotranspiration Models in Four Small Forested Watersheds with Different Land Cover in South-Central Chile, Water, 13, 3191, https://doi.org/10.3390/w13223191, 2021.
Hidayat, H., Vermeulen, B., Sassi, M. G., Torfs, P. J. J. F., and Hoitink, A. J. F.: Discharge estimation in a backwater affected meandering river, Hydrol. Earth Syst. Sci., 15, 2717–2728, https://doi.org/10.5194/hess-15-2717-2011, 2011.
Jalbert, J., Mathevet, T., and Favre, A.-C.: Temporal uncertainty estimation of discharges from rating curves using a variographic analysis, J. Hydrol., 397, 83–92, https://doi.org/10.1016/j.jhydrol.2010.11.031, 2011.
Jeffrey, S. J., Carter, J. O., Moodie, K. B., Beswick, A. R.: Using Spatial Interpolation to Construct a Comprehensive Archive of Australian Climate Data, Environ. Modell. Softw., 16, 309–330, https://doi.org/10.1016/S1364-8152(01)00008-1, 2001.
Jian, J., Ryu, D., Costelloe, J. F., and Su, C.-H.: Towards hydrological model calibration using river level measurements, J. Hydrol. Reg. Stud., 10, 95–109, https://doi.org/10.1016/j.ejrh.2016.12.085, 2017.
Kiang, J. E., Gazoorian, C., McMillan, H., Coxon, G., Le Coz, J., Westerberg, I. K., Belleville, A., Sevrez, D., Sikorska, A. E., Petersen-Øverleir, A., Reitan, T., Freer, J., Renard, B., Mansanarez, V., and Mason, R.: A Comparison of Methods for Streamflow Uncertainty Estimation, Water Resour. Res., 54, 7149–7176, https://doi.org/10.1029/2018WR022708, 2018.
Kim, Y., Oh, S., Lee, S., Byun, J., and An, H.: Application of Stage-Fall-Discharge Rating Curves to a Reservoir Based on Acoustic Doppler Velocity Meter Measurement Data, Water, 13, 2443, https://doi.org/10.3390/w13172443, 2021.
Kittel, C. M. M., Jiang, L., Tøttrup, C., and Bauer-Gottwein, P.: Sentinel-3 radar altimetry for river monitoring – a catchment-scale evaluation of satellite water surface elevation from Sentinel-3A and Sentinel-3B, Hydrol. Earth Syst. Sci., 25, 333–357, https://doi.org/10.5194/hess-25-333-2021, 2021.
Lang, M., Pobanz, K., Renard, B., Renouf, E., and Sauquet, E.: Extrapolation of rating curves by hydraulic modelling, with application to flood frequency analysis, Hydrolog. Sci. J., 55, 883–898, https://doi.org/10.1080/02626667.2010.504186, 2010.
Le Coz, J.: A literature review of methods for estimating the uncertainty associated with stage-discharge relations, WMO, Rep. PO6a, 21, https://citeseerx.ist.psu.edu/viewdoc/download?doi=10.1.1.400.8656&rep=rep1&type=pdf (last access: 14 September 2023), 2012.
Lee, W. S., Lee, K. S., Kim, S. U., and Chung, E.-S.: The Development of Rating Curve Considering Variance Function Using Pseudo-likelihood Estimation Method, Water Resour. Manage., 24, 321–348, https://doi.org/10.1007/s11269-009-9448-8, 2010.
Lima, F. N., Fernandes, W., and Nascimento, N.: Joint calibration of a hydrological model and rating curve parameters for simulation of flash flood in urban areas, Rev. Bras. de Recur. Hidr., 24, https://doi.org/10.1590/2318-0331.241920180066, 2019.
McMahon, T. A. and Peel, M. C.: Uncertainty in stage–discharge rating curves: application to Australian Hydrologic Reference Stations data, Hydrolog. Sci. J., 64, 255–275, https://doi.org/10.1080/02626667.2019.1577555, 2019.
McMillan, H., Freer, J., Pappenberger, F., Krueger, T., and Clark, M.: Impacts of uncertain river flow data on rainfall-runoff model calibration and discharge predictions, Hydrol. Process., 24, 1270–1284, https://doi.org/10.1002/hyp.7587, 2010.
Morlot, T., Perret, C., Favre, A.-C., and Jalbert, J.: Dynamic rating curve assessment for hydrometric stations and computation of the associated uncertainties: Quality and station management indicators, J. Hydrol., 517, 173–186, https://doi.org/10.1016/j.jhydrol.2014.05.007, 2014.
Narbondo, S., Gorgoglione, A., Crisci, M., and Chreties, C.: Enhancing Physical Similarity Approach to Predict Runoff in Ungauged Watersheds in Sub-Tropical Regions, Water, 12, 528, https://doi.org/10.3390/w12020528, 2020.
Petersen-Øverleir, A.: Modelling stage – discharge relationships affected by hysteresis using the Jones formula and nonlinear regression, Hydrolog. Sci. J., 51, 365–388, https://doi.org/10.1623/hysj.51.3.365, 2006.
Pedersen, Ø., Aberle, J., and Rüther, N.: Hydraulic scale modelling of the rating curve for a gauging station with challenging geometry, Hydrol. Res., 50, 825–836, https://doi.org/10.2166/nh.2019.044, 2019.
Perret, E., Renard, B., and Le Coz, J.: A Rating Curve Model Accounting for Cyclic Stage-Discharge Shifts due to Seasonal Aquatic Vegetation, Water Resour. Res., 57, e2020WR027745, https://doi.org/10.1029/2020WR027745, 2021.
Perrin, C., Michel, C., and Andréassian, V.: Improvement of a parsimonious model for streamflow simulation, J. Hydrol., 279, 275–289, https://doi.org/10.1016/S0022-1694(03)00225-7, 2003.
Qi, W., Chen, J., Li, L., Xu, C., Li, J., Xiang, Y., and Zhang, S.: A framework to regionalize conceptual model parameters for global hydrological modeling, Hydrol. Earth Syst. Sci. Discuss. [preprint], https://doi.org/10.5194/hess-2020-127, 2020.
Queensland Government: SILO – Australian climate data from 1889 to yesterday, Queensland Government [data set], https://www.longpaddock.qld.gov.au/silo/, last access: 14 September 2023.
Reistad, K., Petersen-Øverleir, A., and Bogetveit, L.: Setting up rating curves using HEC-RAS, VANN, Journal of the Norwegian Water Association, 3, 20–30, 2007.
Reitan, T. and Petersen-Øverleir, A.: Bayesian methods for estimating multi-segment discharge rating curves, Stoch. Environ. Res. Risk Assess., 23, 627–642, https://doi.org/10.1007/s00477-008-0248-0, 2009.
Sellami, H., La Jeunesse, I., Benabdallah, S., and Vanclooster, M.: Parameter and rating curve uncertainty propagation analysis of the SWAT model for two small Mediterranean catchments, Hydrolog. Sci. J., 58, 1635–1657, https://doi.org/10.1080/02626667.2013.837222, 2013.
Sikorska, A. E. and Renard, B.: Calibrating a hydrological model in stage space to account for rating curve uncertainties: general framework and key challenges, Adv. Water Resour., 105, 51–66, https://doi.org/10.1016/j.advwatres.2017.04.011, 2017.
Soetaert, K. and Petzoldt, T.: Inverse Modelling, Sensitivity and Monte Carlo Analysis in R Using Package FME, J. Stat. Soft. [software], 33, 1–28, https://doi.org/10.18637/jss.v033.i03, 2010.
WMO: Manual on stream gauging, World Meteorological Organization, Geneva, 2 pp., https://library.wmo.int/viewer/35848?medianame=1044_Vol_I_en_#page=1&viewer=picture&o=&n=0&q=, 2010.
Yang, X., Magnusson, J., Rizzi, J., and Xu, C.-Y.: Runoff prediction in ungauged catchments in Norway: comparison of regionalization approaches, Hydrol. Res., 49, 487–505, https://doi.org/10.2166/nh.2017.071, 2018.