the Creative Commons Attribution 4.0 License.
the Creative Commons Attribution 4.0 License.
 | 18 Apr 2024
Using of hydrological model and geospatial tool to assess climate change impact on the hydropower potential of the White Bandama watershed in Côte d'Ivoire (West Africa)
Koffi Claude Alain Kouadio
Siélé Silué
Ernest Amoussou
Kouakou Lazare Kouassi
Arona Diedhiou
Talnan Jean Honoré Coulibaly
Salomon Obahoundjé
Sacré Regis Didi
Houebagnon Saint Jean Coulibaly
This study was carried out in the White Bandama watershed (WBW) in Côte d'Ivoire (West Africa). The objective is to assess the impacts of future climate change (CC) on the hydropower potential (HPP) of the WBW. The methodology is based on coupling the SWAT (Soil and Water Assessment Tool) hydrological model with the Geographic Information System (GIS) QGIS to assess HPP on streams and evaluate the impacts of future CC on HPP of the watershed. Historical and climate projection data (precipitation, minimum and maximum temperature) for a set of three Regional Climate Models (RCM) from CORDEX-AFRICA (CCCma-CanRCM4, CCLM4-8-17 and REMO 2009) under RCP 4.5 were used. The biases of the ensemble mean were corrected by the Delta-change method. The relative change of streamflow discharge and HPP was assessed as the relative difference between the projection periods (2041–2070 and 2071–2100) and the reference period (1976–2005). The results showed a total of 22 future hydropower potential sites in the watershed. These sites were identified, geolocated and classified according to their potential capacity of generation in 82 % as small (1–25 MW potential capacity), 9 % as medium (25–100 MW potential capacity) and 9 % as large (more than 100 MW potential capacity) hydropower. The climate models' ensemble projected an upward trend for both the annual mean discharge of rivers and HPP of the WBW according to RCP 4.5 for the periods 2041–2070 and 2071–2100. On the annual cycle, the months of August and September will record the highest monthly mean flows between 150 and 200 m3 s−1 while the months from November to April will record low monthly mean flows in the WBW.
- Article
(2337 KB) - Full-text XML
- BibTeX
- EndNote


UPH 19; SDG 7; hydropower potential modelling; geospatial analysis; climate change impact; Côte d'Ivoire
Hydroelectricity (HE) represents the largest source of renewable electricity in the world with a global production of more than 4250 TWh of electricity (IHA, 2022). In West Africa, HE contributes about 40 % of total electricity production (Barbier et al., 2009). In Côte d'Ivoire, HE is the second source of energy production after thermal energy and can contribute to the production of clean electricity with low Greenhouse Gas (GHG) emissions (Kouadio et al., 2020; IEA, 2020). HE could be an essential energy of the future to mitigate climate change (CC). However, there is a duality relationship between hydroelectricity and climate (Kouadio et al., 2022). Although contributing to CC mitigation through its low GHG emission, hydroelectricity can be affected by climate due to changes in the hydrological cycle (Berga, 2016). HE is dependent on climatic parameters (precipitation, temperature, insolation, potential evapotranspiration [PET], etc.) (De Souza Dias et al., 2018). These parameters influence the availability of water resource, the hydropower potential (HPP) and therefore the HE. Previous studies by Amoussou et al. (2012), Kouame et al. (2019) and Kouadio et al. (2020, 2022) have shown that CC can influence the intensity and duration of precipitation as well as river flows. It can also vary the PET. Furthermore, rainfall deficits cause runoff deficits (Savane et al., 2002) and impacts on HE (Kouadio et al., 2020). In the literature, numerous scientific works, in particular authors such as Hamududu and Killingtveit (2012), Grijsen (2014) and, Turner et al. (2017) focused, on the one hand, on the potential impacts of CC on water resources/on hydrology and, on the other hand, on hydropower. All these studies have endeavored to demonstrate that CC has impacts on both water resources and hydroelectric production. Analyzing the impacts of CC on hydrology and HPP in different watersheds in Africa, Yira et al. (2021) and Nonki et al. (2021) proposed a methodology based on the use of a hydrological model and climate model outputs. Thus, this study is a contribution to the establishment of a methodology using hydrological modelling coupled with geospatial analysis to assess the impacts of CC on the HPP in the White Bandama watershed (WBW) in Côte d'Ivoire. The purpose of this paper is to adopt a hydrological model combined with a Geographic Information System (GIS) to assess the potential impacts of future CC on the HPP of the White Bandama River watershed. This article is structured as follows: after the Introduction, which presents the background and objectives of this study, the Materials and Methods section describes the materials and methods used, the main results and discussion are presented in the Results and Discussion section. This manuscript ends with the Conclusion section.
2.1 Study area
This study was conducted in the WBW with an area of approximately 32 400 km2 (Côte d'Ivoire) (Fig. 1). The WBW extends from the center to the north of Côte d'Ivoire. Its geographic coordinates in the WGS 84 reference vary between 5° and 6°30′ in longitude and between 6°30′ and 10°30′ in latitude. The White Bandama River has its source in the northern part of Côte d'Ivoire between Boundiali and Korhogo, at an altitude of 480 m. The WBW is under the influence of two climates: the Baoulean climate or equatorial climate or attenuated transition with annual precipitations varying on average between 1000 and 1600 mm yr−1 and the sudanian climate or tropical climate of transition with annual precipitations of unimodal distribution varying between 1000 and 1200 mm yr−1 (Goula et al., 2007). The population living on the WBW is estimated ∼ 3 000 000 inhabitants (Ivorian Institute of Statistics, 2014). In 1972, one of the major socio-economic assets of Côte d'Ivoire, the Kossou hydroelectric dam was built in this basin, with an installed capacity of 174 MW.
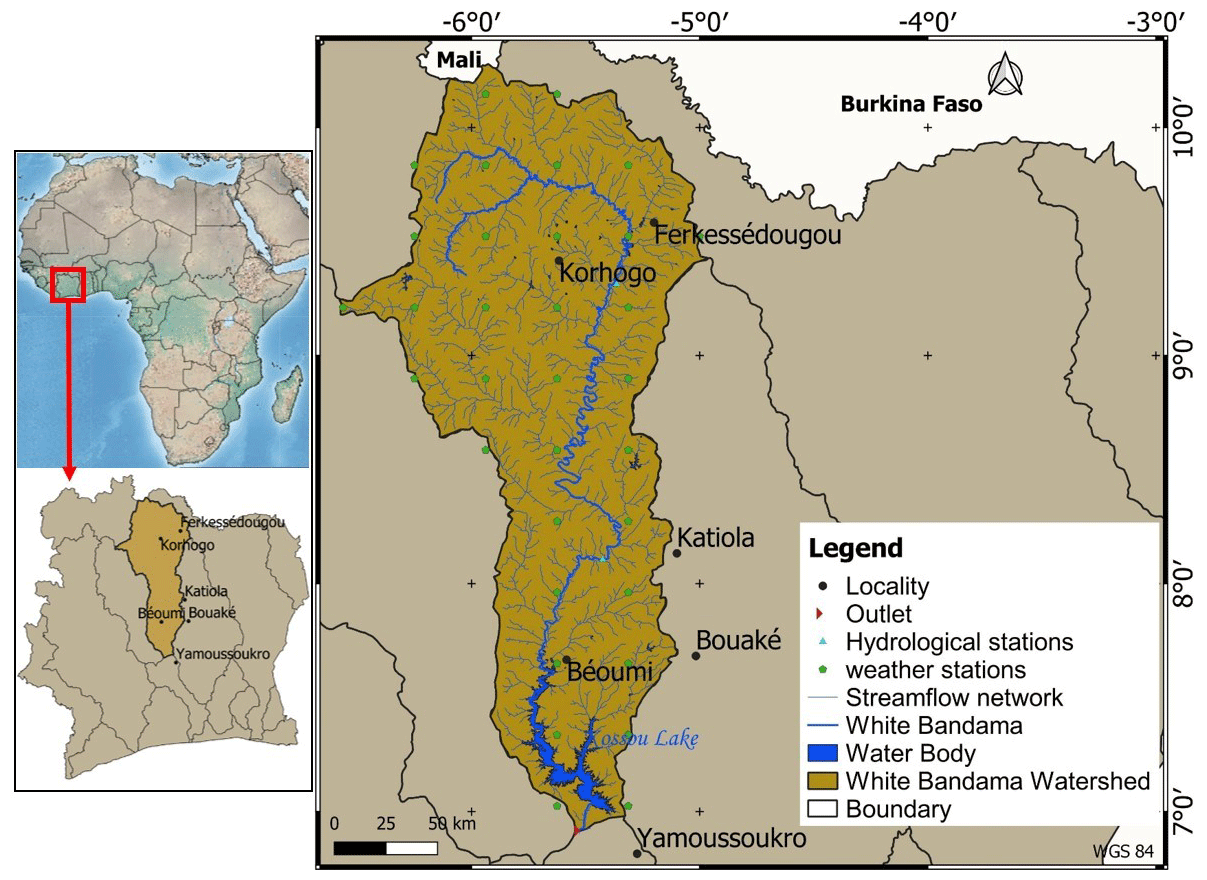
Figure 1Location of the White Bandama Watershed (WBW).
2.2 Description, data and configuration of the SWAT model
In this study, hydrological modelling was carried out with the SWAT (Soil and Water Assessment Tool) model (https://swat.tamu.edu/software/, last access: 17 May 2022) coupled with the QGIS interface (https://download.qgis.org, last access: 17 May 2022). The choice of this model is justified by a wide field of applications and use in several relatively recent studies. In addition, coupling facilitates access to variables and parameters. It offers a set of GIS tools for the development, execution and editing of hydrological inputs, and promotes the management of raster, vector and alphanumeric data. SWAT is an agro-hydrological model developed by researchers at the Agricultural Research Service (ARS) of the United States Department of Agriculture (USDA) in the 1990s. It is a physically based, spatially distributed, basin-scale hydrological model developed to simulate the impact of land use and management practices on water quantity and quality (surface water and groundwater). A detailed description of the model can be found in the work of Neitsch et al. (2011) and Arnold et al. (2012). The SWAT model simulates the water cycle through the hydrological Eq. (1):
With: SWt: final soil water content (mm), SW0: initial soil water content on day (mm), t: time (day), Ri: precipitation of day i (mm), Qsi: surface runoff on day i (mm), Ei: potential evapotranspiration on day i (mm), Wi: percolation or infiltration of day i (mm), Qqwi: low water flow or quantity of water returning to the soil of day i (mm).
Several data were needed to configure the model and simulate the flows. The satellite images were obtained by the NASA (National Aeronautics and Space Administration) and NGA (National Geospatial-Intelligence Agency) radar-surveying mission in 2000. These satellite images are 30 m spatial resolution and are available on the United States Geological Survey (USGS) website https://earthexplorer.usgs.gov (last access: 10 December 2021). In addition, daily reanalysis data of precipitation, temperature (minimum and maximum), relative humidity, solar radiation, wind speed available for a period of 34 years (1980 to 2013) with a resolution of 38 km were used. They are available at https://globalweather.tamu.edu/ (last access: 10 December 2021; Saha et al., 2014). These reanalysis data collected at a daily time step were aggregated in monthly time step before the simulation of the SWAT model at the monthly time step. The daily hydrometric data observed were collected from the Ivorian direction of human hydraulics (DHH) for the stations of Marabadiassa (1980 to 2013) and Badikaha (1982 to 1989). The model setup also required soil and land cover data in raster form. For this purpose, a soil map of the WBW with a spatial resolution of 1 km provided by the Food and Agriculture Organization of the United Nations (FAO) was used. The WBW land cover map from 2006, with a spatial resolution of 300 m, was obtained from the ESA website (http://due.esrin.esa.int/page_globcover.php, last access: 10 December 2021; Leroy et al., 2006). PET was computed using the Penman-Monteith equation. The variable storage method developed by Williams (1969) was chosen for the discharge simulation. Runoff was computed using the Curve Number (CN) method. The simulation period was defined from 1980 to 2013 (34 years) with a warming period of 2 years (1980–1981). The configured and calibrated model was used to assess the potential impacts of CC. The model was calibrated from 1982 to 1985 (4 years), and validated from 1986 to 1989 (4 years) at a monthly time step by the coefficient of Nash-Sutcliffe (NS) and the coefficient of determination (R2).
2.3 Assessment of future climate impacts on hydropower potential
For the assessment of CC impacts, the outputs (precipitation, minimum and maximum temperature) of three CORDEX-AFRICA climate models (0.44° resolution) were used: CCCma-CanRCM4, CCLM4-8-17 and REMO 2009. These data were obtained for the RCP 4.5 scenario for the reference period P0 (1976–2005) and the projection periods P1 and P2 respectively (2041–2070) and (2071–2100). In this study, the methodological approach for evaluating the impacts of CC on the HPP is based on a process similar to that used by De Oliveira et al. (2017). Bias correction of the dataset mean of the three climate models was performed by the Delta-Change method (Teutschbein and Seibert, 2012). The HPP was assessed over the reference periods P0 and projection periods P1 and P2 of the RCP 4.5 by Eq. (2) of Maher and Smith (2001).
With: HPP: hydropower potential (W), ρ: density of water (1000 kg m−3), g: acceleration due to gravity (m s−2): 9.81 m s−2, Q: flow in (m3 s−1) on the section of the network, h: vertical drop height in meters (m).
The relative change (Δ) characterized by the fluctuations makes it possible to assess the potential CC impacts over the projection periods (2041–2070 and 2071–2100) by Eq. (3).
With: Δ: Relative change or fluctuation, : Average value of the variable calculated on the projection period : Average value of the variable calculated on the reference period.
3.1 Model calibration and validation
The calibration and validation of the SWAT model on the WBW are shown in Fig. 2a and b. The results are illustrated here for the Badikaha hydrological station. The Nash-Sutcliffe (NS) and determination (R2) coefficients obtained (NS and R2>0.6) indicate that there is a very good correlation between the simulated and observed flows. The whole correlation over the calibration period (NS = 0.83 and R2 = 0.839) is much better than that of the validation period (NS = 0.70 and R2=0.772). Furthermore, the model underestimated flood peaks. It would be a limit of the SWAT model.
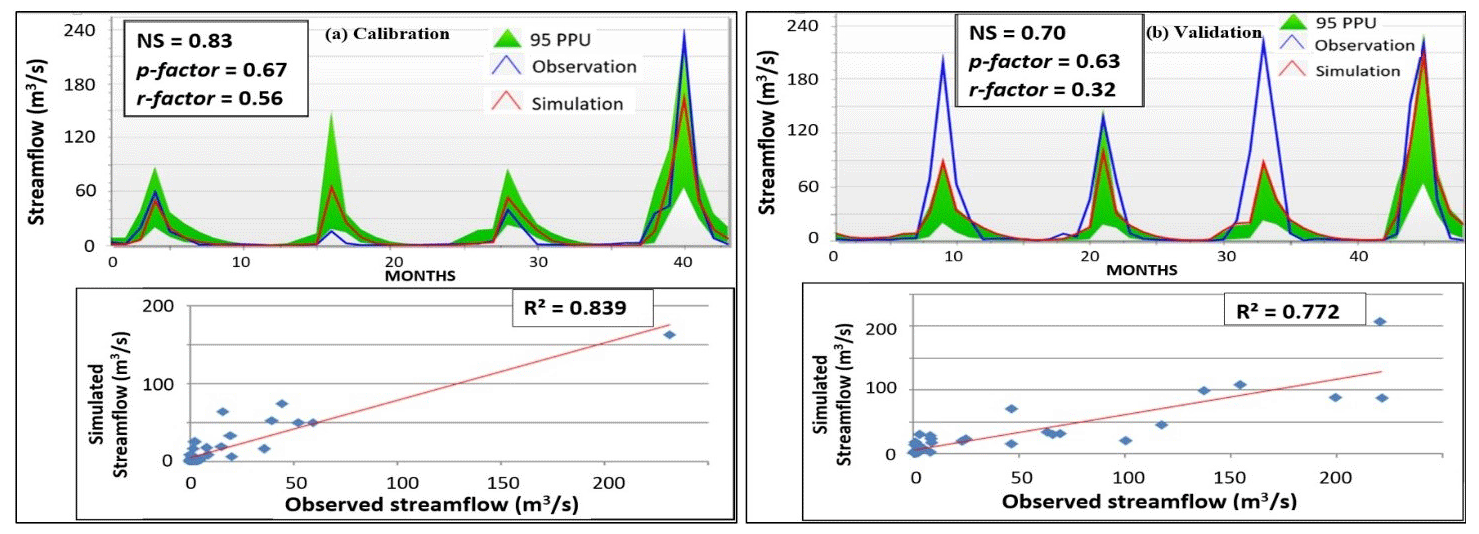
Figure 2(a) Calibration of the SWAT model of the WBW from 1982 to 1985 (Badikaha station) and (b) Validation of the WBW SWAT model from 1986 to 1989 (Badikaha station). * p-factor: percentage of observed data framed by 95 % prediction uncertainty (95PPU). * r-factor: thickness of the 95PPU strip.
3.2 Evaluation of the HPP in the WBW
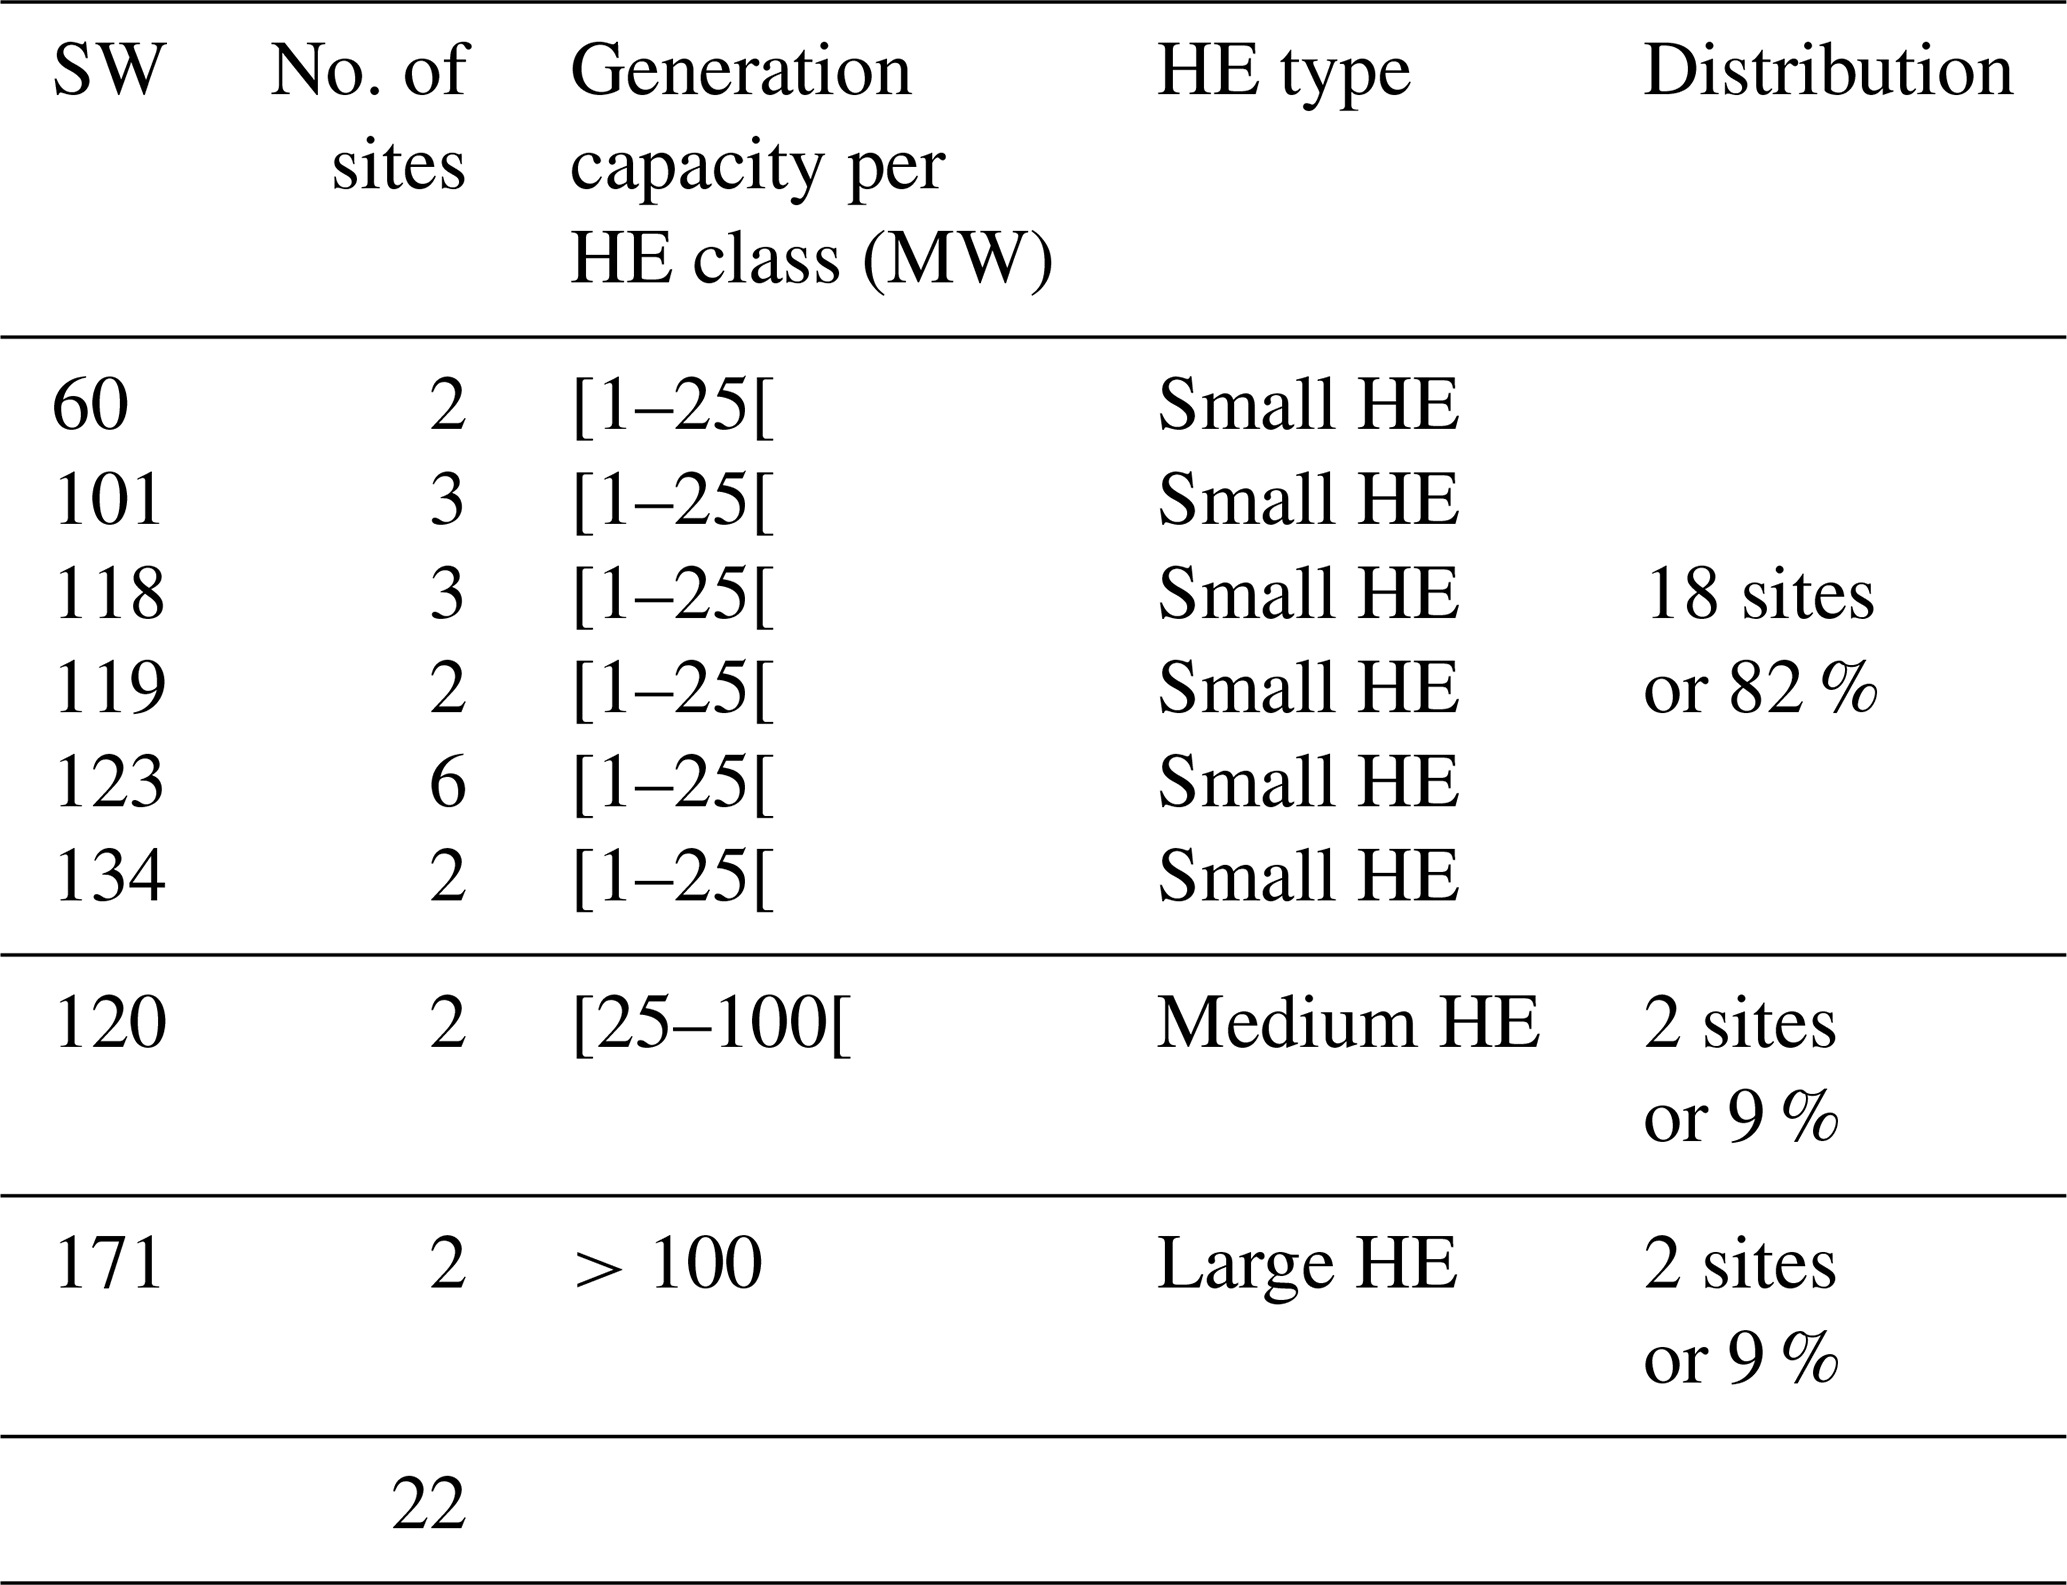
The calibrated and validated model was used for the evaluation of the HPP in the basin. Figure 3 presents potentially exploitable hydroelectric sites and their geospatial distribution in the basin. Twenty-two sites have been identified, geolocated and classified according to their potential production capacity at 82 % small (potential capacity 1–25 MW), 9 % medium (potential capacity 25–100 MW) and 9 % large (more of 100 MW) hydropower (Table 1). The results show that the WBW has a good potential in small HE. This would be a major asset in the decentralization of electrification in this basin.
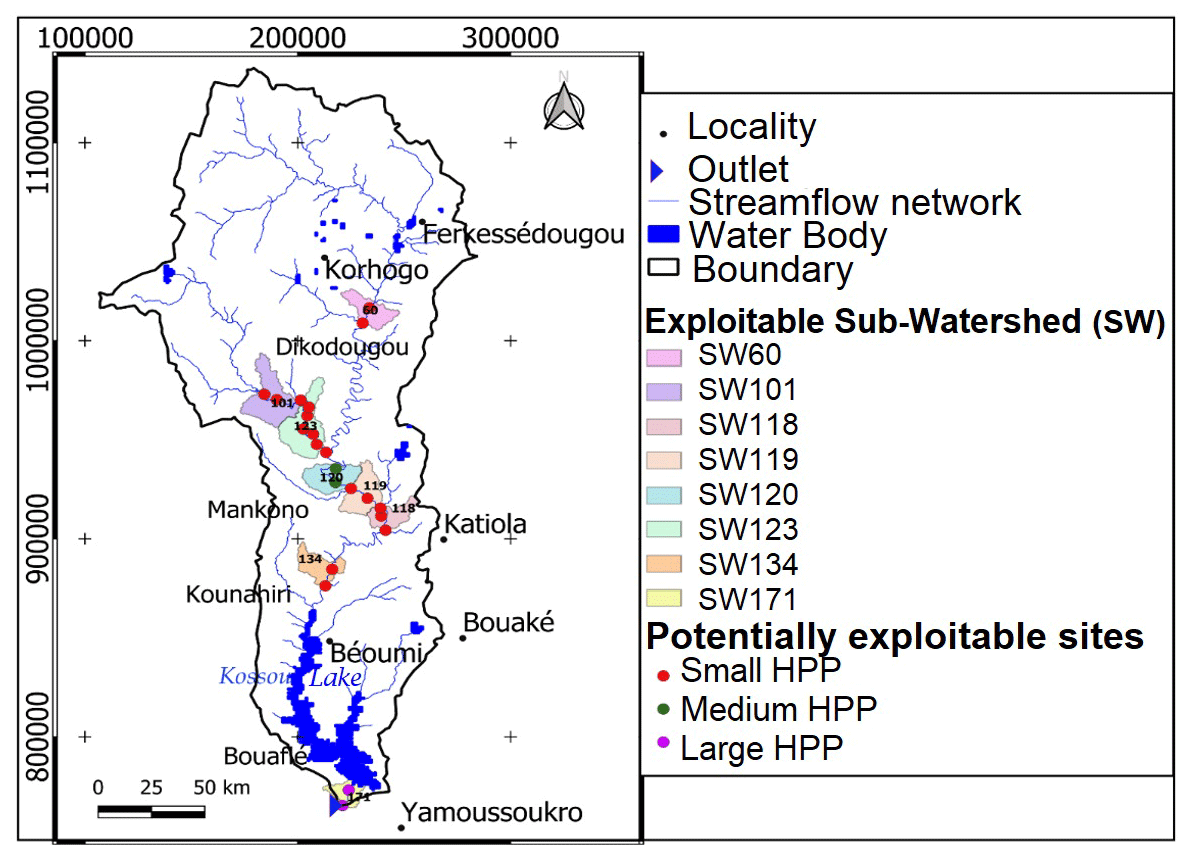
Figure 3Geospatial distribution of the 22 hydroelectric sites in the WBW.
3.3 Impacts of future CC on the HPP
The analysis of the impacts of future CC was carried out on the HPP of the 22 sites spread over eight Sub-Watersheds (SW 60, 101, 118, 119, 120, 123, 134 and 171). The relative changes in monthly average flow and HPP for SWs 101 and 171 are shown in Figs. 4 and 5. Compared to the reference period P0, all the climate models project a general upward trend in flows on the eight SWs for the periods P1 and P2 according to the RCP 4.5 scenario. On an annual cycle, flows will increase from July to October. This increase in flows over this period is estimated at a rate of ∼ 35 % and 53 % respectively on P1 and P2 for SW 101, and ∼ 54 % and 65 % respectively on P1 and P2 for SW 171. Like the discharges, the models project an increase in HPP on all SWs compared to the reference period P0. Furthermore, the results show that SW 171 will register the largest HPP with a monthly average during the months of August and September oscillating between 400 and 500 MW according to the RCP 4.5 scenario. The SW101 will record the lowest HPP with a monthly average maximum of less than 18 MW during these same months.
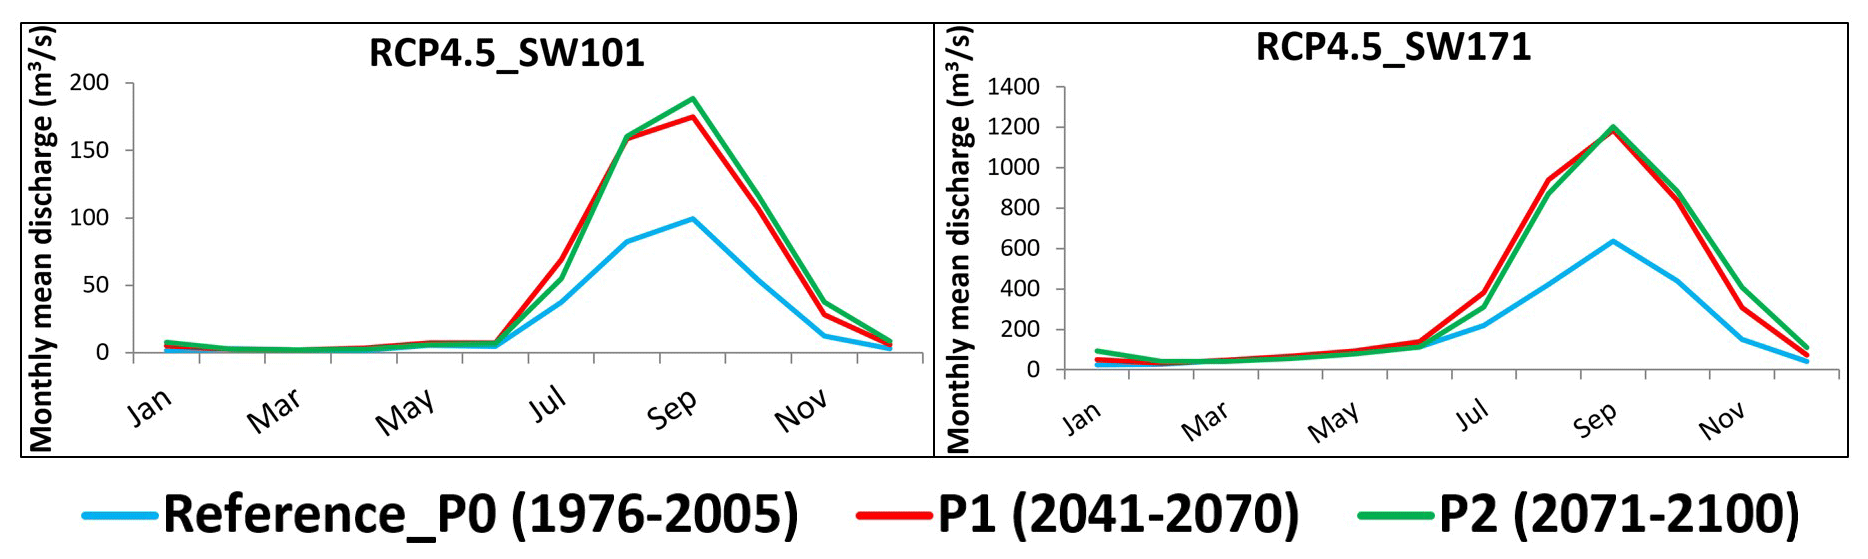
Figure 4Projected monthly mean discharges of SW101 and 171 under RCP 4.5 of the ensemble mean of the three RCM.
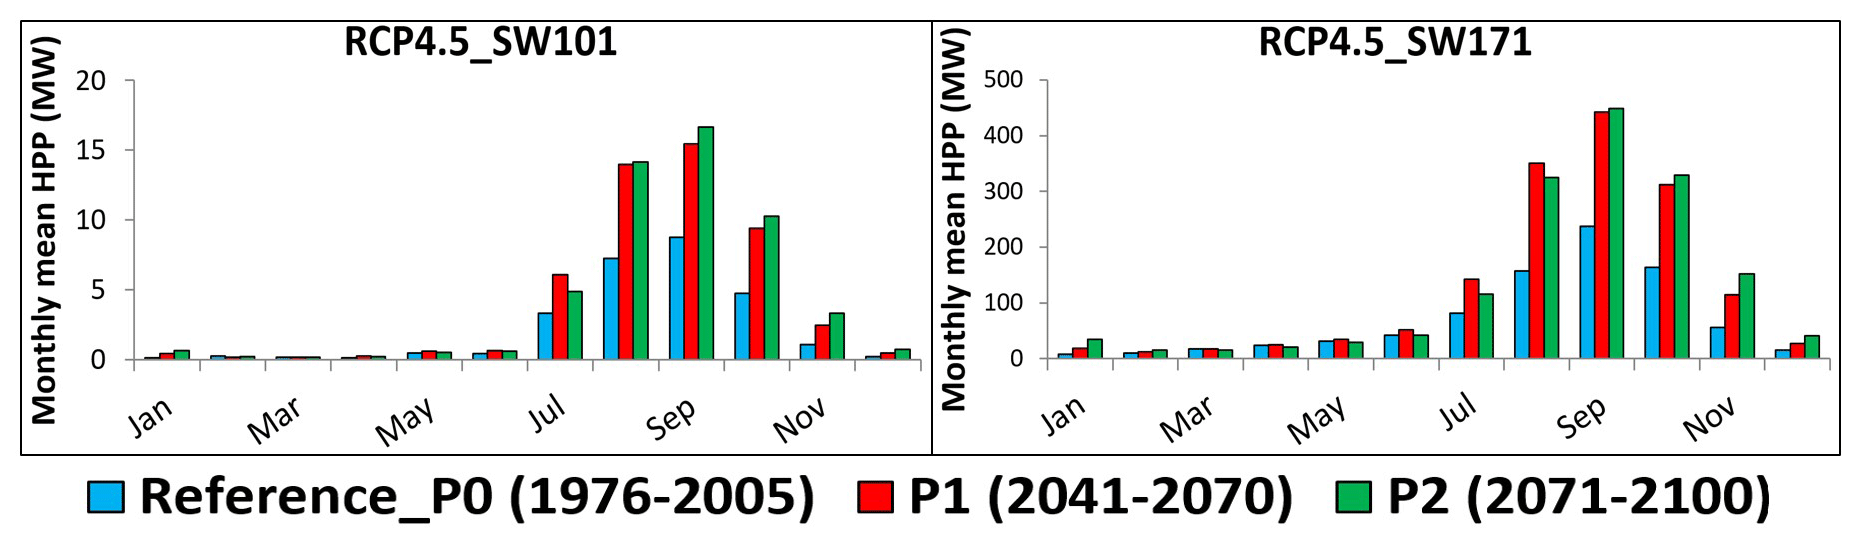
Figure 5Projected monthly mean HPP of SW 101 and 171 under RCP 4.5 of the ensemble mean of the three RCM.
The analysis of CC impacts on the HPP used outputs from a set of three CORDEX- Africa climate models (ensemble mean). According to Pandey et al. (2019), the use of a set of models would contribute to the reduction of uncertainties in climate projections. The results of the climate impact analysis project a general upward trend in monthly mean streamflow and HPP on the WBW according to RCP 4.5. This increase in flows on P1 and P2 could be explained, on the one hand, by a resumption of rainfall and, on the other hand, by a degradation of the vegetation cover in the medium and long term. This situation would allow strong flow to the detriment of infiltration, as Amoussou et al. (2012). The degradation or reduction of the vegetation cover would favor strong surface runoff to the detriment of infiltration. In addition, the work of Kling et al. (2016), based on the reference (1998–2014) and future (2046–2065) periods, estimate that an increase in precipitation in West Africa would be of the order of 1 % to 6.8 %. Moreover, according to the fifth report of the GIEC (2014), an increase in precipitation until 2100 is projected according to the scenario considered. However, these projections remain marked by many uncertainties. For this reason, in this study it would be interesting to consider the general trend marked by a future increase in flows and HPP over the basin for P1 and P2 compared to the reference P0. In the work of Kouadio et al. (2020), hydrological dynamics was analyzed under CC in the WBW. This study has shown that the Kossou dam plays a role in reducing floods in the watershed. Moreover, the analysis of monthly flows has demonstrated that the flood flow incoming to the Kossou Lake was skimmed ∼ 93.7 %
The objective of this study was to assess the potential impacts of CC on the HPP of the WBW in Côte d'Ivoire. For this purpose, the SWAT hydrological model combined with geospatial analysis was applied. The potential impacts of CC on the monthly flow and HPP of the basin were analyzed over the projection periods P1 and P2 compared to the reference period P0, under the RCP 4.5 scenario. The analysis of these impacts also focused on eight (8) SWs with twenty-two (22) HE sites identified (SW 60, 101, 118, 119, 120, 123, 134 and 171). In comparison with the P0 reference period, a general upward trend in flows and HPP on the WBW was observed. On the annual cycle, the models have projected that the months of August and September will register the highest flows between 150 and 200 m3 s−1 with a high HPP while the months of November through April will register the lowest flows with a low HPP. In addition, an increase in flows and HPP on the 8 SWs for periods P1 and P2 compared to P0 is projected. The models also showed that the SW 171 would have the largest HPP with a monthly average during the months of August and September oscillating between 400 and 500 MW. In addition, SW 101 will record the lowest HPP with an average monthly maximum of less than 18 MW during these same months. This general increase in flows could however increase the problems of siltation, eutrophication and the risk of flooding in certain areas and for certain activities in this basin. To this end, additional studies should be carried out to better assess these consequences on the basin.
The data used in this study is publicly available. The reanalysis data are freely available at https://globalweather.tamu.edu/ (SWAT, 2021), and the satellite data are available on the USGS website (https://earthexplorer.usgs.gov, USGS, 2021) and the ESA website (http://due.esrin.esa.int/page_globcover.php, ESA, 2021). However, the observed data comes from national service databases available upon request.
Conceptualization: KCAK, SS, EA, and AD; Data analysis: KCAK, EA, and AD; Methodology: KCAK, AD, and TJHC; Validation, KCAK, and AD; Drafting of preliminary manuscript: KCAK, SS, and AD; Revision and writing of the final manuscript: KCAK, SS, EA, KLK, AD, TJHC, HSJC, SRD, and SO. The final version of the article was approved by all authors: KCAK, SS, EA, KLK, AD, TJHC, SO, SRD, and HSJC.
The contact author has declared that none of the authors has any competing interests.
Publisher's note: Copernicus Publications remains neutral with regard to jurisdictional claims in published maps and institutional affiliations.
This article is part of the special issue “IAHS2022 – Hydrological sciences in the Anthropocene: Variability and change across space, time, extremes, and interfaces”. It is a result of the XIth Scientific Assembly of the International Association of Hydrological Sciences (IAHS 2022), Montpellier, France, 29 May–3 June 2022.
The authors would like to thank the organizing committee of the XIth Scientific Assembly of the International Association of Hydrological Sciences in Montpellier 2022. We also thank IAHS through the SYSTA grant for funding the first author to attend this conference and for giving the opportunity to publish this paper. Thanks also to Jean-Marie Kileshye-Onema and the anonymous reviewer who contributed to improving the quality of this paper.
This paper was edited by Christophe Cudennec and reviewed by Jean-Marie Kileshye-Onema and one anonymous referee.
Amoussou, E., Camberlin, P., and Mahé, G.: Impact de la variabilité climatique et du barrage Nangbéto sur l'hydrologie du système Mono-Couffo (Afrique de l'Ouest), Hydrolog. Sci. J., 57, 805–817, https://doi.org/10.1080/02626667.2011.643799, 2012.
Arnold, J. G., Moriasi, D. N., Gassman, P. W., Abbaspour, K. C., White, M. J., Srinivasan, R., Santhi, C., Harmel, R. D., Van Griensven, A., Van Liew, M. W., Kannan, N., and Jha, M. K.: SWAT: Model use, calibration, and validation, T. ASABE, 55, 1491–1508, 2012.
Barbier, B., Yacouba, H., Maïga, A. H., Mahé, G., and Paturel, J.-E.: Le retour des grands investissements hydrauliques en Afrique de l'Ouest: les perspectives et les enjeux, Geocarrefour, 84, 31–41, https://doi.org/10.4000/geocarrefour.7205, 2009.
Berga, L.: The Role of Hydropower in Climate Change Mitigation and Adaptation: A Review, Engineering, 2, 313–318, https://doi.org/10.1016/J.ENG.2016.03.004, 2016.
De Oliveira, V. A., de Mello, C. R., Viola, M. R., and Srinivasan, R.: Assessment of climate change impacts on streamflow and hydropower potential in the headwater region of the Grande river basin, Southeastern Brazil, Int. J. Climatol., 37, 5005–5023, https://doi.org/10.1002/joc.5138, 2017.
De Souza Dias, V., Pereira da Luz, M., Medero, G. M., and Tarley Ferreira Nascimento, D.: An Overview of Hydropower Reservoirs in Brazil: Current Situation, Future Perspectives and Impacts of Climate Change, Water, 10, 592, https://doi.org/10.3390/w10050592, 2018.
ESA (European Space Agency): GlobCover, http://due.esrin.esa.int/page_globcover.php, last access: 10 December 2021.
GIEC: AR5 Climate Change 2014: Impacts, Adaptation, and Vulnerability. Part B: Regional Aspects, Contribution of Working Group II to the Fifth Assessment Report of the Intergovernmental Panel on Climate Change, edited by: Barros, V. R., Field, C. B., Dokken, D. J., Mastrandrea, M. D., Mach, K. J., Bilir, T. E., Chatterjee, M., Ebi, K. L., Estrada, Y. O., Genova, R. C., Girma, B., Kissel, E. S., Levy, A. N., MacCracken, S., Mastrandrea, P. R., and White, L. L., Cambridge University Press, Cambridge, United Kingdom and New York, NY, USA, 688 pp., https://www.ipcc.ch/report/ar5/syr/ (last access: 10 January 2022), 2014.
Goula, B. T. A., Konan, B., Brou, Y. T., Issiaka, S., Fadika, V., and Srohourou, B.: Estimation des pluies exceptionnelles journalières en zone tropicale: cas de la Côte d'Ivoire par comparaison des lois lognormale et de Gumbel, Hydrolog. Sci. J., 52, 49–67, https://doi.org/10.1623/hysj.52.1.49, 2007.
Grijsen, J.: Understanding the impact of climate change on hydropower: the case of Cameroon, World Bank Report No. 87913, Washington, DC, Africa Energy Practice, IBRD/IDA, https://documents1.worldbank.org/curated/en/243651468010867538/pdf/879130ESW0P1140Box385106B00PUBLIC0.pdf (last access: 3 May 2022), 2014.
Hamududu, B. and Killingtveit, A.: Assessing climate change impacts on global hydropower, Energies, 5, 305–322, https://doi.org/10.3390/en5020305, 2012.
IEA: Statistics report, Renewables Information: Overview, https://www.iea.org/reports/renewables-information-overview (last access: 19 May 2022), 2020.
IHA: Hydropower Status Report, Sector trends and insights, https://www.hydropower.org/status-report, last access: 5 October 2022.
Ivorian Institute of Statistics: Report of the population statistics from the general population and housing census in Côte d'Ivoire, https://www.ins.ci/documents/RGPH2014_expo_dg.pdf (last access: 3 November 2021), 2014.
Kling, H., Stanzel, P., and Fuchs, M.: Regional assessment of the hydropower potential of rivers in West Africa, Enrgy. Proced., 97, 286–293, https://doi.org/10.1016/J.EGYPRO.2016.10.002, 2016.
Kouadio, C. A., Kouassi, K. L., Diedhiou, A., Obahoundje, S., Amoussou, E., Kamagate, B., Paturel, J., Coulibaly, T. J. H., Coulibaly, H. S. J. P., Didi, R. S., and Savane, I.: Assessing the Hydropower Potential Using Hydrological Models and Geospatial Tools in the White Bandama Watershed (Côte d'Ivoire, West Africa), Front. Water, 4, 844934, https://doi.org/10.3389/frwa.2022.844934, 2022.
Kouadio, K. C. A., Amoussou, E., Coulibaly, T. J. H., Diedhiou, A., Coulibaly, H. S. J.-P., Didi, R., and Savane, I.: Analysis of hydrological dynamics and hydropower generation in a West African anthropized watershed in a context of climate change, Modeling Earth Systems and Environment, 6, 2197–2214, https://doi.org/10.1007/s40808-020-00836-4, 2020.
Kouame, Y. M., Obahoundje, S., Diedhiou, A., François, B., Amoussou, E., Anquetin, S., Didi, R. S., Kouassi, L. K., N'guessan Bi, V. H., Soro, E. G., and Yao, E. K.: Climate, Land Use and Land Cover Changes in the Bandama Basin (Côte D'Ivoire, West Africa) and Incidences on Hydropower Production of the Kossou Dam, Land, 8, 103, https://doi.org/10.3390/land8070103, 2019.
Leroy, M., Bicheron, P., Brockmann, C., Krämer, U., Miras, B., Huc, M., Ninô, F., Defourny, P., Vancutsem, C., Petit, D., Amberg, V., Berthelt, B., Arino, O., and Ranera, F.: GlobCover: a 300 m global land cover product for 2005 using ENVISAT MERIS time series, In Proceedings of ISPRS Commision VII Mid-Term Symposium: Remote Sensing: from Pixels to Processes, Enschede (NL), 538–542, http://due.esrin.esa.int/page_globcover.php (last access: 10 December 2021), 2006.
Maher, P. and Smith, N.: Pico hydro for village power: A practical manual for schemes up to 5 kW in hilly areas, 2nd Edn., IntermediateTechnology Publications, 5, Nottingham, UK, https://energypedia.info/images/9/92/Ph_manual_s.pdf (last access: 26 February 2021), 2001.
Neitsch, S. L., Arnold, J. G., Kiniry, J. R., and Williams, J. R.: Soil and Water Assessment Tool Theoretical Documentation Version 2009, USDA-ARS GRASSLAND Publication, Texas Water Resources Institute Technical Report No. 406, 77843-2118, Texas, College Station, https://swat.tamu.edu/media/99192/swat2009-theory.pdf (last access: 26 February 2021), 2011.
Nonki, R. M., Lenouo, A., Tchawoua, C., Lennard, C. J., and Amoussou, E.: Impact of climate change on hydropower potential of the Lagdo dam, Benue River Basin, Northern Cameroon, Proc. IAHS, 384, 337–342, https://doi.org/10.5194/piahs-384-337-2021, 2021.
Pandey, B. K., Khare, D., Kawasaki, A., and Mishra, P. K.: Climate Change Impact Assessment on Blue and Green Water by Coupling of Representative CMIP5 Climate Models with Physical Based Hydrological Model, Water Resour. Manage., 33, 141–158, https://doi.org/10.1007/s11269-018-2093-3, 2019.
Saha, S., Moorthi, S., Wu, X., Wang, J., Nadiga, S., Tripp, P., Behringer, D., Hou, Y.-T., Chuang, H., Iredell, M., Ek, M., Meng, J., Yang, R., Mendez, M.P., van den Dool, H., Zhang, Q., Wang, W., Chen, M., and Becker, E.: The NCEP Climate Forecast System Version 2, J. Climate, 27, 2185–2208, https://doi.org/10.1175/JCLI-D-12-00823.1, 2014.
Savane, I., Coulibaly, K. M., and Gioan, P.: Variabilité climatique et ressources en eaux souterraines dans la région semi-montagneuse de Man, Science et changements planétaires/Sécheresse, 12, 231–237, 2002.
SWAT (Soil & Water Assessment Tool): CFSR Global Weather Data for SWAT 1979–2014, https://globalweather.tamu.edu/, last access: 10 December 2021.
Teutschbein, C. and Seibert, J.: Bias correction of regional climate model simulations for hydrological climate-change impact studies: Review and evaluation of different methods, J. Hydrology, 456–457, 12–29, https://doi.org/10.1016/j.jhydrol.2012.05.052, 2012.
Turner, S. W. D., Hejazi, M., Kim, S. H., Clarke, L., and Edmonds, J.: Climate impacts on hydropower and consequences for global electricity supply investment needs, Energy, 141, 2081–2090, https://doi.org/10.1016/j.energy.2017.11.089, 2017.
USGS (United States Geological Survey): EarthExplorer, https://earthexplorer.usgs.gov, last access: 10 December 2021.
Williams, J. R.: Flood routing with variable travel time or variable storage coefficients, T. ASAE, 12, 100–103, 1969.
Yira, Y., Mutsindikwa, T. C., Bossa, A. Y., Hounkpè, J., and Salack, S.: Assessing climate change impact on the hydropower potential of the Bamboi catchment (Black Volta, West Africa), Proc. IAHS, 384, 349–354, https://doi.org/10.5194/piahs-384-349-2021, 2021.