the Creative Commons Attribution 4.0 License.
the Creative Commons Attribution 4.0 License.
 | 19 Apr 2024
Investigation of drought and flooding areas in coastal countries of West Africa in the context of global warming
Domiho Japhet Kodja
Gandomè Mayeul Leger Davy Quenum
Houteta Djan'na Koubodana
Ernest Amoussou
Isaiah Sewanu Akoteyon
Arsène Sègla Josué Akognongbé
Mahougnon Fidèle Ahéhéhinnou Yêdo
Gil Mahé
Jean-Emmanuel Paturel
Expédit Wilfrid Vissin
Constant Houndénou
This study investigated drought and flooding changes in West Africa between 1983–2012 and projected near future (2025–2054) periods. The datasets used are the CHIRTS and CHIRPS-2 for observed reanalysis and five (05) models of ISIMIP2b for Shared Socio-economic Pathways (SSP1.2-6 and SSP5-8.5). Extremely and very wet days total precipitation (R95pTOT; R99pTOT) and Standardized Precipitation Evapotranspiration Index (SPEI) were employed to investigate floods and drought spatial distribution using Sen Slope trend analysis method. The results showed that there is a variability in the spatial distribution of extreme indices with an upward and downward trend of dry and wet rainfall periods in West Africa in both historical and projected periods. This observation suggests that the study area is faced with rainfall variability marked by extreme events. A further examination on the spatial and temporal distribution of flood occurrence showed that more flood events were observed in the Gulf of Guinea and Savannah countries, followed by an increase in uniform spatial distribution and moderate wet days both under SSP1.2.6, and SSP 5.8.5. In addition, result showed that an upward trend in wet periods can cause the occurrence of extreme events associated with floods in the context of global warming. However, with these scenarios negative changes are not excluded in the East, the Sahel and some western part of the Gulf of Guinea in the study area for the SSP5.8.5 scenario. Thus, the results revealed that the spatio- temporal variability of extreme rainfall can have repercussions on the hydrological functioning of watersheds, water availability and water-dependent activities.
- Article
(5634 KB) - Full-text XML
- BibTeX
- EndNote


Flood; drought; extreme precipitation; SPEI; global warming; West Africa
In recent decades, West Africa has been faced with a high frequency and intensity of extreme hydro-meteorological events which are mostly detrimental to socio-economic and environmental issues (Quenum et al., 2019; Ajayi et al., 2020). Thus, with the effects of global warming, precipitation regimes are not only affected, but also an uneven distribution of precipitation is observed with repercussions on the hydrodynamic functioning of watersheds and the quality of water resources within the in ecosystems (Quenum et al., 2019). The Inter-Governmental Panel on Climate Change (IPCC) predicts changes in temperature and precipitation regimes with a high degree of confidence in the increase in the frequency of extreme events (Pedersen et al., 2022). This frequency is linked to the increase in the intensity and duration of storms, cold or heat waves, the increase in the extent of regions affected by drought and unexpected floods accompanied by uneven consequences distributed for many regions. According to Obahoundjè et al. (2017), the rainfall recession can reduce the availability of water resources with exacerbation on agricultural land, industry, energy, food security and river flow regimes. As for the occurrence of extreme rainfall, it can cause the destruction of lives and properties of communities, most of which are already vulnerable to extreme weather and climate conditions with threats of terrorism (Odoulami et al., 2019). Faced with this situation, the analysis of the spatio-temporal distribution of rainfall as well as that of these trends arouse the curiosity of this study not only to contribute to the improvement and integrated management of water resources but also for policy formulation, taking into account the impact of climate change on socio-economic and environmental developmental programs with a view to integrating it into the Sustainable Development Goals (SDGs). The analysis of various characteristics and trends of precipitation is an essential task to improve the utilization of water resources. To do this, several works have frequently used trend analysis in the context of rainfall or even hydrological variability based on approaches such as linear regression, Sen slope, Spearman's rho and trend tests by Mann-Kendall (Quenum et al., 2019). However, this study conducted statistical analyses of precipitation data using the Sen's slope that is basically applied to identify the magnitude of trend in a data series which are not serially auto-correlated (Şen, 2015).
The study therefore seek to investigate the extreme events of drought and flooding inherent to rainfall in coastal countries in West Africa in the context of global warming.
1.1 The study area
The study area (Fig. 1) is located between latitudes 0–20° N and longitudes 20° E–20° N which covers the Sahel, the Sudano-Sahelian and the Guinea coast regions. The study focused much more on this last region with specific analyses on the coastal countries (Senegal, Côte d'Ivoire, Benin, Togo and Nigeria) which have watersheds with hydrological potential for energy and agricultural purposes.

Figure 1Geographical location of the study area.
2.1 Data sources
For this study we used the daily observed reanalysis covering (1983–2012) of CHIRTS (Tmin and Tmax) and CHIRPS-2 (Rainfall) for 0.05° × 0.05° resolution to evaluate the accuracy of the climate models (https://data.chc.ucsb.edu/products/CHIRPS-2.0/, last access: 7 September 2023) CHIRTS and CHIRPs-2 data have been validated with observation over West Africa by previous studies (Atiah et al., 2020; Dembélé et al., 2016). The ensemble mean of the five models of ISIMIP2b (GFDL, IPSL, MPI, MRI, UKESM1, daily 0.5° × 0.5°) of (pr, tasmin, tasmax) over the historical period spanning 1983 to 2012 and near future 2025–2054 with the scenarios SSP 1.2.6 and SSP 5.8.5 were merged to analyse drought and flooding areas in coastal countries of West Africa (Table 1) https://www.isimip.org/gettingstarted/isimip2b-bias-adjustment/ (last access: 7 September 2023).
Table 1Type of the scenarios.

Source: Adapted from CMIP 5 and CMIP6 Scenario comparison
We used minimum and maximum temperature to compute the Potential Evapotranspiration (PET) in the study area.
2.2 Methods
2.2.1 Characterization of flood events
For the characterization of areas or land prone to drought or flooding in the coastal countries of West Africa in the context of global warming, certain indices were developed by the Expert Team on Climate Change Detection Indices (ETCCDI) were employed. Detailed descriptions of these indices are available on the ETCCDI website (http://cccma.seos.uvic.ca/ETCCDMI/software.shtml, last access: 7 September 2023). In the present study, two (02) indices were calculated and they are based on the extreme rainfall characteristic of floods.
-
R95pTOT. Annual total PRCP when RR > 95p. Let RRwj be the daily precipitation amount on a wet day w (RR ≥ 1.0 mm) in period I and let RRwn95 be the 95th percentile of precipitation on wet days. If W represents the number of wet days in the period. R95pTOT were calculated by Eq. (1):
-
R99pTOT. Annual total PRCP when RR > 99p: Let RRwj be the daily precipitation amount on a wet day w (RR ≥ 1.0 mm) in period i and let RRwn99 be the 99th percentile of precipitation on wet days. If W represents the number of wet days in the period. R99pTOT were calculated by Eq. (2):
2.2.2 Standardized Precipitation and Evapotranspiration Index (SPEI)
The normalized precipitation evapotranspiration index (SPEI) was highlighted in 2010 and has been the subject of several studies in climatology, hydrology, water availability and in research relating to agrarian systems (N'guessan Bi et al., 2020). The normalized precipitation evapotranspiration index (SPEI) focus on the difference between precipitation and potential evaporation instead of just precipitation (Vicente-Serrano et al., 2010). Thus, given its specificity in measuring the severity of drought, analyzed drought variability and also of extreme wetness (Allen et al., 2011), it was adopted in this research. The normalized precipitation evapotranspiration index were calculated for 1, 3, 6, 9 and 12 months on each grid point for each dataset (Quenum et al., 2019). However for this study, the results presented are those of the SPEI generated over 12 months because the latter provide a representation of long-term precipitation patterns such as those calculated over 12 months and contribute to the detection of hydrological impacts (OMM and GWP, 2016). The calculation method used in this research is presented in Table 2.
Table 2Classification of SPEI values.
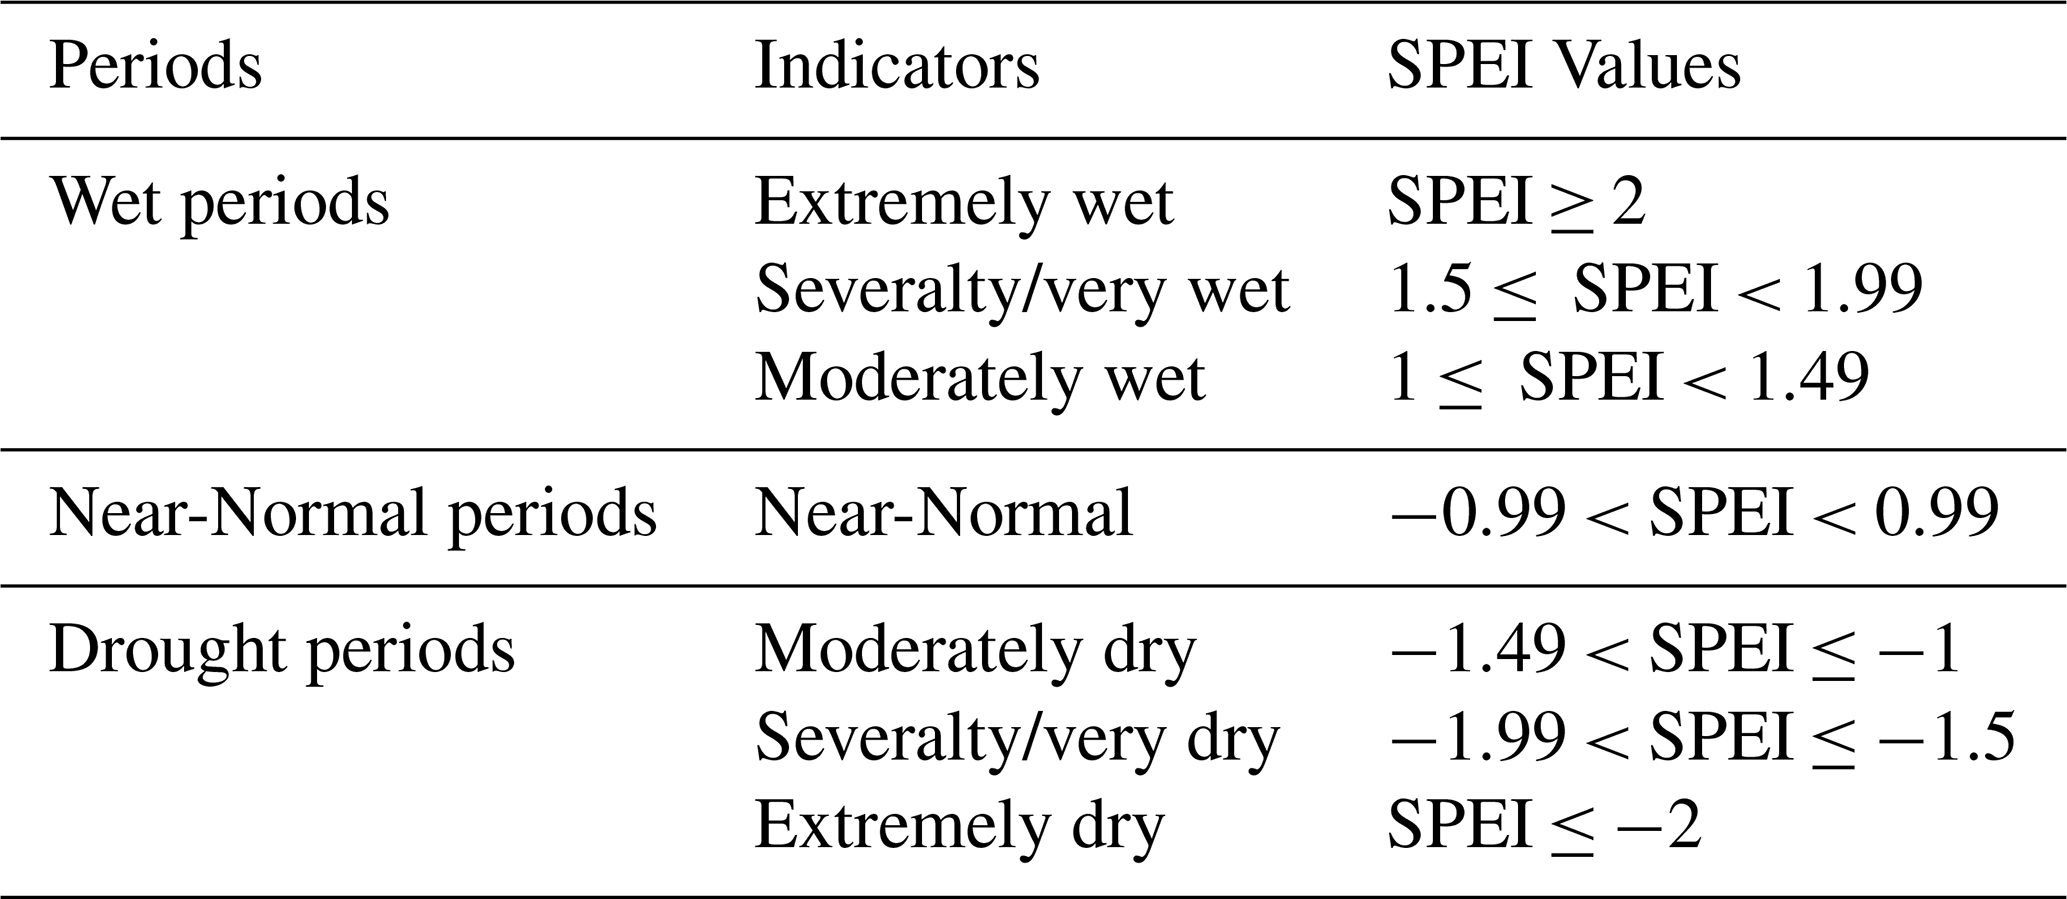
Source: Adapted from Vicente-Serrano et al. (2010).
The computation of potential evapotranspiration is used to calculate the normalized Precipitation-Evapotranspiration Index (SPEI). For that, Thornthwaite equation was used in this research.
2.2.3 Method of trend analysis
Trend analysis of rainfall time series includes determination of increasing and decreasing trend and magnitude of trend and its statistical significance” (Quenum et al., 2019). Then the Sen Slope trend was employed for this research. In addition these indicators were calculated on historical (1983–2012) and near future periods (2025–2054) of precipitation in West Africa.
3.1 Spatial trend analysis of precipitation on very wet by R95pTOT and extremely wet R99pTOT under historical period (1983–2012)
The spatial trend of the extremely wet period under 1983–2012 (Fig. 2), reveals on the one part that the very wet period (R95pTOT) trend increase (between 0 to 0.5) over the entire West Africa domain characterized by a positive slope. It is important to note that this increase is slightly small in Southern and concern Benin, Togo, Ghana, Ivory Coast during the historical periods. This is also true in Sahel countries.

Figure 2Trends of the slope in the precipitation on very and extremely wet period during 1983–2012.
As for the trend of extremely wet (R99pTOT) period, a slight increase was observed (between 0 to 1) over the entire West Africa domain characterized by a positive slope. For this result, it is clear that there will be a decreasing trend of R99pTOT along the Guinea Coast (North Benin, Togo and Ghana). A similar trend was also observed in other countries located in the Sahara and Sahel such as Burkina Faso and Mali as well as Northern Cameroon and the lac Tchad.
3.2 Spatial trend analysis of precipitation on very wet by R95pTOT and extremely wet R99pTOT near future period (2025–2054) with scenario SSP 1.2.6 and SSP 5.8.5
Trend in very wet period characterize by R95pTOT (Fig. 3) shows a slight decrease and increase trend during the SSP 1.2.6 scenario in the near future while the results reveals a clear increasing trend over the entire West Africa domain under SSP 5.8.5 scenario characterized by a positive slope.

Figure 3Trend of Slope on very wet period in near future period (2025–2054) with scenario SSP 1.2.6 and SSP 5.8.5.
The analysis of the results by R99pTOT (Fig. 4) shows a slight decrease trend during the SSP1.2.6 scenario in the near future while we noted a clear increasing trend over the entire West Africa, basically in the gulf of Guinea under SSP 5.8.5 scenario characterized by a positive slope (Fig. 4).
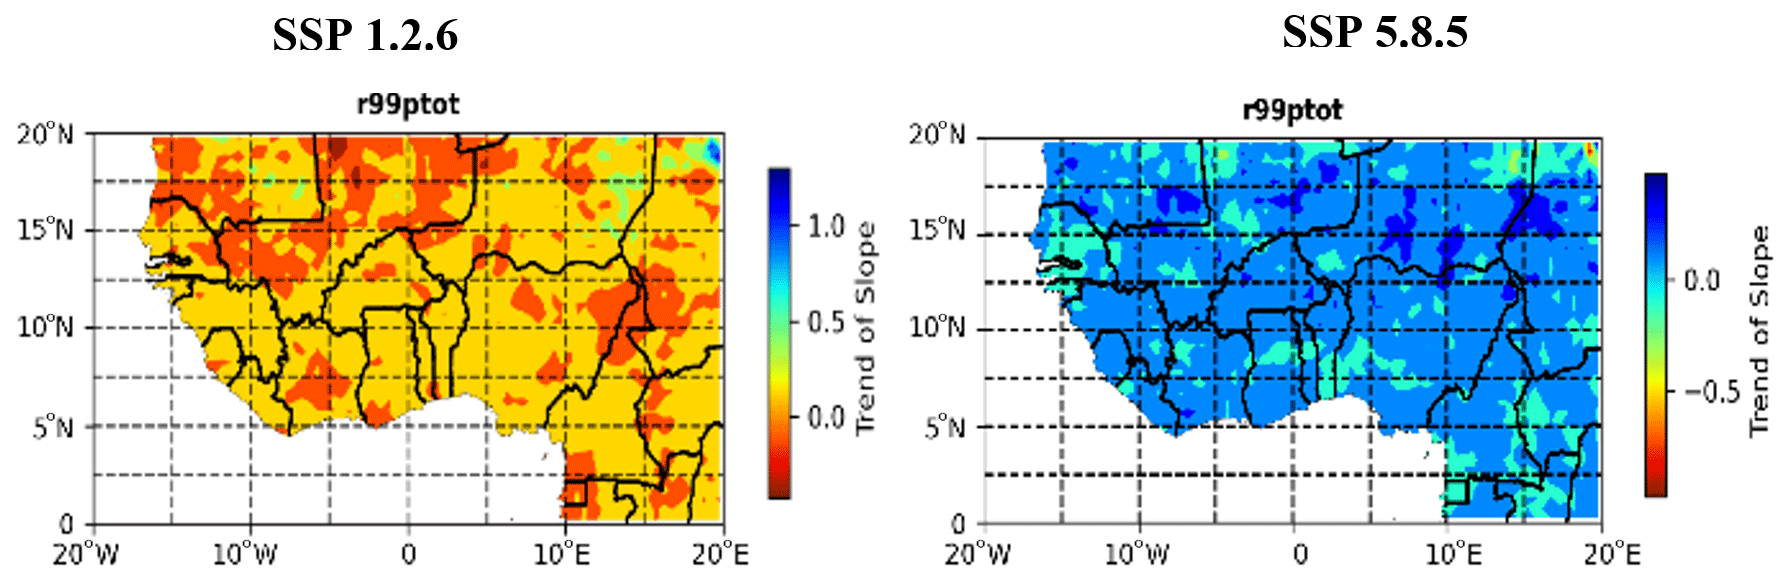
Figure 4Trend of Slope of the Scenarios SSP 1.2.6 and SSP 5.8.5 of wet period from SPEI for 12 months on 2025–2054.
3.3 Analysis of trend in the wet and drought period with SPEI for 12 months in the historical period (1983–2012)
From near normal to extremely wet (Fig. 5), the spatial analysis of trend by SPEI under 12 months, show a slight decrease (between 0 to −2) and an increase (between 0 to 2) trend during the historical which varies from one country to another. Such a situation can contribute to the occurrence of floods.
Concerning the characterization of drought (Fig 6), it was observed that from moderate to extremely dry, the spatial analysis of trend by SPEI shows a slight increase (between 0 to 1) and decrease (between 0 to −2) trend during the historical area; which suggests that there is an upward trend of wet rain events reported on the analysis of Fig. 3.

Figure 5Trend of the slope of historical wet from SPEI for 12 months under 1983–2012.

Figure 6Trend of the slope of historical drought from SPEI for 12 months under 1983–2012.
This situation described above may have repercussions both on water-dependent activities and on the hydrological and hydroelectric dynamics of the West African watersheds.
The results show that from normal to extremely wet, the spatial analysis of trend by SPEI show a slight decrease (between 0 to −2) and increase (between 0 to 2) which varies from one country to another in near future (2025–2054) under the SSP 1.2.6 (Fig. 7).

Figure 7Trend of the in the wet period from SPEI for 12 months in near future period (2025–2054) with scenario SSP 1.2.6.
According to the analysis of Fig. 8, it should be noted that the same scenario under SSP 1.2.6 was observed but the wet period under SSP 5.8.5 will decrease slightly more than the SSP 1.2.6 scenario.
Based on this result, we inferred that the data from the SSP 1.2.6 scenarios are less pessimistic than those of SSP 5.8.5 and can be used to characterize wet rainfall events.
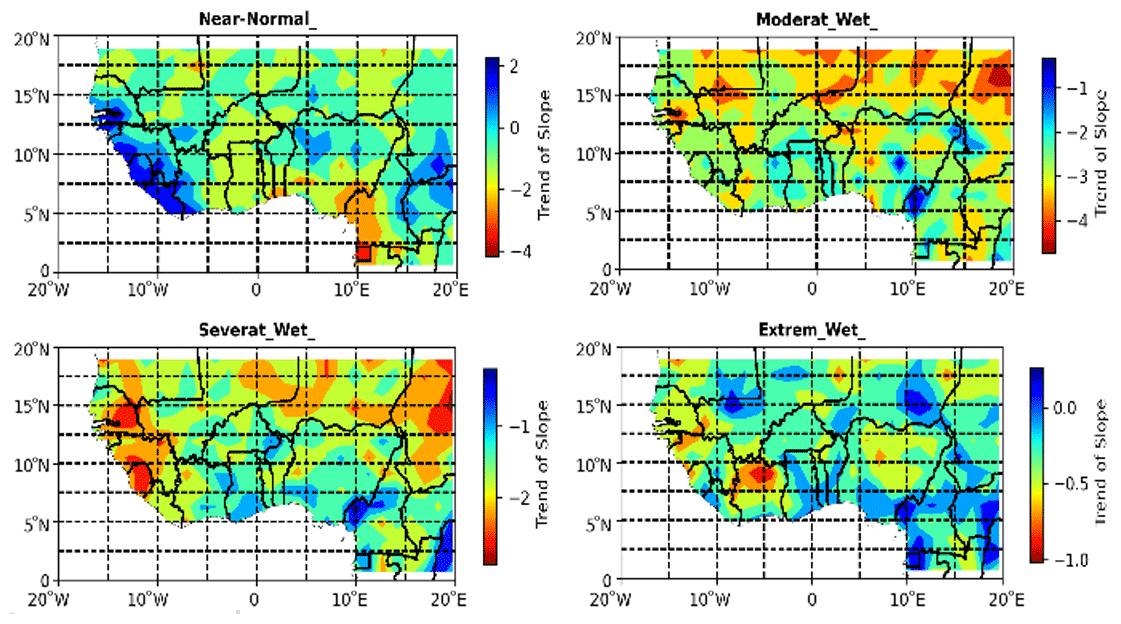
Figure 8Trend of the in the wet period with SPEI for 12 months in near future period (2025–2054) with scenario SSP 1.2.6.

Figure 9Trend of the in the drought period with SPEI for 12 months in near future period (2025–2054) with scenario SSP 1.2.6.
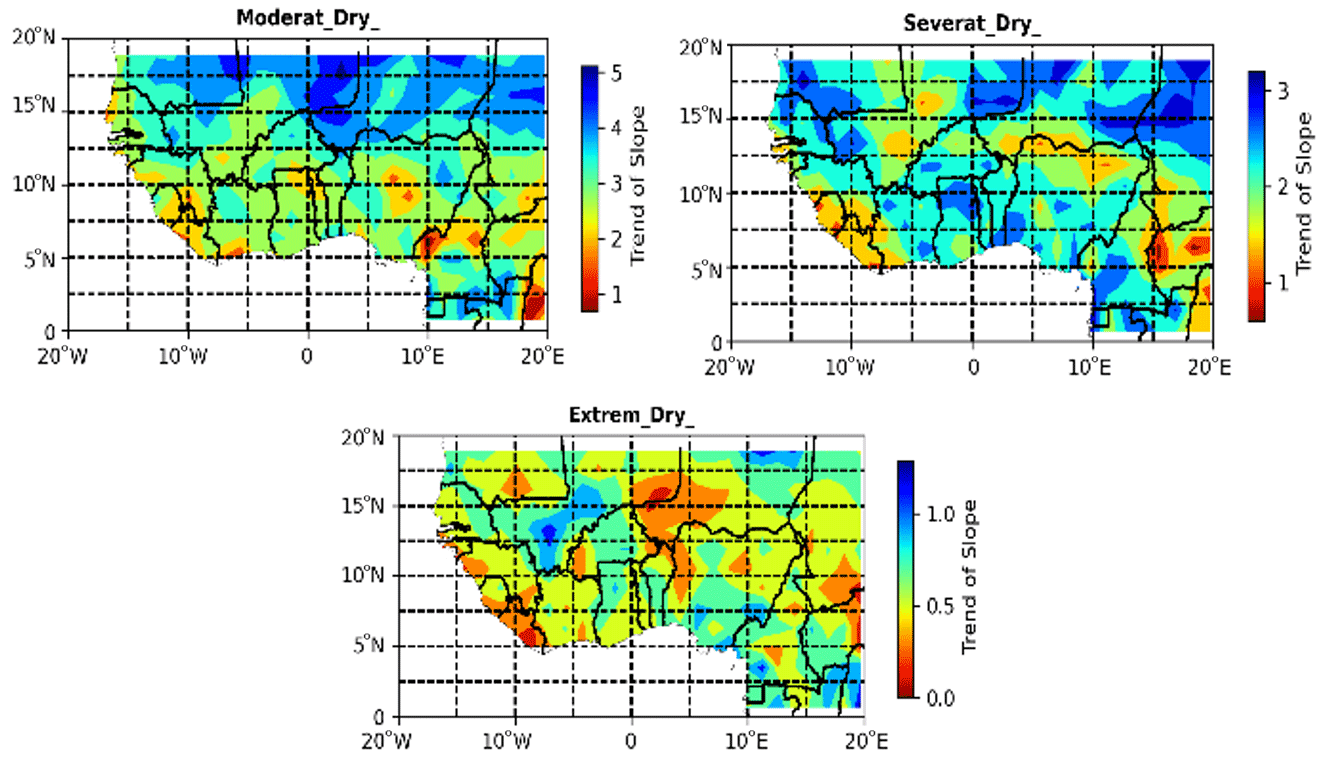
Figure 10Trend of the in the drought period with SPEI for 12 months in near future period (2025–2054) with scenario SSP 5.8.5.
During the near future period (2025–2054) with scenario SSP 1.2.6, the results (Fig. 9), depict moderate to extremely dry, while the spatial trend by the SPEI show a slight increase of dry period in costal country in the Gulf of Guinea and significance increase in the Sahel under the SSP 1.2.6.
This situation with SSP 1.2.6 scenario in the Gulf of Guinea may be due to the influence of other physical factors such as oceanic effects that contributed to rainfall and the regulation of global warming.
The results of Fig. 10, revealed the same situation as scenario SSP 1.2.6. However, the drought with SSP 5.8.5 will be slightly more severe than the 1.2.6 scenario that was characterized by the drought period. We opined that the data of the SSP 5.8.5 scenario are more pessimistic than those of the SSP 1.2.6 scenario in terms of global warming.
The study confirmed that there is variability in the spatial distribution of rainfall indices with an upward and downward trend of dry and wet periods in the study area.
This situation is much more remarkable in the countries of the Gulf of Guinea and can however cause extreme rainfall events associated with floods or dry spells and consequently repercussions on water-dependent activities and the hydrological dynamics of rivers. Considering the data series studied, the upward trends in rainfall confirmed the return period of rainfall reported in many studies over West African countries. However, the upward trend is weak. In conclusion, the countries of the Gulf of Guinea and the Sahelian border to the north of the study area are the wettest. In addition, the upward or downward trend varies from one scenario to another. The data analysis of the different scenarios SSP 1.2.6 and 5.8.5 deserve to be deepened in future studies.
The CHIRTS, CHIRPS-2 observation reanalysis and climate model data are available online at https://data.chc.ucsb.edu/products/CHIRPS-2.0/ (last access: 7 September 2023) and https://doi.org/10.5281/zenodo.1069050 (Lange, 2017).
DJK: Conceptualization, Methodology, Software, Data curation, Formal analysis, Validation, Writing – original draft. GMLDQ and HDK: Conceptualization, formal analysis review, editing the original draft. EA, ISA, ASJA, MFAY, GM, JEP, EWV, and CH: Investigation editing, review and supervision.
The contact author has declared that none of the authors has any competing interests.
Publisher's note: Copernicus Publications remains neutral with regard to jurisdictional claims in published maps and institutional affiliations.
This article is part of the special issue “IAHS2022 – Hydrological sciences in the Anthropocene: Variability and change across space, time, extremes, and interfaces”. It is a result of the XIth Scientific Assembly of the International Association of Hydrological Sciences (IAHS 2022), Montpellier, France, 29 May–3 June 2022.
Authors would like to thank the IAHS SYSTA award funding to participate at IAHS 2022 Scientific Assembly, Montpellier, France, 2022. We also thank the anonymous reviewers of this work for their contribution to improving the quality of this study.
This paper was edited by Christophe Cudennec and reviewed by two anonymous referees.
Ajayi, V. O. and Ilori, O. W.: Projected drought events over West Africa using RCA4 regional climate model, Earth Syst. Environ., 4, 329–348, https://doi.org/10.1007/s41748-020-00174-6, 2020.
Allen, K. J., Ogden, J., Buckley, B. M., Cook, E. R., and Baker P. J.: The potential to reconstruct broadscale climate indices associated with southeast Australian droughts from Athrotaxis species, Tasmania, Clim. Dynam., 37, 1799–1821, https://doi.org/10.1007/s00382-011-1011-7, 2011.
Atiah, W. A., Amekudzi, L. K., Aryee, J. N. A., Preko, K., and Danuor, S. K.: Validation of satellite and merged rainfall data over Ghana, West Africa, Atmosphere, 11, 859, https://doi.org/10.3390/atmos11080859, 2020.
Dembélé, M. and Zwart, S. J.: Evaluation and comparison of satellite-based rainfall products in Burkina Faso, West Africa, Int. J. Remote Sens., 37, 3995–4014, https://doi.org/10.1080/01431161.2016.1207258, 2016.
Lange, S.: ISIMIP2b Bias-Correction Code, Zenodo [code], https://doi.org/10.5281/zenodo.1069050, 2017.
N'guessan Bi, V. N. G., Adjakpa, T., Allechy, F., Ta, M. Y., Assa, Y., and Affian, K.: Characterization of the drought by the SPI and SPEI indices in the west center of Côte d'Ivoire case of the lobo basin, LARHYSS J., 43, 23–39, 2020.
Obahoundjè, S., Ofosu, E. A., Akpoti, K., and Kabo-bah, A. T.: Land Use and Land Cover Changes under Climate Uncertainty: Modelling the Impacts on Hydropower Production in Western Africa, Hydrology, 4, 2, https://doi.org/10.3390/hydrology4010002, 2017.
Odoulami, R. C., Abiodun, B. J., and Ajayi, A. E.: Modelling the potential impacts of afforestation on extreme precipitation over West Africa, Clim. Dynam., 52, 2185–2198 https://doi.org/10.1007/s00382-018-4248-6, 2019.
OMM and GWP: Handbook of Drought Indicators and Indices, Integrated Drought Management Program, Integrated Drought Management Program Tools and Guidelines Series 2, edited by: Svoboda, M. and Fuchs, B. A., Geneva, ISBN 978-92-63-11173-9/ISBN 978-91-87823-24-4, 2016.
Pedersen, J. T. S., van Vuuren, D., Gupta, J., Santos, F. D., Edmonds, J., and Swart, R.: IPCC emission scenarios: How did critiques affect their quality and relevance 1990–2022, Global Environ. Chang., 75, 102538, https://doi.org/10.1016/j.gloenvcha.2022.102538, 2022.
Quenum, G. M. L., Klutse, N. A., Dieng, D., Laux, P., Arnault, J., Kodja, J., and Oguntunde, P. G.: Identification of potential drought areas in West Africa under climate change and variability, Earth Syst. Environ., 3, 429–444, https://doi.org/10.1007/s41748-019-00133-w, 2019.
Şen, Z.: Innovative trend significance test and applications, Theor. Appl. Climatol., 127, 939–947, https://doi.org/10.1007/s00704-015-1681-x, 2015.
Vicente-Serrano, S. M., Begueria, S., and Lopez-Moreno, J. I.: A Multiscalar Drought Index Sensitive to Global Warming: The Standardized Precipitation Evapotranspiration Index, J. Climate, 23, 1696–1718, https://doi.org/10.1175/2009JCLI2909.1, 2010.