the Creative Commons Attribution 4.0 License.
the Creative Commons Attribution 4.0 License.
 | 19 Apr 2024
Influence of data spatial resolution in water resources management for oak-savanna distinctive vegetation patches
Elisabet Carpintero
María J. Muñoz-Gomez
Ángel Blázquez-Carrasco
María P. González-Dugo
In Mediterranean oak-savannas (known as dehesas in Spain), it is important to better understand the interactions between vegetation structure and local climate regulation at scales relevant to farm management and the dominant hydrological regime. This study evaluated the water use patterns of dehesa vegetation patches (open grasslands, lowland grasslands with high soil moisture, tree + grass, and riparian vegetation), estimating actual evapotranspiration (ET). We used different models, previously validated in the area, that integrate remotely sensed data. They apply (a) a soil water balance (Kc-FAO56), (b) a surface energy balance (ALEXI/DisALEXI, and SEBS), and (c) a sharpening algorithm (STARFM), obtaining products at multiple spatial resolutions (30 m, 1 km, 5 km). The conceptual and operational differences between the methodologies reinforce the idea of a combined application of models. We demonstrated the need for high spatial and temporal resolution for on-farm livestock management due to the importance of the grasslands layer. This scale is crucial to determine the grass's emergence/drying cycle, which is key for livestock feeding planning. In humid/denser areas that provide essential ecosystem services (e.g., refuge, pasture rotation), transpiration rates are higher throughout the year and were underestimated when coarser spatial scale data was used. Over the typical system (grass with dispersed trees), the ET maps at low spatial resolution reflected the water use trends, and all models correlated well. Higher differences were found when comparing the models' performance over open grasslands.
- Article
(5112 KB) - Full-text XML
- BibTeX
- EndNote


Remote sensing; Mediterranean oak-savannas; soil water balance; surface energy balance; UPH 5; Panta Rhei
Dehesas, Spanish semiarid oak-savannas, are agroforestry ecosystems distributed in Mediterranean-type climatic areas, thus periodically subject to water scarcity conditions. They play a key role in rural development, basing their production on multiple uses (e.g., livestock, agriculture, hunting). Their importance as biodiversity reservoirs is recognized internationally (Habitats Directive 92/43/EEC and Natura 2000 Network). Although dehesas are adapted to highly variable climatic conditions and dry periods during the summer, the increase in drought intensity, duration, and frequency, changes in agricultural practices, pests, diseases, and other socioeconomic and environmental factors contribute to their degradation.
Moreover, global change alters climate patterns by increasing interannual variability and the incidence of extreme and torrential events. The vegetation cover largely determines the interaction between climate processes in semiarid agroforestry systems. Therefore, vegetation management is crucial not only to preserve the biodiversity and profitability of dehesas but to design strategies to reduce their vulnerability.
Oak-savannas have a complex structure with multiple layers of vegetation that differ in phenology, physiology, and function, contributing differently to the ecosystem fluxes. This structure plays a crucial role in savannas' resilience, allowing them to efficiently convect sensible heat and to maintain vegetation temperature within the adequate range (Johnston et al., 2021), providing food and heat comfort to animals.
In these systems, the variability of vegetation distribution creates different spaces that influence ecological processes. The diversity of spaces is altered and maintained through agricultural practices. For example, (1) tree dispersion allows radiation to reach the downstory, but the trees act as a screen, decreasing the light underneath, and animals use their shade in summer. (2) During day time, grasses have an efficient cooling effect when atmospheric evaporative demand is high. During the hot season, a dry grass layer also reduces surface radiometric temperature (Johnston et al., 2022). (3) Trees influence grass communities by augmenting habitat heterogeneity and increasing the total species richness. Altering the structural environment (e.g., regeneration of trees and shrubs or modification of grass communities) can be valuable in conserving resources while enhancing carbon fixation or animal health.
As a first step, we want to better understand the interactions between vegetation structure and water consumption dynamics at scales relevant to farm management and the dominant hydrological regime.
In this study, we analyze the patterns of water use (evapotranspiration – ET) of different spaces of the dehesa, (A) open grasslands, (B) lowland grasslands with high soil moisture, (C) tree + grass, and (D) riparian vegetation, estimated with different model schemes that integrate data obtained by remote sensors at different scales (5 km, 1 km, 30 m). Our objective was to evaluate the possibilities offered by the different spatial resolutions and methodologies for the management of this ecosystem's vegetated spaces.
The study was conducted in an experimental dehesa farm located in the Sierra de Cardeña & Montoro Natural Park in southern Spain (Santa Clotilde, 38°12′ N, 4°17′ W, 736 m a.s.l., with two eddy covariance towers measuring water and carbon fluxes, Fig. 1). More information about the installation in Andreu et al. (2018) and Carpintero et al. (2020). The area has Mediterranean climate, with strong seasonality, moderately cold winters and long, hot, and dry summers. Precipitation is highly variable (annual average =895 mm from 1990 to 2015), mainly concentrated in spring and autumn. The vegetation consists primarily of widely spaced Quercus ilex L. combined with a herbaceous stratum composed of annual grasslands (which emerge after the autumn rains and dry up in late spring).
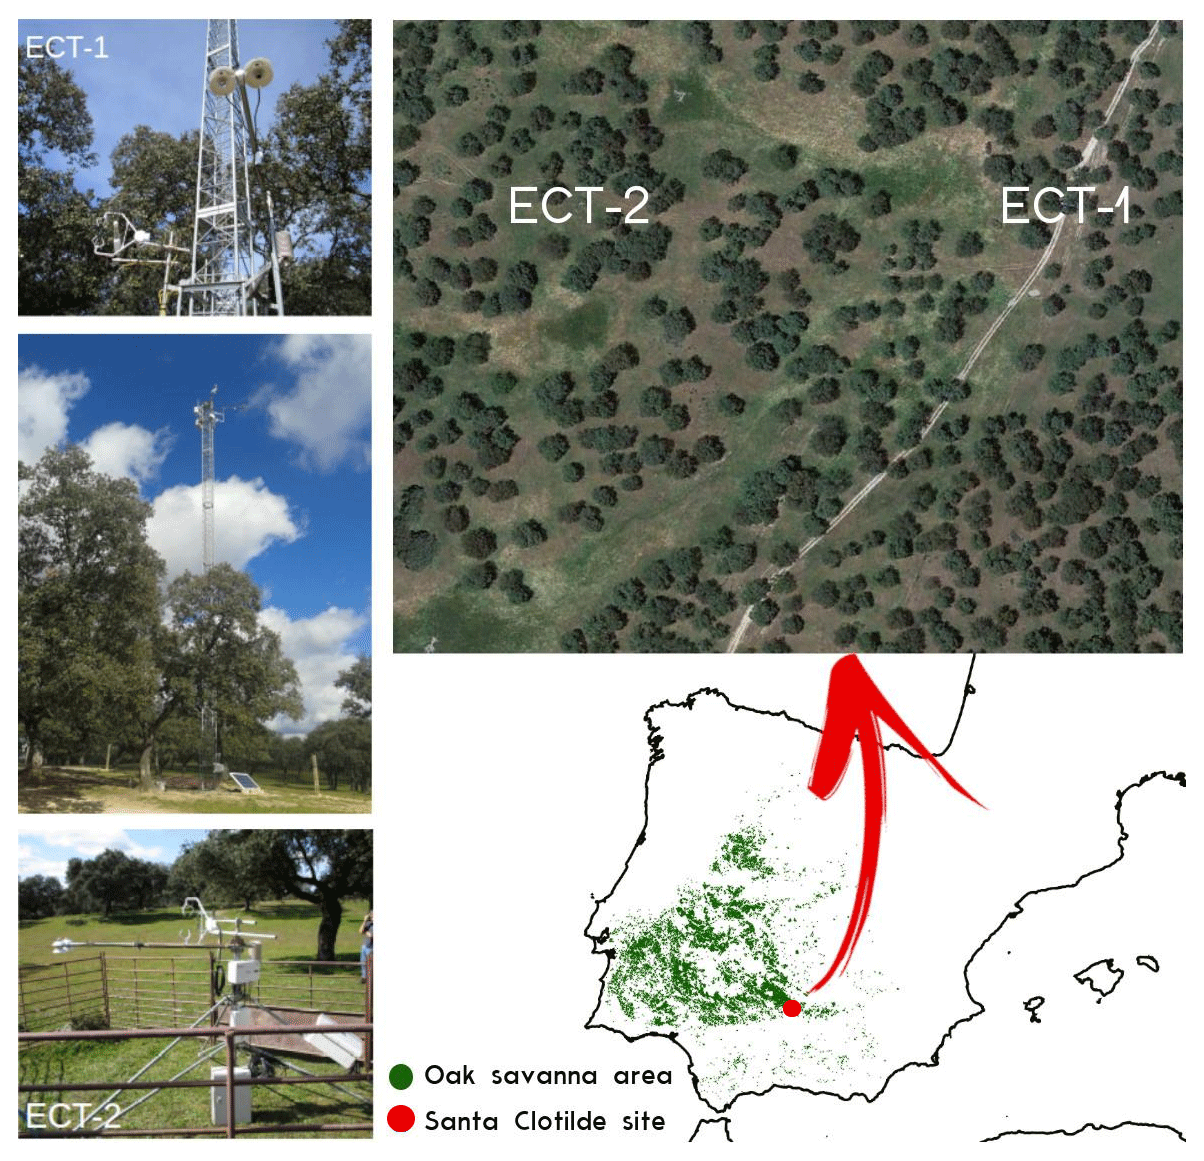
Figure 1Dehesa farm study site and the location of the two eddy covariance towers over the area (ECT-1 tree + grass system, which is zone C, and the ECT-2 over grass). Aerial image from © Google Maps.
ET patterns were analyzed in 4 zones (Fig. 2). Zone A (1700 m2) is a grassland with high temporal and spatial variability. Zone B (2400 m2) is a grassland located in a land depression that accumulates water most of the year and maintains higher humidity. Zone C (4300 m2) is a tree + grass structure (25 % tree fractional cover) standard of dehesas (the area surrounding ECT-1). Zone D (3300 m2) is located near a stream with riparian vegetation (trees and an underlayer of evergreen scrubs).
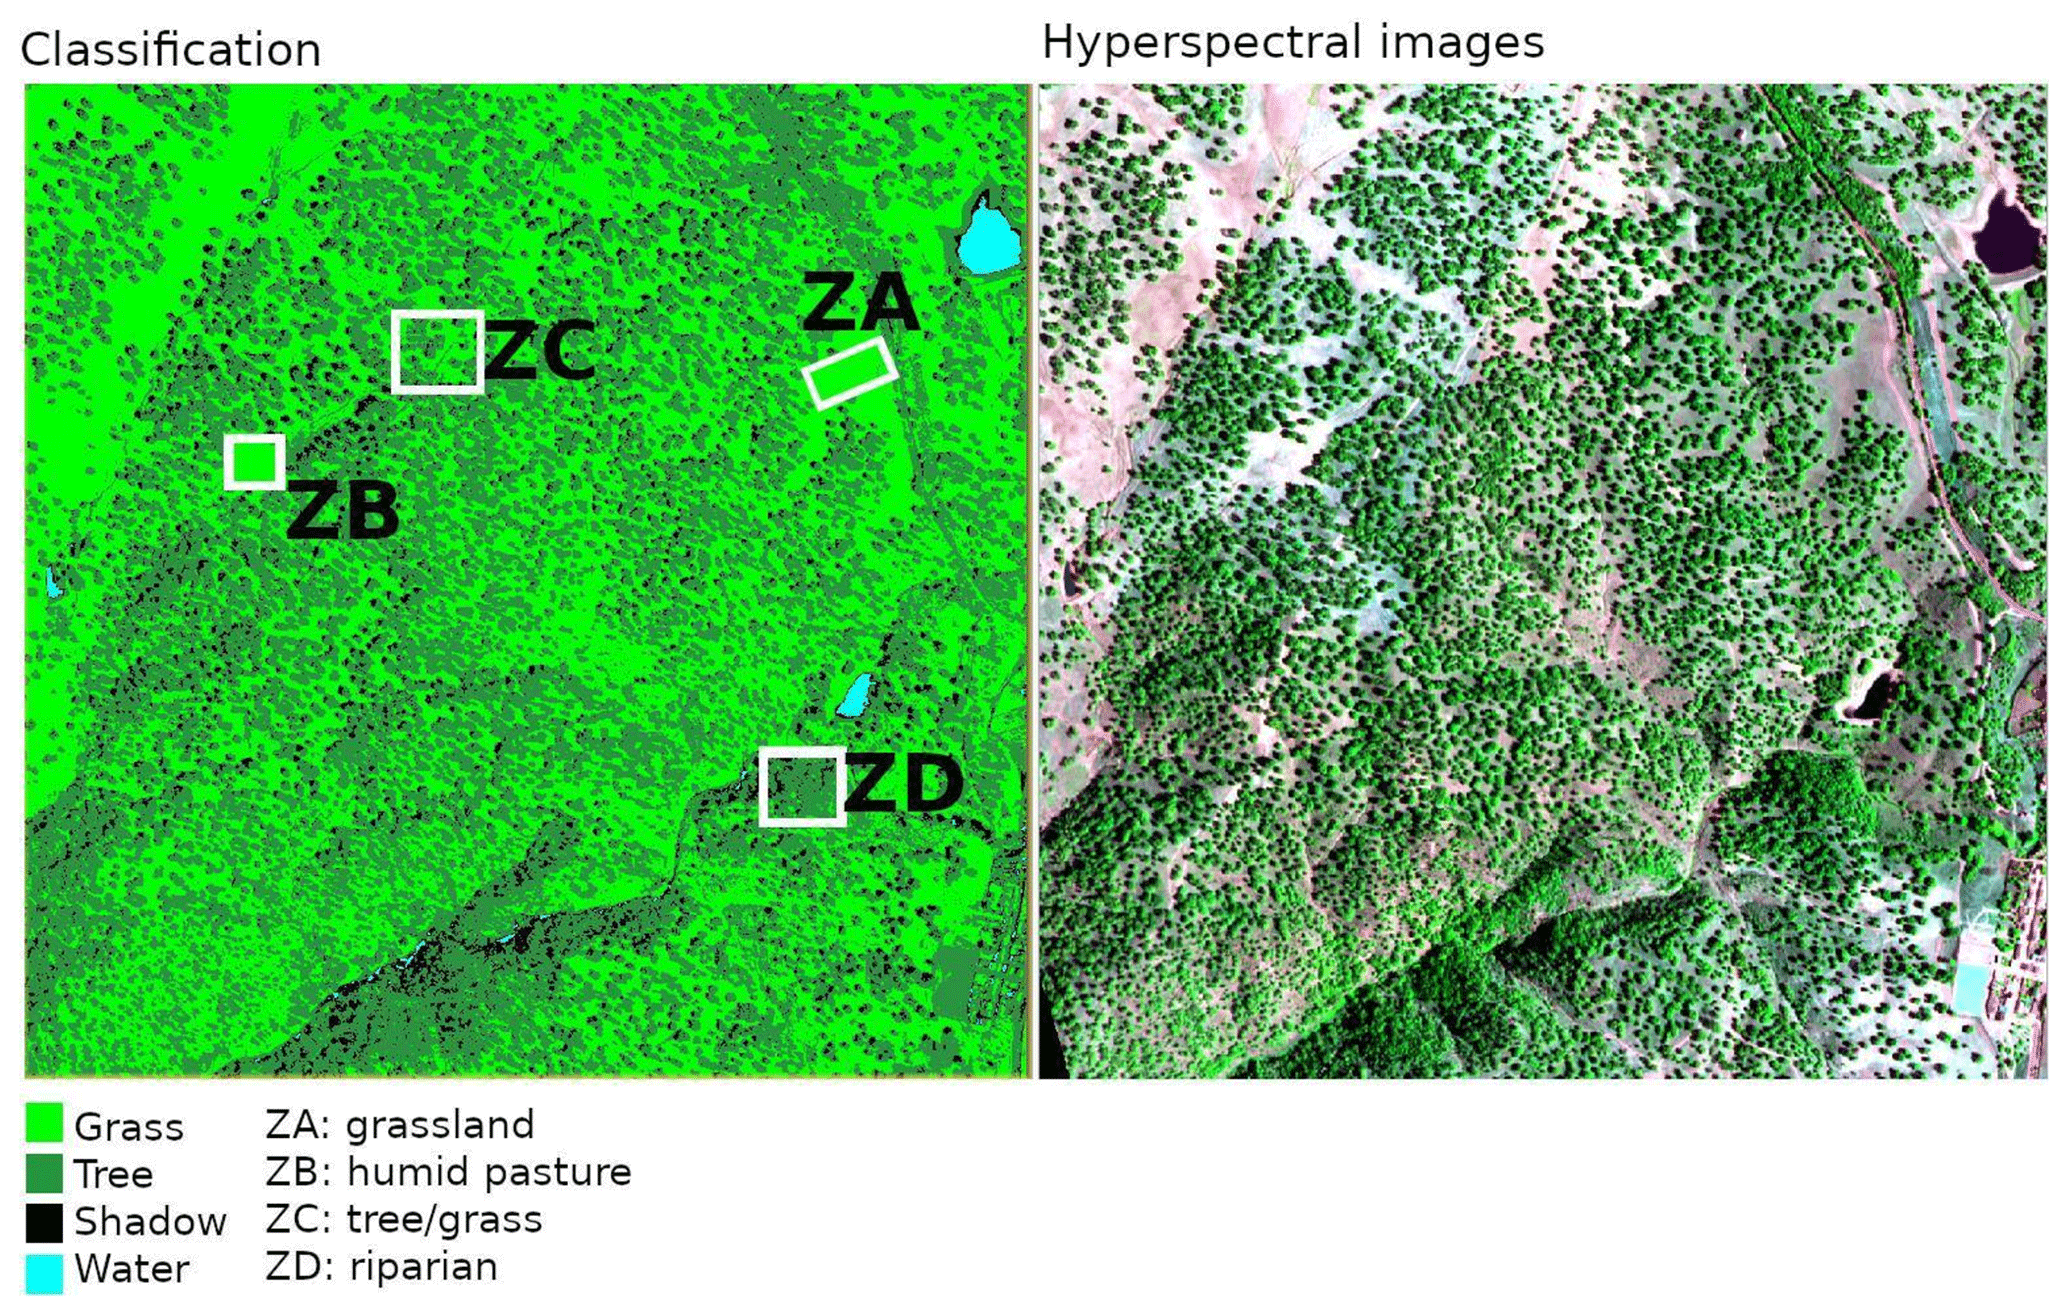
Figure 2Classification map used as input in the VI-ETo model and the different zones (white squares). Hyperspectral image from 27 August 2015 (Hector Nieto and Pablo Zarco-Tejada).
Models and earth observation data
The models, previously validated in the study area (using ECT-1 data for all models and ECT-2 data for Kc-ETo due to footprint) with good results (Carpintero et al., 2020, 2021; González-Dugo et al., 2021) and applied over 2013–2015, are:
-
An adaptation of the Kc-ETo method of FAO56 (Allen et al., 1998) to assimilate remote data, the VI-ETo model (González-Dugo et al., 2008), which estimates ET with a high spatial resolution (30 m) from visible and near-infrared Landsat 8 data. This model requires the calibration of vegetation parameters and information on soil parameters. To refine the characterization of these parameters that define the water balance (e.g., roots depth), we performed a digital classification during the dry season using an airborne hyperspectral image with a high spatial resolution (1 m).
-
A surface energy balance to estimate ET from thermal sensors, the ALEXI-DisALEXI model (Anderson et al., 1997), was used with MODIS and Landsat 7/8 images. Both types of ET maps were combined using the STARFM data fusion technique (Gao et al., 2006) that provides daily ET estimates at 30 m. With this method, we produced maps of daily ET at 1 km and 30 m without the need for local calibration.
-
We used the SEBS model (Surface Energy Balance System, Su et al., 2002), which does not need local calibration, to provide the regional approach integrating remotely sensed thermal data of 5 km spatial resolution and monthly temporal frequency. Due to the coarse resolution, it is impossible to differentiate between the zones, as all are located inside a 5 km × 5 km pixel.
In Fig. 2, we present the classification map used to refine the vegetation and soil parameters that influence the water balance of the VI-ETo. Model inputs such as the root depth or the basal crop coefficient under full vegetation cover greatly influence the overall balance because they determine the control volume. From a previous analysis (Andreu et al., 2022), when general average values were selected (e.g., root depth =2 m, instead of roottree=4 m and rootgrass=1 m), the pattern of the ET estimated with VI-ETo integrating Landsat images (30 m) was similar to the ET pattern estimated with coarser resolutions (DisALEXI MODIS model with 1 km). In this case, we used a detailed classification, in which we assumed shadows as part of the herbaceous layer, obtaining a 51 % of grass and 47 % of tree cover for the study area. Depending on the zone selected, tree fractional cover ranges between 0 (zones A and B) and almost full coverage (zone D).
Figure 3 shows the ET estimates for the zones in which the results of the selected models are available on (a) daily (VI-ETo, ALEXI-DisALEXI, and STARFM) or (b) monthly (including SEBS) temporal resolutions. It can be observed that the spatial scale of meters (VI-ETo and STARFM) better captures heterogeneity, as for the herbaceous senescence date in zone A. Since there are mixed pixels at the scale of SEBS and DisALEXI MODIS, multiple vegetation covers contribute to the estimates resulting in more similar ET rates in all zones. Daily temporal resolutions allowed for strong rain events to be shown as ET peaks.
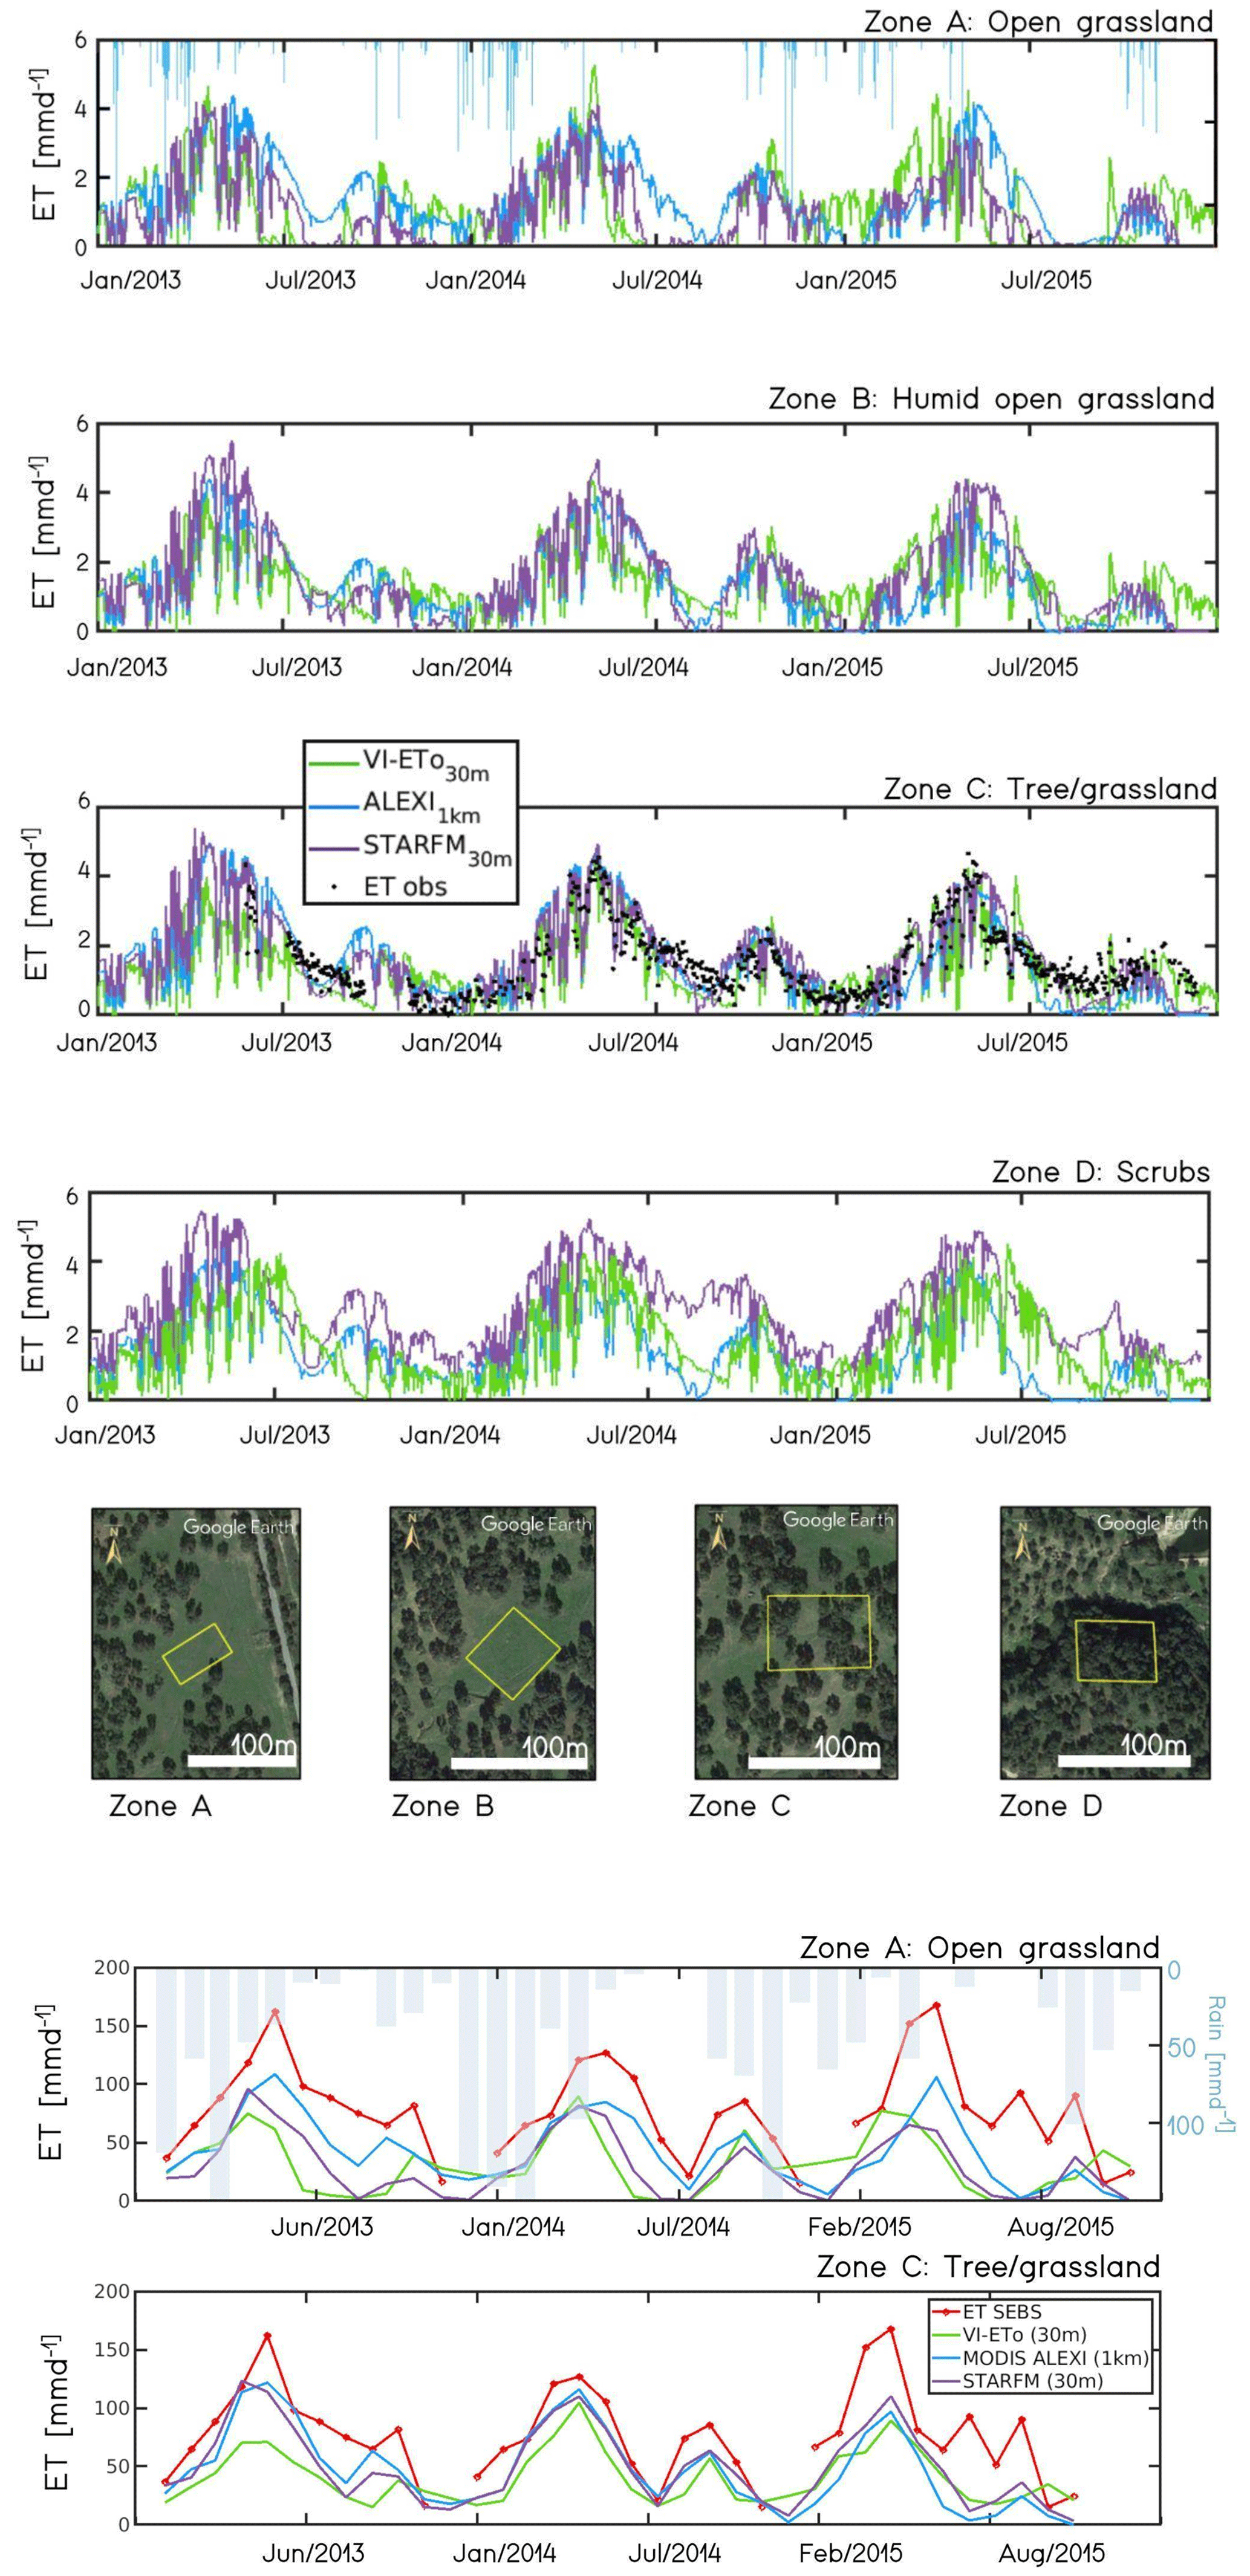
Figure 3Upper panel: daily ET estimated for all zones (A, B, C, and D) using VI-ETo (30 m), DisALEXI (1 km), and STARFM (30 m) models. In zone C, daily ET measured by the ECT-1 is plotted (ET observations are the black dots). Aerial image from © Google Earth. Lower panel: monthly ET estimated for zones A and C, using SEBS (5 km), VI-ETo (30 m), DisALEXI (1 km), and STARFM (30 m) models.
With models needing calibration, the input parameters have to be refined to take advantage of the spatial resolution provided by missions such as Sentinel 2. For example, root depth, permanent wilting point, or soil texture greatly influence the water storage capacity and, thus, the evapotranspiration flux. When different canopies (trees, shrubs, and grasses) were present, the classification needed to be more detailed (Fig. 3a, zone D: Scrubs).
In zone A (Fig. 3a and b), the date of grass senescence was earlier (in late June) when applying the STARFM and VI-ETo models, reaching 0 mm d−1 during summer. MODIS-DisALEXI produced minimum ET rates from August. During the 2013 summer, ET maintained values ∼ 1 mm d−1. MODIS-DisALEXI presented higher values than the other models in the spring production peaks except for SEBS (Fig. 3b). Thus, using coarser resolutions may imply an overestimation of the accumulated ET and the correspondent biomass production in dehesa pasture areas.
In zone B (Fig. 3a), the slope of the spring ET decline is less steep because of the soil moisture conditions, maintaining a residual ET rate during 2013 with all models and during 2014 with VI-ETo. ET time series at metres or kilometres are similar in this zone since wet grasslands maintained their transpiration longer during summer. These areas with higher production capacity are essential for managing grazing rotations.
Zone C represents the most common dehesa structure (an herbaceous layer with dispersed trees). Here the spatial resolutions gave similar results due to the homogeneity of this patch. In this case, the information provided at low resolution is helpful for management at regional or basin scales.
In zone D, ET estimates at m resolution suggest groundwater use by vegetation during the summer, with ET remaining above 1 mm d−1. At 1 km, surrounding grasslands were incorporated, and ET values were reduced. This layer is the most heterogeneous concerning the different models' behavior, as we need to include the scrub's characteristics in the formulation. These scrub species are of nutritional interest for domestic livestock and game and can act as a refuge due to the conditions under the canopy.
As shown in Fig. 3b, the different models' monthly ET averages on zone C present a better agreement, except for the low VI-ETo 2013 spring peak and SEBS's usual overestimation of ET rates.
For regional purposes, when the dehesa is considered a homogeneous landscape, for example, for vulnerable areas zonification or drought early warning systems, all models performed similarly and correlated well (Fig. 4 zone C), showing the same trends. Nevertheless, the differences between them were higher for the management of the patches within the ecosystem (Fig. 4 zone A) .
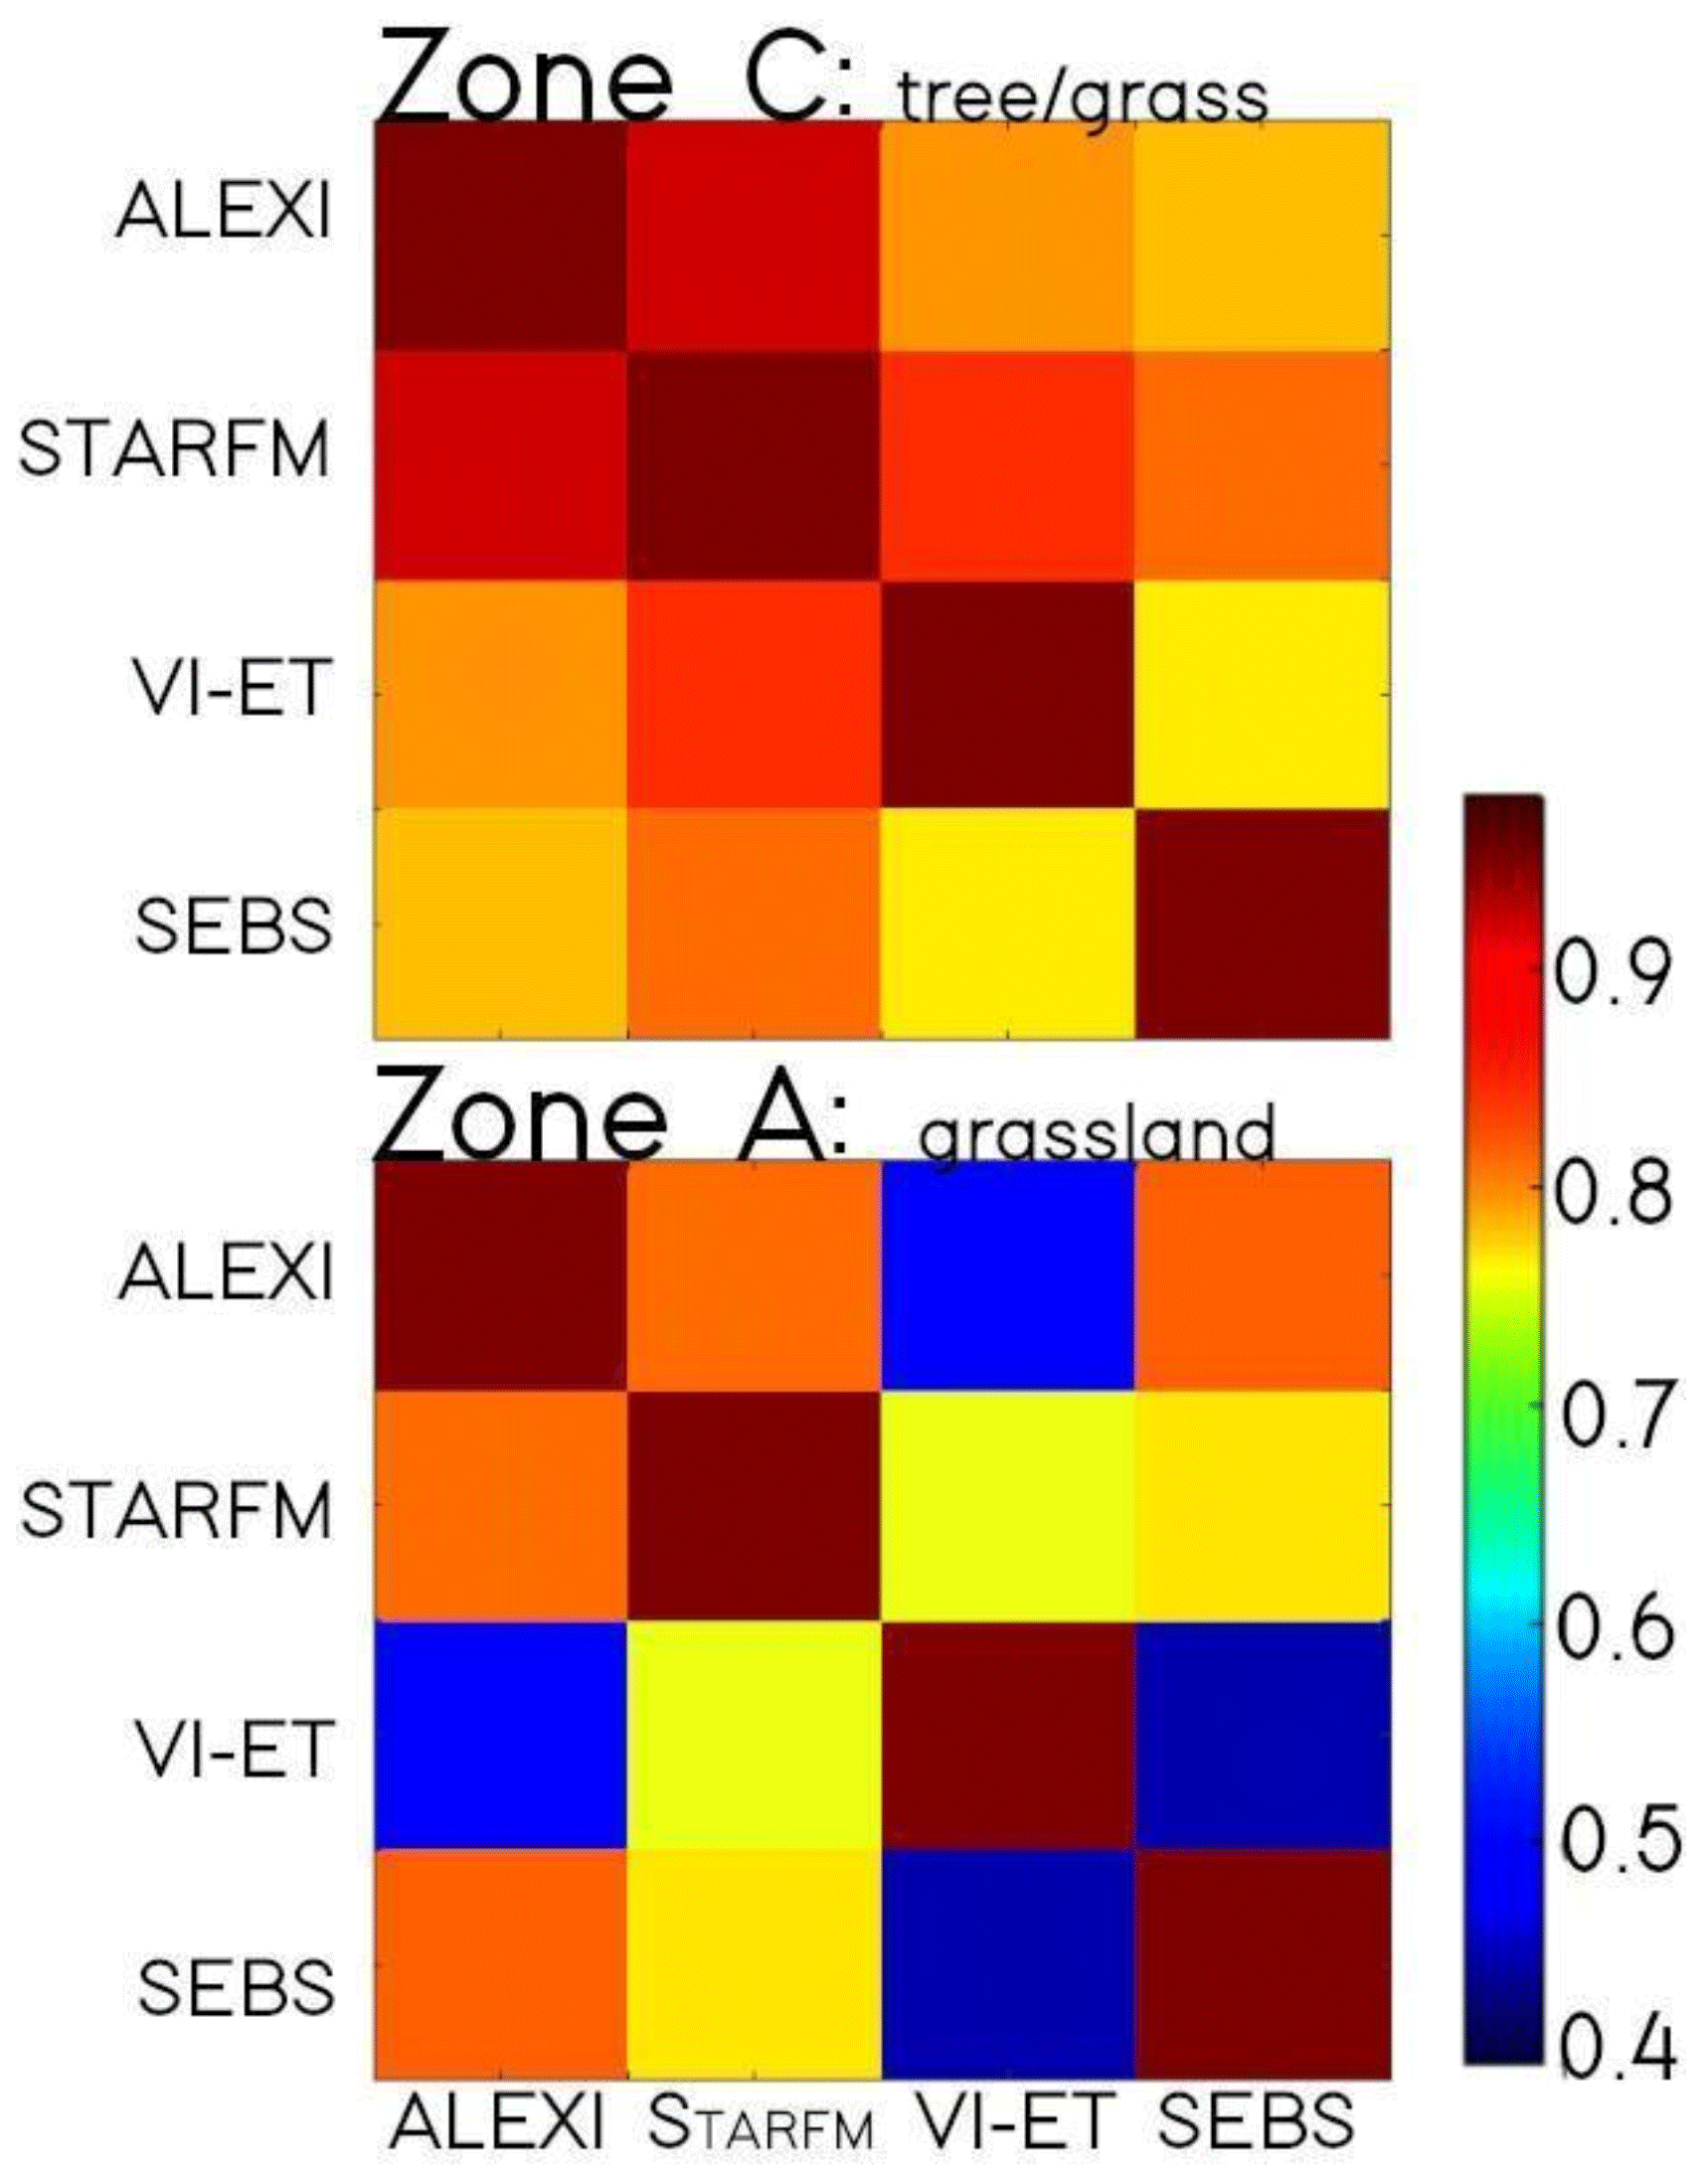
The results showed that, for the dehesa ecosystem, ET estimations at a low resolution might be sufficient for management at the basin level. Information at a higher resolution may help identify areas with different water storage capacities or vegetation growth. For livestock management, this information can support grazing rotations and delimitation of areas containing fragile vegetation or high biodiversity. Considering the methodologies used, combining models with conceptual and operational differences may improve the outcomes.
The SEBS code can be downloaded from the GitHub repository (https://github.com/TSEBS/SEBS_Spain, last access: 5 February 2021; Chen et al., 2019). A description of the regional Atmosphere-Land Exchange Inverse (ALEXI) and the DisALEXI model (Anderson et al., 1997) code is provided in the Algorithm Theoretical Basis Document, and the code may be distributed on request from the authors (ATBD: https://lpdaac.usgs.gov/documents/340/ECO4ESIALEXIU_ATBD_V1.pdf; Anderson et al., 2018). ALEXI and DisALEXI use the Two-Source Energy Balance model, which can be downloaded from the GitHub repository (https://github.com/hectornieto/pyTSEB, Nieto, 2016). Kc-FAO56 VI model may be distributed on request to the author (Carpintero et al., 2020; https://doi.org/10.3390/w12051418). STARFM code can be downloaded from the USDA dataset repository (https://data.nal.usda.gov/dataset/starfm, last access: June 2021; Gao et al., 2006).
Data from the Santa Clotilde site may be distributed on request to the principal investigator of the experimental site (María P. González-Dugo, mariap.gonzalez.d@juntadeandalucia.es).
AA and MPGD conceptualized and designed the paper. All authors collect field data. EC, MPGD, and AA performed the simulations. AA prepared the manuscript with contributions from all co-authors.
The contact author has declared that none of the authors has any competing interests.
Publisher’s note: Copernicus Publications remains neutral with regard to jurisdictional claims in published maps and institutional affiliations.
This article is part of the special issue “IAHS2022 – Hydrological sciences in the Anthropocene: Past and future of open, inclusive, innovative, and society-interfacing approaches”. It is a result of the XIth Scientific Assembly of the International Association of Hydrological Sciences (IAHS 2022), Montpellier, France, 29 May–3 June 2022.
The authors thank Hector Nieto and Pablo Zarco-Tejada for using the high-resolution image from 27 August 2015 over Santa Clotilde.
Ana Andreu has received funding from the Ministry of Science and Innovation and the State Research Agency of Spain through the Severo Ochoa and María de Maeztu Program for Units of Excellence in R&D&I (Ref. CEX2019-000968-M) and the SIERRA 1265875-R project, with the economic collaboration of European Funds for Rural Development and the Office of Economy, Knowledge, Business, and University of the Junta de Andalucía. Additional funding was provided by PID2019-107693RR-C22 (MCIU/AEI/FEDER, EU) project and EO-AFRICA R&D Tactic research project.
This paper was edited by Christophe Cudennec and reviewed by two anonymous referees.
Allen, R. G., Pereira, L. S., Raes, D., and Smith, M.: Crop ET-Guidelines for Computing Crop Water Requirements-FAO, Irrigation and Drainage Paper 56, FAO, Rome, Italy, ISBN 92-5-104219-5, 1998.
Anderson, M. C., Norman, J. M., Diak, G. R., Kustas, W. P., and Mecikalski, J. R.: A two-source time-integrated model for estimating surface fluxes using thermal infrared remote sensing, Remote Sens. Environ., 60, 195–216, https://doi.org/10.1016/S0034-4257(96)00215-5, 1997.
Anderson, M. C., Fisher, J. B., and Hook, S. J.: Level-4 Evaporative Stress Index, Algorithm Theoretical Basis Document, JPL Publication D-94648, 16 pp., https://lpdaac.usgs.gov/documents/340/ECO4ESIALEXIU_ATBD_V1.pdf (last access: 1 June 2021), 2018.
Andreu, A., Kustas, W. P., Polo, M. J., Carrara, A., and González-Dugo, M. P.: Modeling Surface Energy Fluxes over a Dehesa Ecosystem Using TSEB model I, Remote Sens.-Basel, 10, 567, https://doi.org/10.3390/rs10040567, 2018.
Andreu, A., Carpintero, E., and González-Dugo, M. P.: Influencia de la resolución espacial en la gestión de los recursos hídricos en zonas distintivas de la dehesa, in: Proceedings of XIX Congreso de la Asociación Española de Teledetección, edited by: Ruiz, L. A., Estornell, J., González-Audícana, M., and Álvarez-Mozos, J., Pamplona, Spain, 29 June–1 July 2022, eISBN: 978-84-9769-383-7, 2022.
Carpintero, E., Andreu, A., Gómez-Giráldez, P.J., Blázquez, Á., and González-Dugo, M. P.: Remote-Sensing-Based Water Balance for Monitoring of Evapotranspiration and Water Stress of a Mediterranean Oak–Grass Savanna, Water, 12, 1418, https://doi.org/10.3390/w12051418, 2020.
Carpintero, E., Anderson, M. C., Andreu, A., Hain, C., Gao, F., Kustas, W. P., and González-Dugo, M. P.: Estimating Evapotranspiration of Mediterranean Oak Savanna at Multiple Temporal and Spatial Resolutions, Remote Sens.-Basel, 13, 3701, https://doi.org/10.3390/rs13183701, 2021.
Chen, X., Su, Z., Ma, Y., and Middleton, E. M.: Optimization of a remote sensing energy balance method over different canopy applied at global scale, Agr. Forest Meteorol., 279, 107633, https://doi.org/10.1016/j.agrformet.2019.107633, 2019 (code available at: https://github.com/TSEBS/SEBS_Spain, last access: 5 February 2021).
Gao, F., Masek, J., Schwaller, M., and Hall, F.: On the blending of the Landsat and MODIS surface reflectance: Predicting daily Landsat surface reflectance, IEEE T. Geosci. Remote, 44, 2207–2218, https://doi.org/10.1109/TGRS.2006.872081, 2006 (data available at: https://data.nal.usda.gov/dataset/starfm, last access: June 2021).
González-Dugo, M. P. and Mateos, L.: Spectral veg. indices for benchmarking water productivity of irrigated cotton and sugarbeet crops, Agr. Water Manage., 95, 48–58, https://doi.org/10.1016/j.agwat.2007.09.001, 2008.
González-Dugo, M. P., Chen, X., Andreu, A., Carpintero, E., Gómez-Giraldez, P. J., Carrara, A., and Su, Z.: Long-term water stress and drought assessment of Mediterranean oak savanna vegetation using thermal remote sensing, Hydrol. Earth Syst. Sci., 25, 755–768, https://doi.org/10.5194/hess-25-755-2021, 2021.
Johnston, M., Andreu, A., Verfaillie, J., Baldocchi, D., Gonzalez-Dugo, M. P., and Moorcroft, P.: Measuring surface temperatures in a woodland savanna: Opportunities and challenges of thermal imaging in an open-canopy ecosystem, Agr. Forest Meteorol., 310, 108484, https://doi.org/10.1016/j.agrformet.2021.108484, 2021.
Johnston, M. R., Andreu, A., Verfaillie, J., Baldocchi, D., and Moorcroft, P. R.: What lies beneath, Remote Sens. Environ., 274, 112950, https://doi.org/10.1016/j.rse.2022.112950, 2022.
Nieto, H.: hectornieto/pyTSEB, GitHub [code], https://github.com/hectornieto/pyTSEB (last access: July 2011), 2016.
Su, Z.: The Surface Energy Balance System (SEBS) for estimation of turbulent heat fluxes, Hydrol. Earth Syst. Sci., 6, 85–100, https://doi.org/10.5194/hess-6-85-2002, 2002.