the Creative Commons Attribution 4.0 License.
the Creative Commons Attribution 4.0 License.
 | 18 Apr 2024
Evaluating the spatial and temporal variation in baseflow across headwater streams in the Jonkershoek valley, South Africa
Julia Glenday
Dominic Mazvimavi
An understanding of processes and factors accounting for spatiotemporal variations in baseflow is necessary for sustainable water resources management, particularly in semi-arid regions. This study assessed the spatial and temporal variations in baseflow across three mountain streams within the Jonkershoek valley, in the Table Mountain Group (TMG) geological region of South Africa. A two-parameter recursive digital filtering method (RDF) was combined with conductivity mass balance (CMB) using electrical conductivity to separate baseflow from daily streamflows during the 1946–2019 period. The results indicated that annual baseflow contributions varied spatially. Baseflows were estimated to contribute 38 % to 86 % of the annual streamflows across the three sub-catchments. This notable variation could be explained by differences in topography, geology and fracturing, and vegetation cover. All three sub-catchments had higher proportional contributions from baseflow in the dry summer compared to the wet winter, while interannual variations were relatively minor.
- Article
(2008 KB) - Full-text XML
- BibTeX
- EndNote


UPH 5; baseflow; field observation; recursive digital filter; conductivity mass balance; Jonkershoek
An understanding of processes and factors accounting for spatiotemporal variations in baseflow is necessary to develop appropriate water quantity and quality management strategies (Santhi et al., 2008). This is particularly the case in semi-arid regions, where water resources are under severe stress. The southwestern part of the Western Cape Province (WC) of South Africa experiences a Mediterranean climate typified by long dry summers. Consequently, many of the rivers are non- perennial. However, in some areas the deeply fractured Table Mountain Group (TMG) quartzitic sandstone aquifer contributes baseflow to surface water resources. The fractured nature of this geology also favours the formation of interflow within the shallow weathered zone where there is a high density of fractures (Xu et al., 2003; Roets et al., 2008). Baseflow from the TMG maintains streamflow in the mountainous catchments during both the dry and wet seasons (Saayman et al., 2003). These rivers are critical for water supply throughout the Western Cape Province. However, processes and factors accounting for the variability of baseflows in rivers in the TMG geology region are not adequately understood.
Streamflow hydrographs can be separated into quickflow and baseflow. The separation of baseflow can provide insights into streamflow generation mechanisms and by extension chemical transport and water quality effects of processes within the catchment (Cartwright et al., 2014; Bosch et al., 2017).
Previous studies investigating baseflows in the TMG geological region have mainly focused on a regional scale across meso-scale catchments (Le Maitre and Colvin, 2008; Smakhtin, 2001; Jia, 2007). For example, Jia (2007) investigated baseflow characteristics in quaternary catchments with areas ranging from 37 to 3000 km2 within the TMG region. The estimated baseflow index (BFI) ranged from 4 % to 30 %.
The present study has taken a step further by investigating baseflow characteristics at a headwater sub-catchment scale (< 10 km2), exploring variability across the Jonkershoek Valley. The study aims to characterise baseflow across three neighbouring headwater streams to determine spatial and temporal variations that may exist at this scale in the TMG region. The main objectives are, to quantify baseflow and estimate the baseflow index (BFI), to assess if the conductivity mass balance (CMB) method using electrical conductivity (EC) can improve baseflow estimation in the TMG catchments, and to investigate the spatial and temporal variations in baseflow characteristics across the sub-catchments.
The study was carried out in three neighbouring sub- catchments of the Jonkershoek Valley with perennial streams that are tributaries of the main Jonkershoek River (Fig. 1). The Jonkershoek catchment has a total area of ∼ 146 km2. It is located near the town of Stellenbosch (33°57′ S, 18°15′ E), in the Western Cape Province. A summary of the sub-catchment characteristics is given in Table 1.
The variation in morphology, land cover, rainfall, and streamflow, coupled with the long-term hydrometric records, made ideal study sites (Slingsby et al., 2021). The Bosboukloof sub-catchment consists mostly of afforested slopes, with Pinus radiata covering nearly 58 % of the area since 1940. Tierkloof had pine plantations covering up to 36 % from 1956 to 2014, but has been dominated by native fynbos shrubland since fires in 2015. Langrivier has been kept as a fynbos-dominated control site (Scott et al., 2000). The planting of pines was found to reduce the streamflow yield in the afforested sub-catchments (Scott et al., 2000). In all three sub-catchments, the upper portion is occupied by precipitous cliffs of highly fractured, TMG quartzitic sandstone of the Peninsula formation. These have little or no vegetation or soil (Hewlett and Bosch, 1984). This TMG unit overlies the basement bedrock of Malmesbury Shale with major granite intrusions (Cape Granite). Much of this basement is covered by talus and scree on the lower slopes and valley floor. The TMG outcrop covers about 40 % of the Langrivier catchment compared to 26 % in Tierkloof and 12 % in Bosboukloof (Table 1). According to the conceptual models (Roets et al., 2008; Saayman et al., 2003), the mountainous catchments across the TMG are dominated by sub-surface flow pathways. The streamflow appears to be mainly sourced from springs and seeps near the base of the TMG outcrop. Interflow was found to be a significant streamflow contributor across the sub-catchments, occurring as preferential flow through fractured rock, the scree-talus, and at the rock-soil (Mokua et al., 2020).
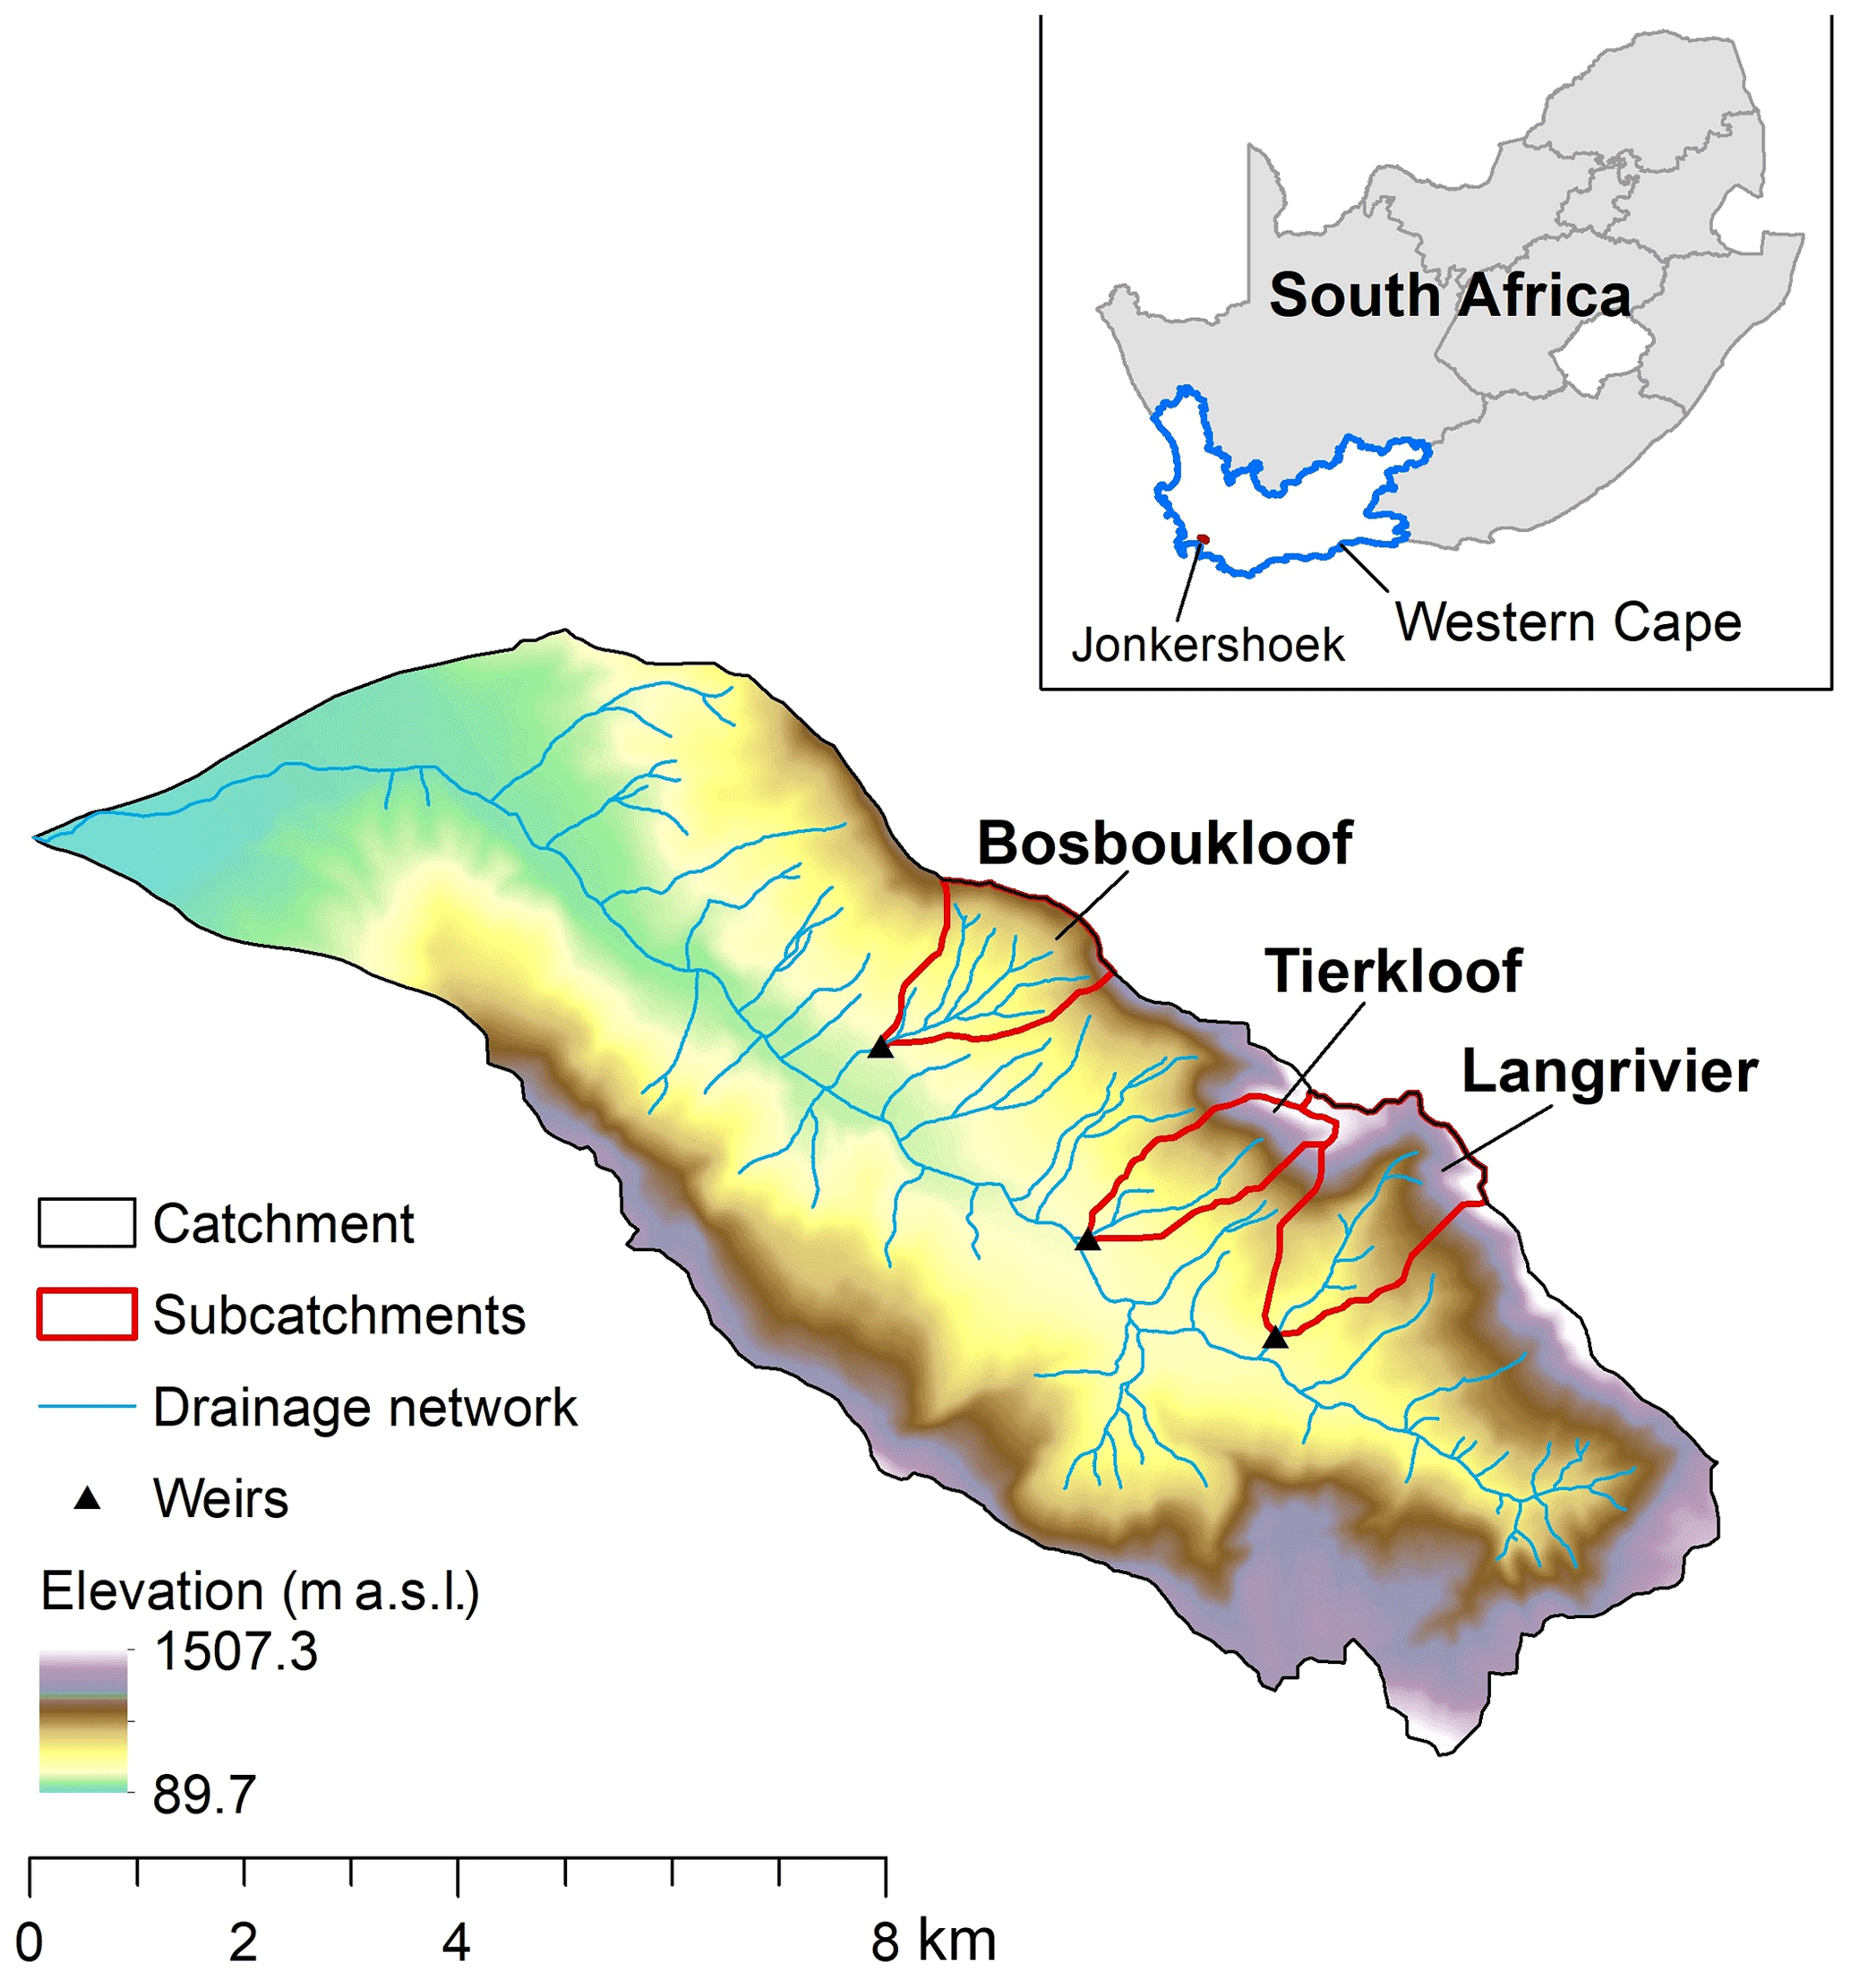
Figure 1Jonkershoek Valley catchment including the location of the study sites and stream guaging stations.
Table 1Summary of the study sites including mean Annual precipitation (MAP) and Mean Annual Runoff (MAR) for the hydrological years 1946–2019 (SAEON, 2019).
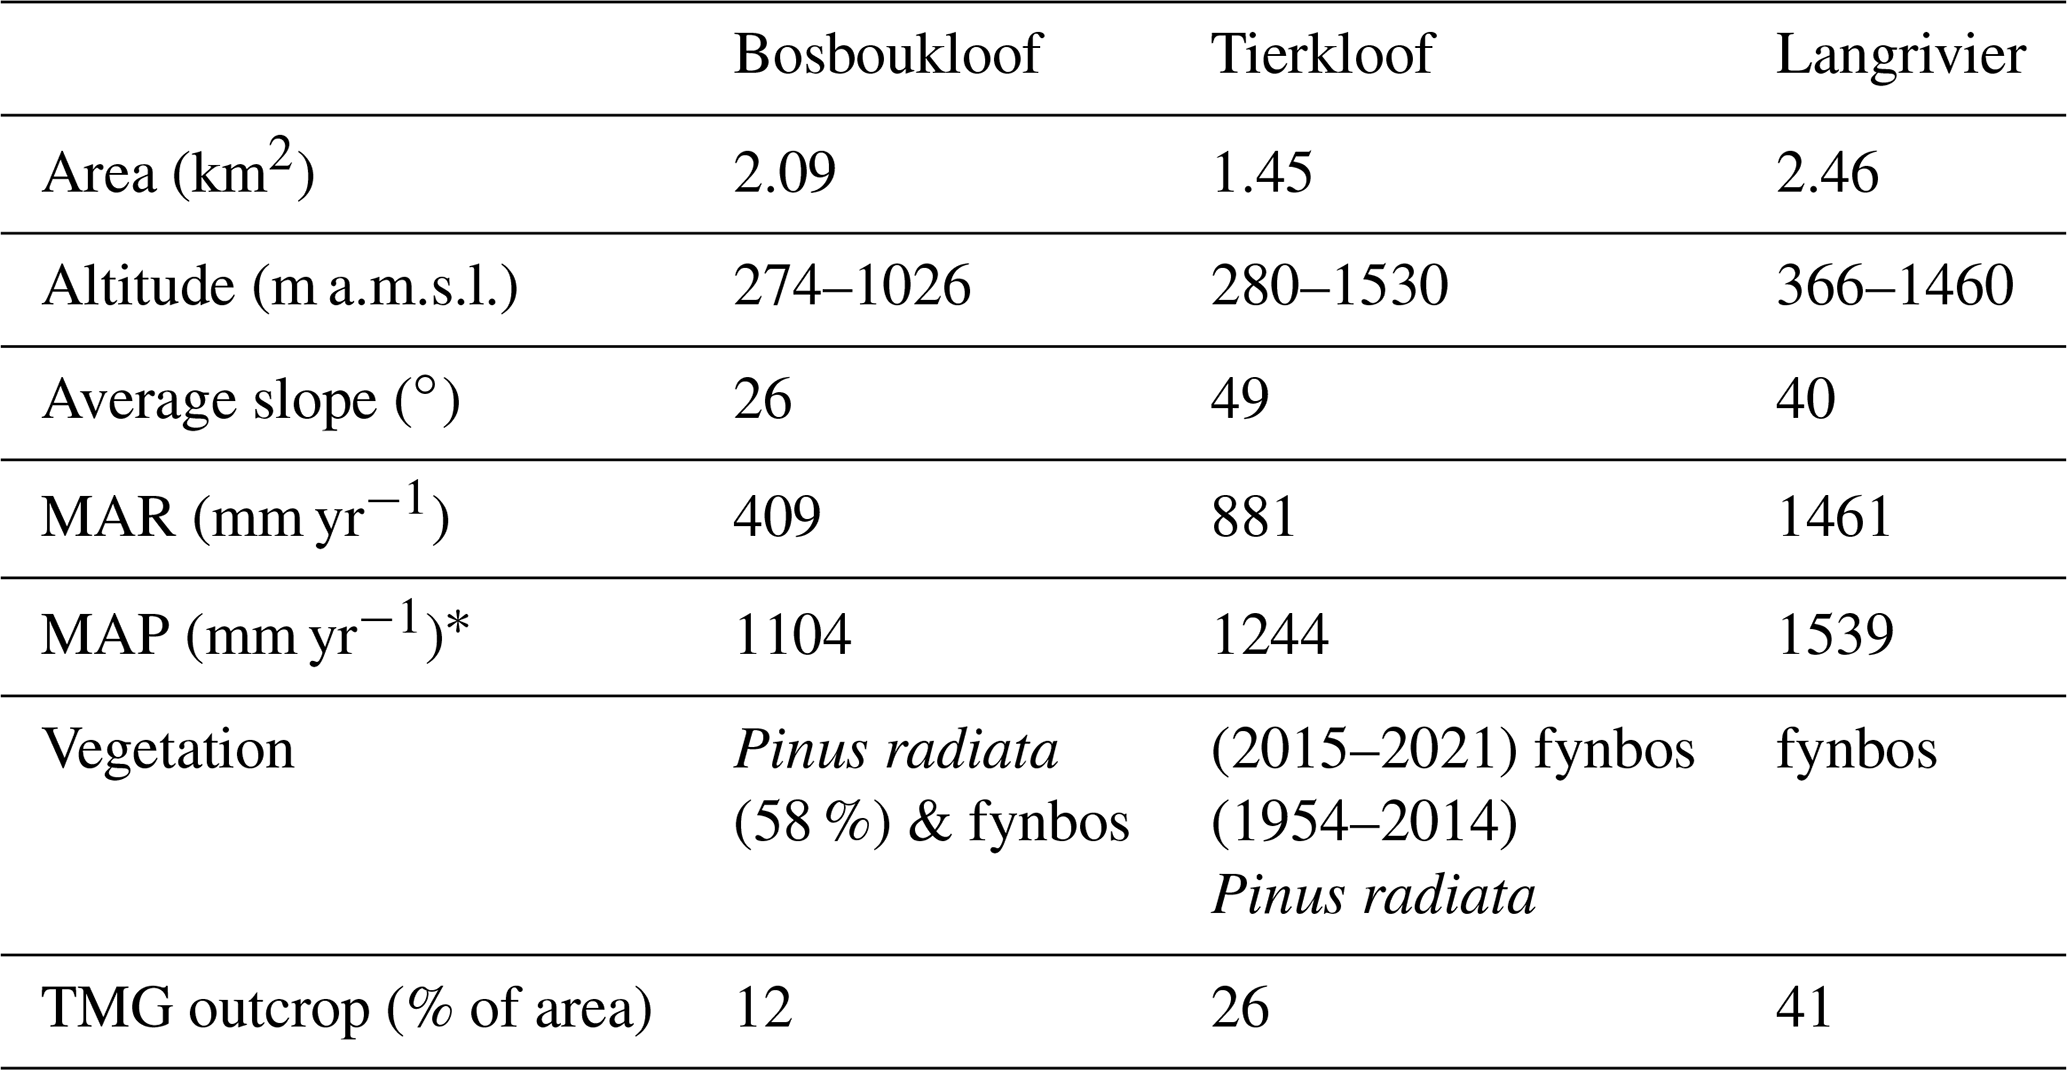
* Note catchment average rainfall estimated by Thiessen polygon method
3.1 Data acquisition and measurement campaign
Streamflow and rainfall data from 1946 to 2019 were obtained from the South African Observation Network (SAEON). The instrumentation and datasets are described in Slingsby et al. (2021). Each sub-catchment has a V-notch gauging weir with continuous logging. The specific conductance (electrical conductivity referenced to 25 °C, µS cm−1) of streamflow at each weir was measured monthly from 2018 to early 2020 using a multi-parameter probe (YSI professional Plus, YSI Inc) resulting in 27 readings per stream. EC of rainfall was measured from cumulative rainfall samples in each sub-catchment.
3.2 Baseflow separation
3.2.1 Recursive Digital Filtering (RDF)
In this study, a two-parameter RDF (Eckhardt, 2005) was used for continuous hydrograph separation. The filter equation was applied as follows.
where QBj (m3 s−1) is the baseflow on day j, QTj is the total discharge (m3 s−1) on day j, BFImax and a are the filter parameters. The BFImax is the maximum value of the baseflow index (i.e the ratio of baseflow to streamflow) and the a is the recession constant.
Appropriate filter parameters values vary depending on the hydrological and hydrogeological characteristics of the catchment (Kouanda et al., 2018). As such, the BFImax and a were determined for each sub-catchment separately. Initial BFImax was determined using the backwards filtering method using the daily streamflow data (Collischonn and Fan, 2013) implemented in U.S.G.S Groundwater Toolbox (Barlow et al., 2017). The a was estimated using three methods namely, the correlation method (Tallaksen, 1995), mean value (Saraiva Okello et al., 2018) and master recession curve (Eckhardt, 2005). The average a value of the three methods was applied. The RDF separation was applied to the daily streamflow time series for the period 1946 to 2019 using U.S. Geological Survey Groundwater Toolbox 1.3.1 (Barlow et al., 2017).
3.2.2 Conductivity Mass Balance (CMB) and RDF calibration
Considering the high sensitivity of the filtering parameters, Eckhardt (2005) proposed that the RDF methods should be validated using tracer-based hydrograph separations. The integration of recursive digital filter (RDF) with the conductivity mass balance method (CMB) has been shown to improve baseflow estimation in many headwater catchments (Kouanda et al., 2018; Saraiva Okello et al., 2018; Lott and Stewart, 2016). The RDF method only requires streamflow data, while the CMB method relies on hydrochemical measurements. The CMB method was used to calibrate the BFImax parameter. The CMB method was applied using the following equation (Lott and Stewart, 2016):
where QT is the measured streamflow discharge (m3 s−1) on day j, CTj is the measured specific conductance of the streamflow at a given timestep given in micro Siemens per centimeter (µS cm−1), CB and CS are the estimated specific conductance (µS cm−1) of baseflow and quickflow components, respectively. The CB values were assumed to be the maximum EC value measured for each stream, which occurred during the dry season. Due to the relatively low EC values during the high flow season, especially in Langrivier (Mokua et al., 2020), the quickflow component was represented by the EC value of the winter rainfall (20 µS cm−1) for all sub-catchments, assuming that quickflow had EC approximately equal to that of rainfall. This assumes little to no EC change on the quickflow pathway(s), i.e., that it is direct flow.
The RDF predictions were compared to the CMB baseflow values for the sample days. Three goodness of fit methods, percent bias (PBIAS), Root-Mean-Square Error (RMSE) and coefficient of determination were used the evaluate the performance of the RDF. BFImax parameter values were adjusted to improve performance.
4.1 RDF vs. CMB baseflow estimates for sampled days
The uncalibrated RDF tended to estimate greater BFI values than the CMB. This was most notable for Langrivier (Table 2). The calibrated BFImax values improved the RDF output in that most of the estimated BFIs showed better agreement with the CMB method results (Table 2). However, while the correlations between the CMB and RDF outputs were improved by adjusting the BFImax parameter, the R2 values remained low. The PBIAS results show that the calibrated RDF generally estimated more baseflow than the CMB on sampled days for Bosboukloof and Tierkloof, while for Langrivier there was a shift from overestimation to slight underestimation. Given these different biases, the magnitudes of the BFI differences between the three catchments, as predicted by the RDF, are rough estimates. Nevertheless, the differences between the catchments' mean annual BFIs were large in relation to these biases, as described below.
Table 2Summary of the goodness of fit indicators results between the uncalibrated or calibrated recursive digital filter and CMB method daily BFI values, BFI (n=27). Analysis period (2018–2019, 2020).
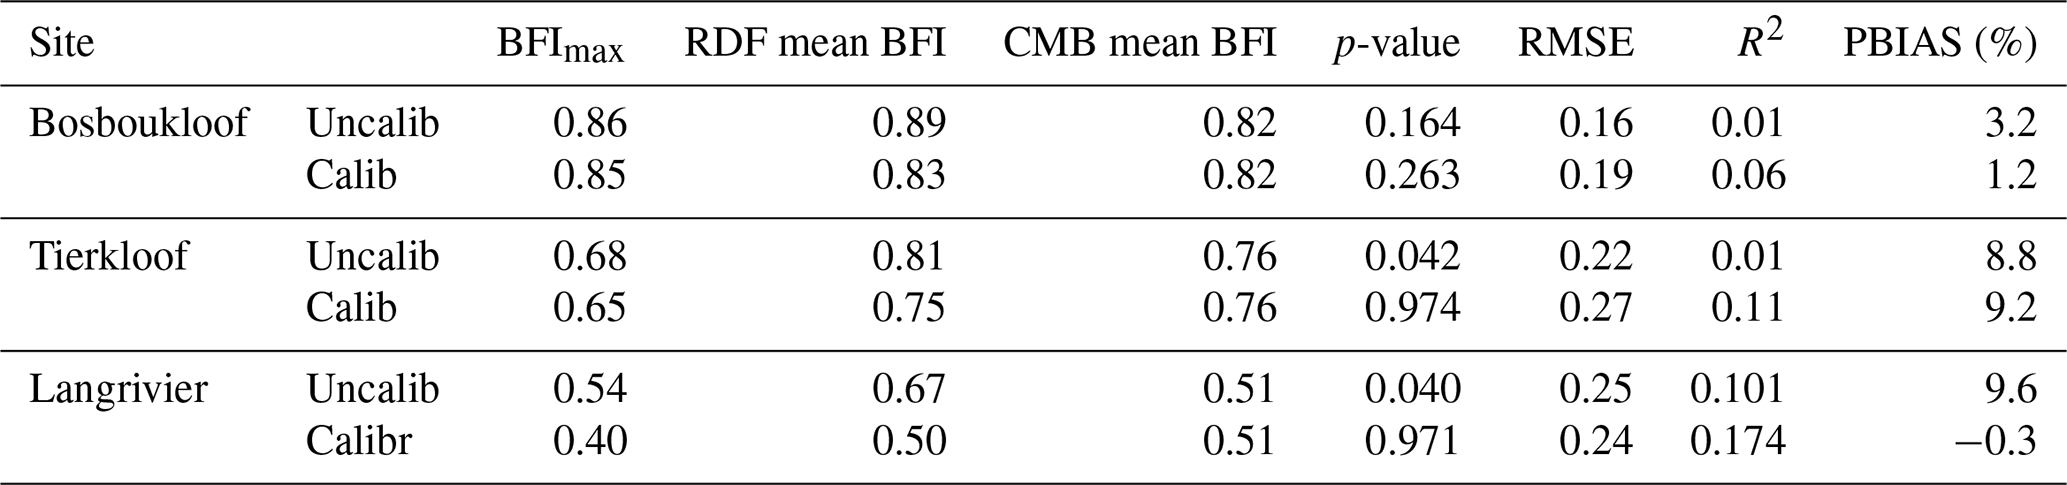
Note: Uncalib = Uncalibrated, Calib = Calibrated
4.2 RDF parameter values
The filter parameters exhibited differences among the sub- catchments, particularly the calibrated BFImax. The recession constant (a) showed minor spatial variation ranging from 0.967 to 0.974. These values were consistent with those of Jia (2007) for meso-scale catchments across the TMG outcrop areas: 0.945 to 0.985. The adjusted long-term BFImax value was higher for Bosboukloof, at 0.86 compared to Tierkloof at 0.68, and Langrivier at 0.54. The different values imply the influence of catchment characteristics such as drainage patterns, vegetation, topography and hydrogeological characteristics (e.g., bedrock fractures and, degree of weathering) (Price, 2011; Kouanda et al., 2018).
4.3 Spatial and temporal variation of baseflow
4.3.1 Annual scale
Annual BFI values were calculated for the period 1946–2019. The mean annual BFI and baseflow volume estimated for the study sites are shown in Fig. 2. The BFI estimates and magnitudes of baseflow showed marked spatial variation. The mean annual BFI was highest in Bosboukloof at 0.86 (range: 0.75–0.89), lower in Tierkloof at 0.63 (range: 0.55–0.64), and lowest in Langrivier at 0.38 (range: 0.25–0.41). Langrivier had the highest inter-annual BFI variability. The BFI values are in agreement with those of previous studies in the small catchments of the southwestern Cape region of South Africa (Brendenkamp et al., 1995). However, they were higher than those of the quaternary catchments (average scale: 400 km2) of the TMG outcrop area (Jia, 2007) which ranged from 0.30 to 0.48 and the value of 0.30 estimated for the fractured metasedimentary rock in general (LeMaitre and Colvin, 2008). The variability across the three sub-catchments could be explained by factors such as topography, spatial irregularities in geological structures (e.g. fractures) and vegetation cover (Bloomfield et al., 2009; Price, 2011). The sub-catchments with more scree-talus material cover and pine forest, Bosboukloof and Tierkloof, had higher baseflow proportions, than Langrivier, which has a larger area of steep rocky cliffs. The scree-talus is likely to have high infiltration rates and act as a shallow aquifer providing an additional source of baseflow (Harris and Diamond, 2013). The low BFI in Langrivier could potentially be explained by the steep topography suggesting that rainfall is likely to be transmitted faster to the stream via both surface flow and preferential pathways through the fractured rock (Hewlett and Bosch, 1984), increasing proportion of quickflow.

Figure 2Temporal variations in annual BFI estimates and baseflow (Qb) for the period 1946–2019 at (a) Bosboukloof, (b) Tierkloof and (c) Langrivier.
Figure 2 showed that Bosboukloof generates the lowest mean annual baseflow of 342 mm yr−1 compared to 511 mm yr−1 for Tierkloof and 578 mm yr−1 for Langrivier. This was expected considering the low mean annual runoff (MAR) of Bosboukloof (Table 1). The higher baseflow volumes in Tierkloof and Langrivier could be attributed to their larger TMG outcrops and the higher rainfall amount in the upper steep areas of these catchments. For small catchments (<200 km2) in the United States, Santhi et al. (2008) found that landscape characteristics such as relief and gradient are highly correlated with BFI (R2=0.79) and baseflow volume (R2=0.93), respectively. High baseflow was also found to be correlated with the amount of rainfall. Considering landcover, a positive relationship between BFI and pine forest area was reported by Pramono et al. (2017) in the Kedungbulus sub-watershed (Indonesia), who found that a catchment with 75 % pine forest cover had a higher BFI (0.75) than a comparable catchment with 43 % pine cover (BFI of 0.55). By promoting interception and infiltration, treed cover may reduce the proportion of rainfall that becomes quickflow during storm events.
However, when considering baseseflow volume, Price (2011) found a positive correlation between higher forest cover and lower baseflow amounts, which was attributed to high evapotranspiration and infiltration rates of the forest. This could be the case in the Jonkershoek where the afforested Bosboukloof and Tierkloof had low baseflow volumes compared to the non-afforested Langrivier. The infiltrating water is likely to recharge the high draining scree-cover and shallow weathered bedrock, and the pines tap into this groundwater, reducing baseflow. Annual BFI values showed only minor temporal variations, with Bosboukloof and Tierkloof showing the least variability (Fig. 2). Baseflow is consistently a major component of streamflow in these sub-catchments. Langrivier on the other hand had a higher proportion of quickflow. These results could be viewed as a contradiction to previous research, as peak flows during storm events in this catchment have been shown to be dominated by “old water” (e.g. Midgley and Scott, 1994; Mokua et al., 2020). These findings indicate that the quickflow may include rapid sub-surface flows from the shallow weathered zones that push older stored water into the stream. Therefore, the assumption that rain chemistry represents quick flow may not be a good fit for this site, hence the poor correlation between CMB and RDF (Table 2).
4.3.2 Monthly and seasonal scale
BFI values for monthly and seasonal scales were also calculated. The mean monthly BFIs and baseflow discharge for the three sub-catchments are presented in Fig. 3. Similar to the annual BFI estimates, these values exhibit large spatial variation and seasonality. All three sub-catchments had higher proportional contributions from baseflow in the dry summer (October–March) compared to wet winter (April–September), as expected given seasonality of rainfall. Baseflow peaks were detected during the wet winter months of July and August but over 50 % of the dry season flow was attributed to baseflow (BFI > 0.5). For the Bosboukloof, baseflows contribute 89 % of summer flows and 82 % in winter, Tierkloof 73 % and 60 %, while these were 50 % and 34 % for Langrivier. According to Kelly et al. (2019), the high BFI indicates permeable catchment conditions, whereby the catchment water is stored during the wet season and is discharged to the streams during the dry season. Also, the drier antecedent conditions could have resulted in lower quickflow generation during episodic summer events, which would increase BFI. In Bosboukloof and Tierkloof the pines have been found to have impacted the dry season flow to a greater extent compared to the annual and wet season runoff, potentially due to high evapotranspiration rates (Scott et al., 2000).

Figure 3Mean monthly BFIs and baseflow (Qb) for the 1946–2019 period at the studied sub-catchments at (a) Bosboukloof, (b) Tierkloof and (c) Langrivier.
The larger baseflow volume during the wet season months (July–September) indicates wetter antecedent conditions in the scree-soil cover below the TMG and likely lower evapotranspiration (ET) from both pines and fynbos. As a result, more quick flow was generated by the steep upper catchment areas during the wet season, hence lower BFI. This is consistent with other research that suggest catchment wetness and/or water storage capacity is an important control on baseflow (Yao et al., 2021).
The high BFI observed during the dry season across the sub-catchments indicates the importance of baseflow in maintaining dry season flows.
This study applied the RDF method, calibrated based on CMB separation, to separate baseflow for three headwater streams in the Jonkershoek catchment for the period 1946–2019. Calibration of the BFImax filter parameter did improve the fit of the RDF baseflow predictions to the CMB outputs for the sampled days. However, while the two methods produced similar average baseflow estimates, the correlation remained low. The dominant contribution of “old water” even in storm responses that has been observed in these streams (Midgley and Scott, 1994) may mean that the rainfall EC values used in the CMB do not adequately represent what is considered the “quickflow” response.
RDF outputs indicated spatial variations in annual and monthly BFIs across the sub-catchments. This is likely to be a function of several factors such as the heterogeneity in bedrock geology, topography and vegetation cover across the sub-catchments. The results suggest that more than half the annual and summer streamflow in Bosboukloof and Tierkloof is derived from baseflow. Although, Langrivier's flow was dominated by quickflow, baseflow accounted for half of the summer flow on average. This highlights the importance of baseflow in sustaining the streamflow during the dry season in the Jonkershoek catchment. The seasonal variability shown in the monthly BFI and baseflow amounts can be attributed to low rainfall and high ET rates during summer. The results demonstrate that a high degree of variability can exist in the contribution of baseflow between neighbouring headwater streams, likely linked to catchment geomorphic characteristics and land cover. This study provides a useful reference for understanding baseflow characteristics in headwater catchments of the TMG and can contribute to informed water resources management.
The raw data is publicly accessible from the South African Environmental Observation Network (SAEON), https://catalogue.saeon.ac.za/ (de Buys, 2019a, b, c, d, e, f, g, h) and https://catalogue.saeon.ac.za/records (SAEON, 2019).
RAM conducted the research, and investigation process, prepared manuscript, carried out the fieldwork, hydrochemical analysis and interpretation of data. JG was involved in the fieldwork, conceptualization and reviewing of the manuscript. Prof DM assisted with the reviewing of the manuscript and formatting.
The contact author has declared that none of the authors has any competing interests.
Publisher’s note: Copernicus Publications remains neutral with regard to jurisdictional claims in published maps and institutional affiliations.
This article is part of the special issue “IAHS2022 – Hydrological sciences in the Anthropocene: Variability and change across space, time, extremes, and interfaces”. It is a result of the XIth Scientific Assembly of the International Association of Hydrological Sciences (IAHS 2022), Montpellier, France, 29 May–3 June 2022.
We acknowledge the National Research Foundation for the financial support and South African Environmental Observation Network, Fynbos Node (SAEON) for making this study possible. We kindly thank Abri de Buys for assisting with field data collection and processing.
This research has been supported by the National Research Foundation Professional Development Programme (PDP) PhD grant (no. MND19053044376) under the South African Environmental Observation Network,Fnyos Node (SAEON).
This paper was edited by Christophe Cudennec and reviewed by Jean-Marie Kileshye-Onema and one anonymous referee.
Barlow, P. M., Cunningham, W. L., Zhai, T., and Gray, M.: U.S. Geological Survey Groundwater Toolbox version 1.3.1, a graphical and mapping interface for analysis of hydrologic data: U.S. Geological Survey Software Release [software], https://doi.org/10.5066/F7R78C9G, 2017.
Bloomfield, J. P., Allen, D. J., and Griffiths, K. J.: Examining Geological Controls on Baseflow Index (BFI) Using Regression Analysis: An Illustration from the Thames Basin, UK, J. Hydrol., 373, 164–176, https://doi.org/10.1016/j.jhydrol.2009.04.025, 2009.
Bosch, D. D., Jeff, G. A., Allen, P. G., Lim, K., and Youn Shik, Y.: Regional Studies Temporal variations in baseflow for the Little River experimental watershed in South Georgia, J. Hydrol., 10, 110–121, 2017.
Brendenkamp, D. B., Botha, L. J., Van Tonder, G. J., and Van Rensburg, H. J.: Manual on quantitative estimation of groundwater recharge and aquifer storativity: Based on Practical Hydro-logical methods, Water Research Commission, TT 73/95, 1995.
Cartwright, I., Gilfedder, B., and Hofmann, H.: Contrasts between estimates of baseflow help discern multiple sources of water contributing to rivers, Hydrol. Earth Syst. Sci., 18, 15–30, https://doi.org/10.5194/hess-18-15-2014, 2014.
Collischonn, W. and Fan, F. M.: Defining Parameters for Eckhardt's Digital Baseflow Filter, Hydrol. Process., 27, 2614–2622, https://doi.org/10.1002/hyp.9391, 2013.
de Buys, A.: Langrivier rain gauge 8B (366 m), event rainfall, 06/2011–09/2019, SAEON (South Africa Environmental Observation Network) Observations Database [data set], https://doi.org/10.15493/SAEON.FYNBOS.10000002, 2019a.
de Buys, A.: Langrivier rain gauge 14B (472 m), event rainfall, 06/2011–06/2019, SAEON (South Africa https://doi.org/10.15493/SAEON.FYNBOS.10000003, 2019b.
de Buys, A.: Bosboukloof rain gauge 11B (400 m), event rainfall, 06/2011–09/2019, SAEON (South Africa Environmental Observation Network) Observations Database [data set], https://doi.org/10.15493/SAEON.FYNBOS.10000004, 2019c.
de Buys, A.: Langrivier 700 m fog station, event rainfall, 05/2014–07/2019, SAEON (South Africa Environmental Observation Network) Observations Database [data set], https://doi.org/10.15493/SAEON.FYNBOS.10000005, 2019d.
de Buys, A.: Langrivier gauging weir hourly stage and estimated flow, 08/2011–09/2019, SAEON (South Africa Environmental Observation Network) Observations Database [data set], https://doi.org/10.15493/SAEON.FYNBOS.10000006, 2019e.
de Buys, A.: Bosboukloof gauging weir hourly stage and estimated flow, 08/2011–09/2019, SAEON (South Africa Environmental Observation Network) Observations Database [data set], https://doi.org/10.15493/SAEON.FYNBOS.10000007, 2019f.
de Buys, A.: Dwarsberg weather station (1214 m), event rainfall, 03/2013–09/2019, SAEON (South Africa Environmental Observation Network) Observations Database [data set], https://doi.org/10.15493/SAEON.FYNBOS.10000008, 2019g.
de Buys, A.: Dwarsberg manual gauge, monthly rainfall, 1945–1991, SAEON (South Africa Environmental Observation Network) Observations Database [data set], https://doi.org/10.15493/SAEON.FYNBOS.10000009, 2019h.
Eckhardt, K.: How to Construct Recursive Digital Filters for Baseflow Separation, Hydrol. Process., 19, 507–515, https://doi.org/10.1002/hyp.5675, 2005.
Harris, C. and Diamond, R. E.: The Use of Isotope Hydrology to Characterize and Assess Water Resources in Southern Africa, in: The use of isotope hydrology to characterize and assess water resources in South(ern) Africa, edited by: Abiye, T., Water Research Commission Report No. TT570/13, 38–52, 2013.
Hewlett, J. D. and Bosch, J. M.: The Dependence of Storm Flows on Rainfall Intensity and Vegetal Cover in South Africa, J. Hydrol., 75, 365–381, 1984.
Jia, H.: Groundwater Resource Evaluation in Table Mountain Group Aquifer Systems, Ph.D. thesis, Department of Earth Science, University of the Western Cape, Bellville, 205 pp., 2007.
Kelly, L., Kalin, R. M., Bertram, D., Kanjaye, M., Nkhata, M., and Sibande, H.: Quantification of Temporal Variations in Base Flow Index Using Sporadic River Data: Application to the Bua Catchment, Malawi, Water, 11, 2–17, 2019.
Kouanda, B., Coulibaly, P., Niang, D., Fowe, T., Karambiri, H., and Paturel, J. E.: Analysis of the Performance of Base Flow Separation Methods Using Chemistry and Statistics in Sudano-Sahelian Watershed, Burkina Faso, Hydrology: Current Research, 9, 300, https://doi.org/10.4172/2157-7587.1000300, 2018.
Le Maitre, D. C. and Colvin, C. A.: Assessment of the Contribution of Groundwater Discharges to Rivers Using Monthly Flow Statistics and Flow Seasonality, Water SA., 34, 549–564, https://doi.org/10.4314/wsa.v34i5.180652, 2008.
Lott, D. A. and Stewart, M. T.: Base Flow Separation: A Comparison of Analytical and Mass Balance Methods, J. Hydrol., 535, 525–33, https://doi.org/10.1016/j.jhydrol.2016.01.063, 2016.
Midgley, J. J. and Scott, D. F.: The Use of Stable Isotopes of Water (D and 18O) in Hydrological Studies in the Jonkershoek Valley, Water SA., 20, 151–154, 1994.
Mokua, R. A., Glenday, J., Nel, J., and Butler, M.: Combined use of stable isotopes and hydrochemical characteristics to determine streamflow sources in the Jonkershoek Catchment, South Africa, Isotopes Environ. Health Stud., 56, 1–22, https://doi.org/10.1080/10256016.2020.1760861, 2020.
Pramono, I. B., Budiastuti, M. T., Gunawan, S., and Wiryanto, T.: Base Flow from Various Area of Pine Forest at Kedungbulus Sub Watershed, Kebumen District, Central Java, Indonesia, Int. J. Dev. Sustain., 6, 99–114, 2017.
Price, K.: Effects of Watershed Topography, Soils, Land Use, and Climate on Baseflow Hydrology in Humid Regions: A Reviw, Prog. Phys. Geo, 35, 465–492, 2011.
Price, K., Jackson, C. R., Parker, A. J., Reitan, T., Dowd, J., and Cyterski, M.: Effects of Watershed Land Use and Geomorphology on Stream Low Flows during Severe Drought Conditions in the Southern Blue Ridge Mountains, Georgia and North Carolina, United States, Water Resour Res., 47, 2516–2534, 2011.
Roets, W., Xu, Y., Raitt, L., and Brendonck, L.: Groundwater Discharges to Aquatic Ecosystems Associated with the Table Mountain Group (TMG) Aquifer: A Conceptual Model, Water SA., 34, 77–88, 2008.
Saayman, I. C., Scott, D. F., Prinsloo, F. W., Moses, G., Weaver, J. M. C., and Talma, S.: Evaluation of the Isotopes in the identification of the streamflow generation in the TMG Catchments, Water Research Commission Report, No. 1234/1/03, 2003.
SAEON (South African Environmental Observation Network and South African Forestry Research Institute and Council for Scientific and Industrial Research): SAEON DATA PORTAL [data set], https://catalogue.saeon.ac.za/records (last access: January 2022), 2019.
Santhi, C., Allen, P. M., Muttiah, R. S., Arnold, J. G., and Tuppad, P.: Regional Estimation of Base Flow for the Conterminous United States by Hydrologic Landscape Regions, J. Hydrol., 351, 139–153, 2008.
Saraiva Okello, A. M. L., Uhlenbrook, S., Jewitt, G. P. W., Masih, I., Riddell, E., and van der Zaag, P.: Hydrograph Separation Using Tracers and Digital Filters to Quantify Runoff Components in a Semi-Arid Mesoscale Catchment, Hydrol. Process., 32, 1334–1350, https://doi.org/10.1002/hyp.11491, 2018.
Scott, D. F., Prinsloo, F. W., Moses, G., Mehlomakulu, M., and Simmers, A. D. A.: A Re-Analysis of the South African Catchment Afforestation Experimental Data, Water Research Commission, 810, 1–138, 2000.
Slingsby, J. A., Buys, A., Adrian, D. A., Simmers, A., Prinsloo, E., Forsyth, G. G., Glenday, J., and Allsopp, N.: Jonkershoek: Africa's Oldest Catchment Experiment – 80 Years and Counting, Hydrol. Process., 35, 1–7, 2021.
Smakhtin, V. U.: Estimating Continuous Monthly Baseflow Time Series and Their Possible Applications in the Context of the Ecological Reserve, Water SA., 27, 213–217, 2001.
Tallaksen, L. M.: A Review of Baseflow Recession Analysis, J. Hydrol., 165, 349–370, https://doi.org/10.1016/0022-1694(94)02540-R, 1995.
Xu, Y., Wu, Y., and Beekman, H. E.: The role of interflow in estimating recharge in mountainous catchments, in: Groundwater Recharge Estimation in Southern Africa, edited by: Xu, Y. and Beekman, H. E., UNESCO IHP Series No. 64, 135–145, 2003.
Yao, L., Sankarasubramanian, A., and Wang, D.: Climatic and Landscape Controls on Long-Term Baseflow, Water Resour. Res., 57, 1–20, https://doi.org/10.1029/2020WR029284, 2021.