the Creative Commons Attribution 4.0 License.
the Creative Commons Attribution 4.0 License.
 | 18 Apr 2024
Data rescue and valorization of old climatological data – application to rainfall data in Burkina Faso and Ivory Coast using NUNIEAU software
Jean-Emmanuel Paturel
Bérenger Kouacou
Franck Lohou
Frédéric Pons
Kouakou Dje
Naky Coulibaly
Harouna Karambiri
Valérie Borrell
Andrew Ogilvie
Eric Servat
In 2011, the XVI World Meteorological Congress Resolution 16 gives priority to the rescue and digitization of climate archives and to promote global and regional initiatives to collaborate on DARE (data rescue) and the exchange of scientific knowledge and related technological advances. The Congress urged Members to make every effort to prevent the deterioration of climate-relevant data and to make these data available to support climate change analyses and relevant climate services. In the framework of operational and scientific research actions around the updating of hydrological standards in West Africa (Actualisation des Normes hydrologiques en Afrique de l'Ouest – ActNAO Project) and in response to the WMO call, we used the NUNIEAU software (NUmérisation de NIveaux d'EAU en mer ou en rivières – free software from CEREMA) which allows the digitization of different types of paper documents by automatic recognition. This software has been used on rainfall pluviograms in Burkina Faso and Côte d'Ivoire. The use of this tool allows rainfall analysis on intraday time steps, a time step that is very useful for the knowledge and management of flash-flood events in small basins, especially urban basins. Illustrated by a few scientific results, access to these data, which remains very limited in West Africa, opens up fields of analysis that are not only disciplinary but also, and above all, inter or transdisciplinary.
- Article
(752 KB) - Full-text XML
- BibTeX
- EndNote


Field observation; data rescue; pluviogram digitization; Burkina Faso; Côte d'Ivoire; NUNIEAU software
In West Africa, urban flooding has been in the medias for several years due to poorly controlled and planned urbanization and a non-stationary climate on a human scale marked by a succession of rainy periods and dry periods without any cycle.
Knowledge of short-duration rainfall is useful information if one is interested in runoff and potential overflow in small watersheds (Puech and Chabi-Gonni, 1984). For many years, rain gauges have been installed throughout the sub-region in synoptic stations to measure rainfall at sub-day time steps: yesterday in paper form (pluviograms), today, more generally in digital form, even if there are still many recording rain gauges in paper form.
2.1 DARE Project
Data Rescue (DARE) belongs to the long-standing strategic priorities of WMO. The Eighth Commission for Climatology in 1982, urged donor countries to support the African Dare I project (https://insitu.copernicus.eu/library/reports/copy_of_20211217_EEA_Report_DataRescue_v8_sent.pdf, last access: 12 April 2023). In 2011, the World Meteorological Organization reiterated its request to WMO Members to give priority to the rescue and digitization of climate archives to make these data available (WMO, 2011).
The project has continued year after year and has allowed Côte d'Ivoire to do a lot of work archiving its climate data in 2018. For various reasons, the work was limited to scans of the Monthly Climatological Tables (MCT). It is important to remember that these scans do not make the data usable, it is only a photograph of documents. This would require finding tools to digitize these documents. On the other hand, nothing has been done for the pluviograms. The Direction Nationale de la Météorologie from Côte d'Ivoire would archive nearly 300 000 pluviograms.
2.2 Processing and valorisation of rainfall data
However, these pluviograms are a mine of information for scientific knowledge that allow, inter alia, the knowledge of rainfall dynamics, the analysis of climate change, the production of relevant climatological services. Yet, these pluviograms remain most of the time in cupboards and are only too seldom examined – when they have not been lost or deteriorated by humidity, heat, dust, mould… floods!
Around 1980, the Comité Interafricain d'Etudes Hydrauliques (CIEH) decided to carry out this analysis for extreme events in a large number of its member countries, i.e. about ten African countries. A document was produced as a result of this work which presents the height-duration-frequency (HDF) curves for West and Central Africa for rainfall from 5 min to 24 h (Puech and Chabi-Gonni, 1984). Since then, no large-scale updates have been made and the rainfall records have continued to be stored in the cupboards.
Some countries, such as Senegal and Côte d'Ivoire, have updated this process as part of their research. In Côte d'Ivoire, Soro (2011) compiled a number of rainfall records up to 2001. This process was done manually and only a selection of pluviograms could be considered due to the difficulty of the task.
To our knowledge, there are only a few software programs that try to simplify this task by automating it as much as possible. The NUNIEAU software (Numérisation de Niveaux d'EAU en mer ou en rivières) allows this semi-automation. We used it for this study.
2.3 NUNIEAU software
The NUNIEAU software was developed by the Hydraulic Service of Cerema Méditerranée under Windows environment and coded under MatLab (https://www.cerema.fr/fr/actualites/logiciel-numerisation-enregistrements-graphiques-niveaux-eau, last access: 12 April 2023). CEREMA has register and deposit the software code with APP (Agence pour la Protection des Programmes – European organism specialized in the protection of software, mobile applications, databases, websites and strategic data – https://www.app.asso.fr/, last access: 12 April 2023). The executable code is available for free.
Its principle is simple: on a previously scanned image, the software locates the image in a marker and recovers the signal recorded on the paper, made up of pixels whose color is included in a predefined range: a paper data is thus transformed into a digital data then usable.
The quality of the data generated from the NUNIEAU software is dependent of the quality of the rainfall data; however this latter aspect is not a subject of this article.
Two examples of application of NUNIEAU immediately come to mind for hydrologists: the fine analysis of rainfall events to better understand their dynamics but also, and above all, the elaboration of Height-Duration-Frequency (HDF)/Intensity-Duration-Frequency (IDF) curves – and more generally the elaboration of project synthetic rainfall. These various curves are essential elements in the design of many hydraulic infrastructures. Thus, we propose:
-
to compare the HDF curves obtained with NUNIEAU on the most recent possible extreme event data with existing historical curves;
-
to show some fine analyses of the intraday rainfall at the Abidjan and Ouagadougou stations.
The objective is to illustrate what access to these data can open up as fields of analysis in Hydrology because the results presented do not always respect the usual scientific rules such as working on identical sample sizes.
3.1 NUNIEAU data
Within the framework of the ActNAO project (Actualisation des Normes hydrologiques en Afrique de l'Ouest), work with NUNIEAU has begun on data from the rainfall stations of Ouagadougou in Burkina Faso (events qualified as extreme) and Abidjan-Aéroport in Côte d'Ivoire (all events recorded). The pluviograms were made available to us by the Direction de la Météorologie Nationale.
For Ouagadougou, a selection of rainfall records was made by Traoré (2012). With NUNIEAU, 541 extreme rainfall events (in terms of accumulation and intensity) were analysed at a time step of 5 min over the period 1977–2011, i.e. about 30 years with gaps.
For Abidjan, all rainfall records were processed by NUNIEAU at a time step of 5 min over the period 1988–1999, i.e. about 10 years with some gaps. It should be noted that since all rainfall records are processed, this allows for continuity of rainfall (or non-rainfall) measurements, thus facilitating work on rainy events as well as on drought events.
3.2 Historical data
The historical data for the HDF curves for Ouagadougou and Abidjan are taken from the CIEH document. The quality of the reproduction of the document (even the original) is not very good and we had to redo some processing following the methodology described in the source document in order to validate some of the “decoded” figures. For Ouagadougou, the period covered is 29 years between 1954 and 1982; for Abidjan, the period covered is 28 years between 1951 and 1978.
The document by Soro (2011) allowed a first update of the IDF curves of the Abidjan station with the consideration of rainfall patterns between 1957 and 2001.
3.3 Working methodologies
3.3.1 HDF curves
In order to make the results as comparable as possible, it is necessary to apply the same methodology for the different calculations made. We will therefore briefly present the methodology explained by the CIEH (Puech and Chabi-Gonni, 1984):
-
“we only recorded storm events that could provide information”;
-
the sample includes all values above a threshold. The threshold is: for “n” years of observations, we retain “m” values with m=3n;
-
the adjustment of the sampled rainfall is done using an exponential law and the method of moments to calibrate its parameters;
-
the HDF curves were approximated by fitting a “Montana” type law: (H in mm, t in mn) with a 2-step adjustment: t<1 h and t>2 h.
Scripts were coded in R to be able to repeat these different processing steps.
Soro (2011) used a different methodology that must have impacts on the results obtained: also values above a threshold but with a differently defined threshold, applications of different rainfall fitting laws according to rainfall durations (Gumbel, GEV and Log-Normal), one fitting of a “Montana” type law to the HDF curves for rainfall durations less than 2 h.
3.3.2 Intraday analysis of rainfall events
This depends on the quantity and quality of the data. But access to intraday data opens up many fields of analysis. For example, it can be used to:
-
statistical analyses of time series of variables deduced from rainfall: cumulative total, number of rainy days, number of dry days…
-
event analyses: fine characterization of the event such as duration, start time, end time, time of the position of the rainfall maximum within the event, its position in relation to the total duration of the event, determination of the rainiest time slots…
We will present here some results that result from an event-driven analysis. Scripts have been coded in R.
Table 1Montana coefficients (a and b) for two fits of HDF curves for Ouagadougou (CIEH: 1954–1982; NUNIEAU: 1977–2011).

4.1 Ouagadougou HDF curves
Table 1 compares the Montana coefficients of the CIEH work on years prior to 1982 with those obtained by NUNIEAU from data between 1977 and 2011. The b coefficients do not vary much, unlike the a coefficients: for very similar b coefficients, for rainfall of less than 1 h duration, the CIEH a coefficients are higher than those of the new adjustment, whereas for rainfall of more than 2 h duration, the CIEH a coefficients are lower than those of the new adjustment.

Figure 1Height-Duration-Frequency curves for two fits of HDF curves for Ouagadougou (CIEH grey: 1954–1982; NUNIEAU black: 1977–2011; solid line: 1 year, dotted line: 10 years) – Attention, it is a log-log scale!
Figure 1 shows what these differences between Montana's parameters give in terms of height values for different event durations and different return periods. The two adjustments are finally quite close with however for the period of return 1 year and for events higher than 2 h heights less strong now.
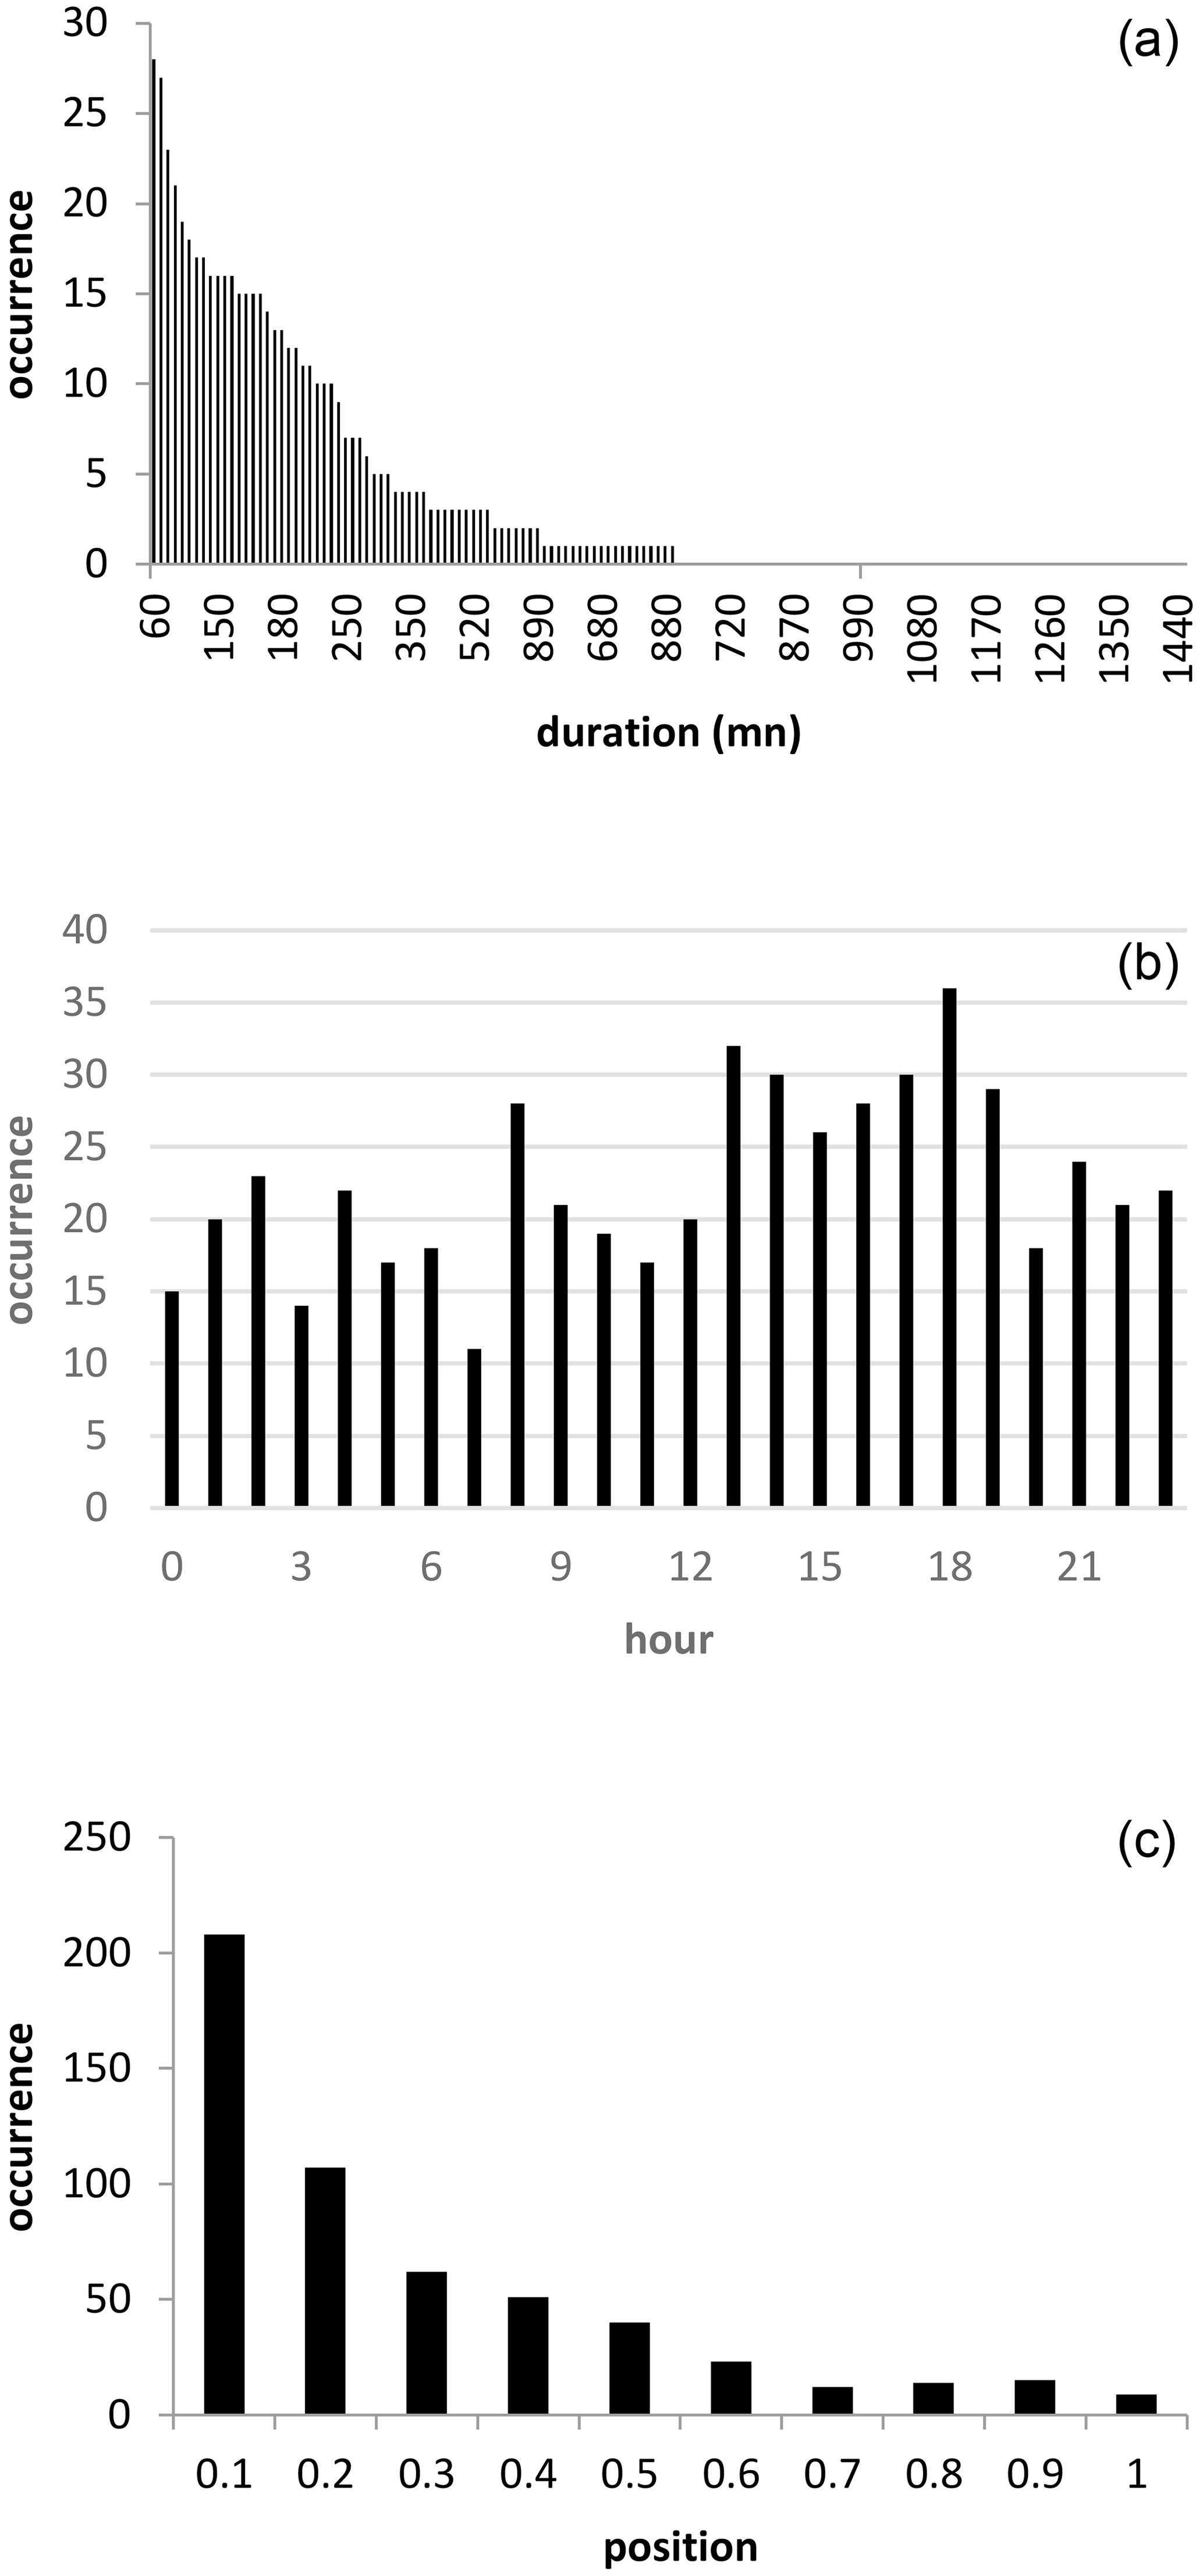
Figure 2Some characteristics of the 541 rainfall events recorded over the city of Ouagadougou between 1977 and 2011: (a) occurrence of the duration of the events; (b) occurrence of the starting time of the events; (c) occurrence of the position of the maximum rainfall over 5 min within a rainfall event of normalized duration at 1 unit time.
4.2 Intraday analysis Ouagadougou
Figure 2 shows some of the characteristics of the 541 rainfall events analysed.
The median duration of the extreme rainfall events is 175 min, i.e. slightly less than 3 h. Extreme events generally began in the late afternoon, which may be related to the maximum convection at the origin of much of the rainfall over Ouagadougou. However, we note that at other times of the night or day, there are extreme events that begin which may correspond to events of a rather stratiform nature. The shape of the extreme rainfall is rather triangular, with a very large shower body in the first part of the rainfall, which decreases as the extreme event develops.
Table 21 year return period rainfall quantiles adjusted by a Montana law – Soro (1957–2001), CIEH (before 1982) and NUNIEAU (1988–1999).
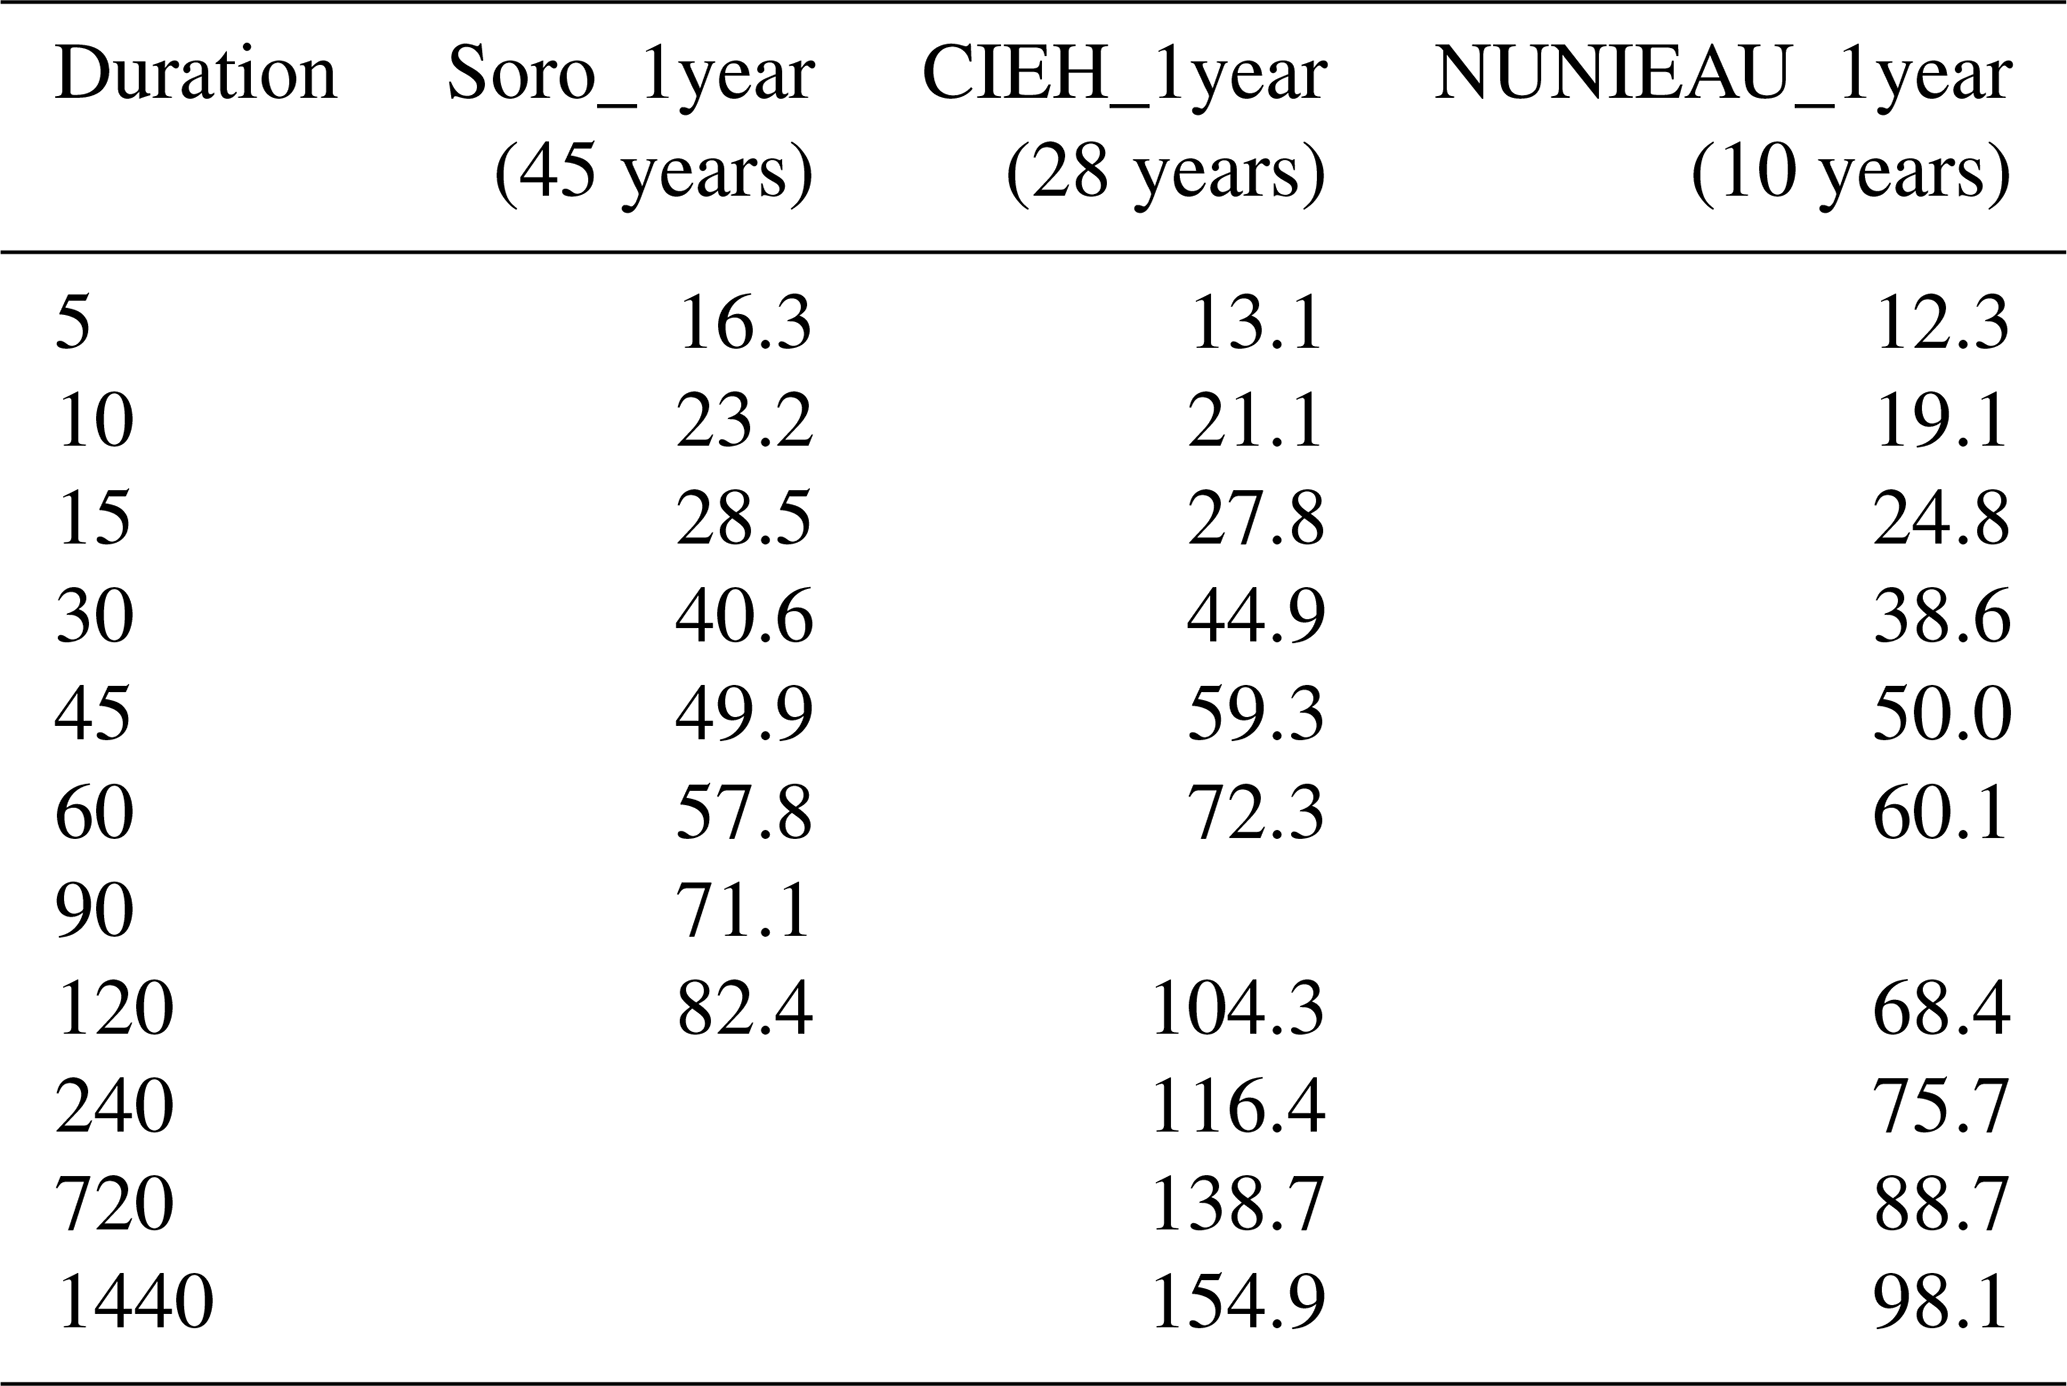
4.3 Abidjan HDF curves
Table 2 compares the quantiles estimated by the Montana laws calculated by Soro (2011), by the CIEH (Puech and Chabi-Gonni, 1984) and by NUNIEAU. Because of the very short period (10 years) of the data processing that could be done using NUNIEAU on the Abidjan station, we limited ourselves to the quantiles of return period 1 year.
More or less important differences appear. Soro (2011) thus highlights stronger rainfall quantiles on short event durations (<30 min) while on longer events, the quantiles were lower. However, these discrepancies may also be related to several factors: the definition of the samples is not the same, the adjustment laws differ from one author to another (Soro, 2011, and CIEH), the durations of the reference period are very different (from 10 to 45 years).
The few scientific results presented must be viewed with great caution because a good number of “scientific rules” have not been followed: for example, the duration of the samples is not the same, the adjustment laws are different. The objective of this work was not to present innovative scientific results but rather to show what access to these data can open up in terms of disciplinary analysis but also, and above all, inter or transdisciplinary analysis: some of these results could allow for climatological services, others for agronomic services, others for civil security.
Access to sub-daily data opens up fields of analysis that are not always explored in Africa because of the difficulty of obtaining such data. In particular, the analysis of extreme events at these time steps will allow to better fight against the flooding episodes that African cities are increasingly facing. The vulnerability of these cities is more or less identified (poor governance, lack of infrastructure, lack of human and financial resources, non-systemic approaches to the problems …) and that of the pluviometric hazard/risk is still too badly perceived. The use of tools such as NUNIEAU should help to overcome this misperception.
The use of NUNIEAU required scanning paper documents (thus saving them for many years in a digital format) and transforming the paper data into usable digital data. Even if the arduous task of scanning is simplified, it is still long. For Côte d'Ivoire, two years ago, DNM estimate that it would take 2.5 years and 10 full-time staff to process their 300 000 pluviograms. But every month, the technicians improve and the working time is drastically reduced. In every way, there is a price to pay to make real progress in the knowledge and the fight against extreme events: a drop in the bucket compared to the costs of their impacts!
CEREMA has register and deposit the software code of NUNIEAU with APP (Agence pour la Protection des Programmes – European organism specialized in the protection of software, mobile applications, databases, websites and strategic data). The number of the deposit is IDDN.FR.001.510017.000.S.P.2005.000.30200. The executable code is available for free with access to the community https://www.expertises-territoires.fr/jcms/pl1_69057/fr/nunieau-logiciel-de-numerisation-des-enregistrements-graphiques-de-niveaux-d-eau (last access: 13 April 2023; Expertises Territoires, 2023). The executable code is available for free.
The data are not publicly accessible. They are the property of the Agence Nationale de la Météorologie of Burkina Faso and of the Direction de la Météorologie Nationale of Côte d'Ivoire.
JEP is the project administrator under the supervision of FP. Funds were acquired by ES, VB, AO and JEP. Resources in Côte d'Ivoire and Burkina Faso were provided by KD and HK respectively. NC, BK and FL were responsible for data preparation and software processing.
The contact author has declared that none of the authors has any competing interests.
Publisher's note: Copernicus Publications remains neutral with regard to jurisdictional claims in published maps and institutional affiliations.
This article is part of the special issue “IAHS2022 – Hydrological sciences in the Anthropocene: Past and future of open, inclusive, innovative, and society-interfacing approaches”. It is a result of the XIth Scientific Assembly of the International Association of Hydrological Sciences (IAHS 2022), Montpellier, France, 29 May–3 June 2022.
We thank the Agence Nationale de la Météorologie of Burkina Faso for allowing us in 2012 to scan rainfall pluviograms as part of a 2iE M2 internship.
We thank the Direction de la Météorologie Nationale of Côte d'Ivoire for supporting our work every day since 2020.
The project ActNAO (Actualisation des Normes Hydrologiques en Afrique de l'Ouest) is funded by the Institute of Research for Development, the University of Montpellier and the UNESCO ICIREWARD Center and is a response to the WMO call.
This paper was edited by Christophe Cudennec and reviewed by two anonymous referees.
Expertises Territoires: nunieau – logiciel de numerisation des enregistrements graphiques de niveaux d'eau, https://www.expertises-territoires.fr/jcms/pl1_69057/fr/nunieau-logiciel-de-numerisation-des-enregistrements-graphiques-de-niveaux-d-eau, last access: 13 April 2023.
Puech, C. and Chabi-Gonni, D.: Courbes Hauteur de Pluie-Durée-Fréquence – Afrique de l'Ouest et Centrale pour des pluies de 5 minutes à 24 heures, CIEH, Ouagadougou, 1984.
Soro, G. E.: Modélisation statistique des pluies extrêmes en Côte d'Ivoire, Thèse unique, Université Abobo-Adjamé, Abidjan, 2011.
Traoré, M.: Changement climatique : nouvelles courbes Intensité-Durée-Fréquence au Burkina Faso (Ouagadougou), Master Ingénierie, 2iE, Ouagadougou, 2012.
WMO: Seizième Congrès météorologique mondial, Genève, 1 May–3 June 2011, Rapport final abrégé et résolutions, OMM-No. 1077, https://library.wmo.int/?lvl=notice_display&id=7378#.Y8EcYnbP201 (last access: 12 April 2023), 2011.