the Creative Commons Attribution 4.0 License.
the Creative Commons Attribution 4.0 License.
 | 18 Apr 2024
The importance of retention times in Natural Flood Management interventions
Elizabeth Follett
Barry Hankin
David Mindham
Nick Chappell
The starting point for this study is the simulation study of Metcalfe et al. (2018) which suggested that retention times of the order of 10 h are required for natural flood management storage features to have a maximum effect on large flow peaks. A analysis of the celerity characteristics for some log jams at Tebay Gill, Cumbria (upland UK), suggests that the impacts of storage in slowing the celerities is only of the order of minutes. An analysis of storage-discharge dynamics based on observations at 4 jams reveals that the dynamics of storages can be represented with time constants of between 3 and 213 min, still well short of those required to maximise the effects for larger flood flows. That is not to say that there will not be reduction in flood peaks for smaller events, only that for large events the effects will be limited. A spreadsheet tool for retention times has been developed to help in the design of new schemes that is freely available.
- Article
(5011 KB) - Full-text XML
- BibTeX
- EndNote


Flood risk; flood damage estimates; instream wood jams; natural flood management
One of the strategies for natural flood management in the UK, that has been widely applied over the last few years, is the use of instream barriers to retain water during flood events with the aim of reducing peak magnitude, flooding of houses and businesses and consequently reduce damages. This intervention aims to increase water retention in upstream catchments via enhanced in-channel or floodplain storage, aiming to reduce burden on downstream flood infrastructure (Dadson et al., 2017; Lane, 2017). In a modelling study, Metcalfe et al. (2018) demonstrated how reduction in flood peak magnitude could depend on design of the structures used. If barriers filled and drained too quickly, the effect on the hydrograph would be minimal, even for large amounts of potential storage. The retention time in the storage was too short. If, however, barriers filled but did not drain between events, then a sequence of events before a major flood peak could mean that potential storage would have filled and that the effect on the coming flood peak would be minimal. In this case, the retention time in the storage was too long. The modelling results of Metcalfe et al. (2018) suggested that a mean retention time of 1 h was too short, and that a mean retention time of 100 h was too long. However, a retention time on the order of 10 h (600 min) could produce a significant reduction in a major flood peak that produced major flood damages (Storm Desmond, December 2015). More recent work has also reinforced the requirement for large amounts of storage to be made available, with design incorporating suitable retention times for peak flow reductions to be significant (Beven et al., 2022).
There is an issue, however, in that few, if any, of the in-stream log jams (or runoff attenuation features, RAFs) that have been installed to date in the UK have taken the concept of retention time into account (e.g. Figs. 1, 2 from the sequence of log jams at Tebay in Cumbria are a case in point). In this paper we provide a spreadsheet tool that might help improve the design of such in-stream RAFs of different designs (notably diverting flood-flows into bunded floodplain stores, rather than solely holding water in the channel) to produce retention times of the right order of magnitude. The RAFs within this study primarily hold water in the channel, typical of those throughout the upland UK, and are located at 54°24′49.55′′ N, 2°34′45.53′′ W (jam 16) within a channel incised into a diamicton surficial geology, over a Silurian sedimentary geology comprising of sandstone, siltstone and mudstone. The spreadsheet allows for a single RAF with simplified geometry that is treated as a brush or log jam spanning the channel. Other work is concerned with the representation of multiple RAFs in series down a headwater channel reach (Follett and Hankin, 2022).
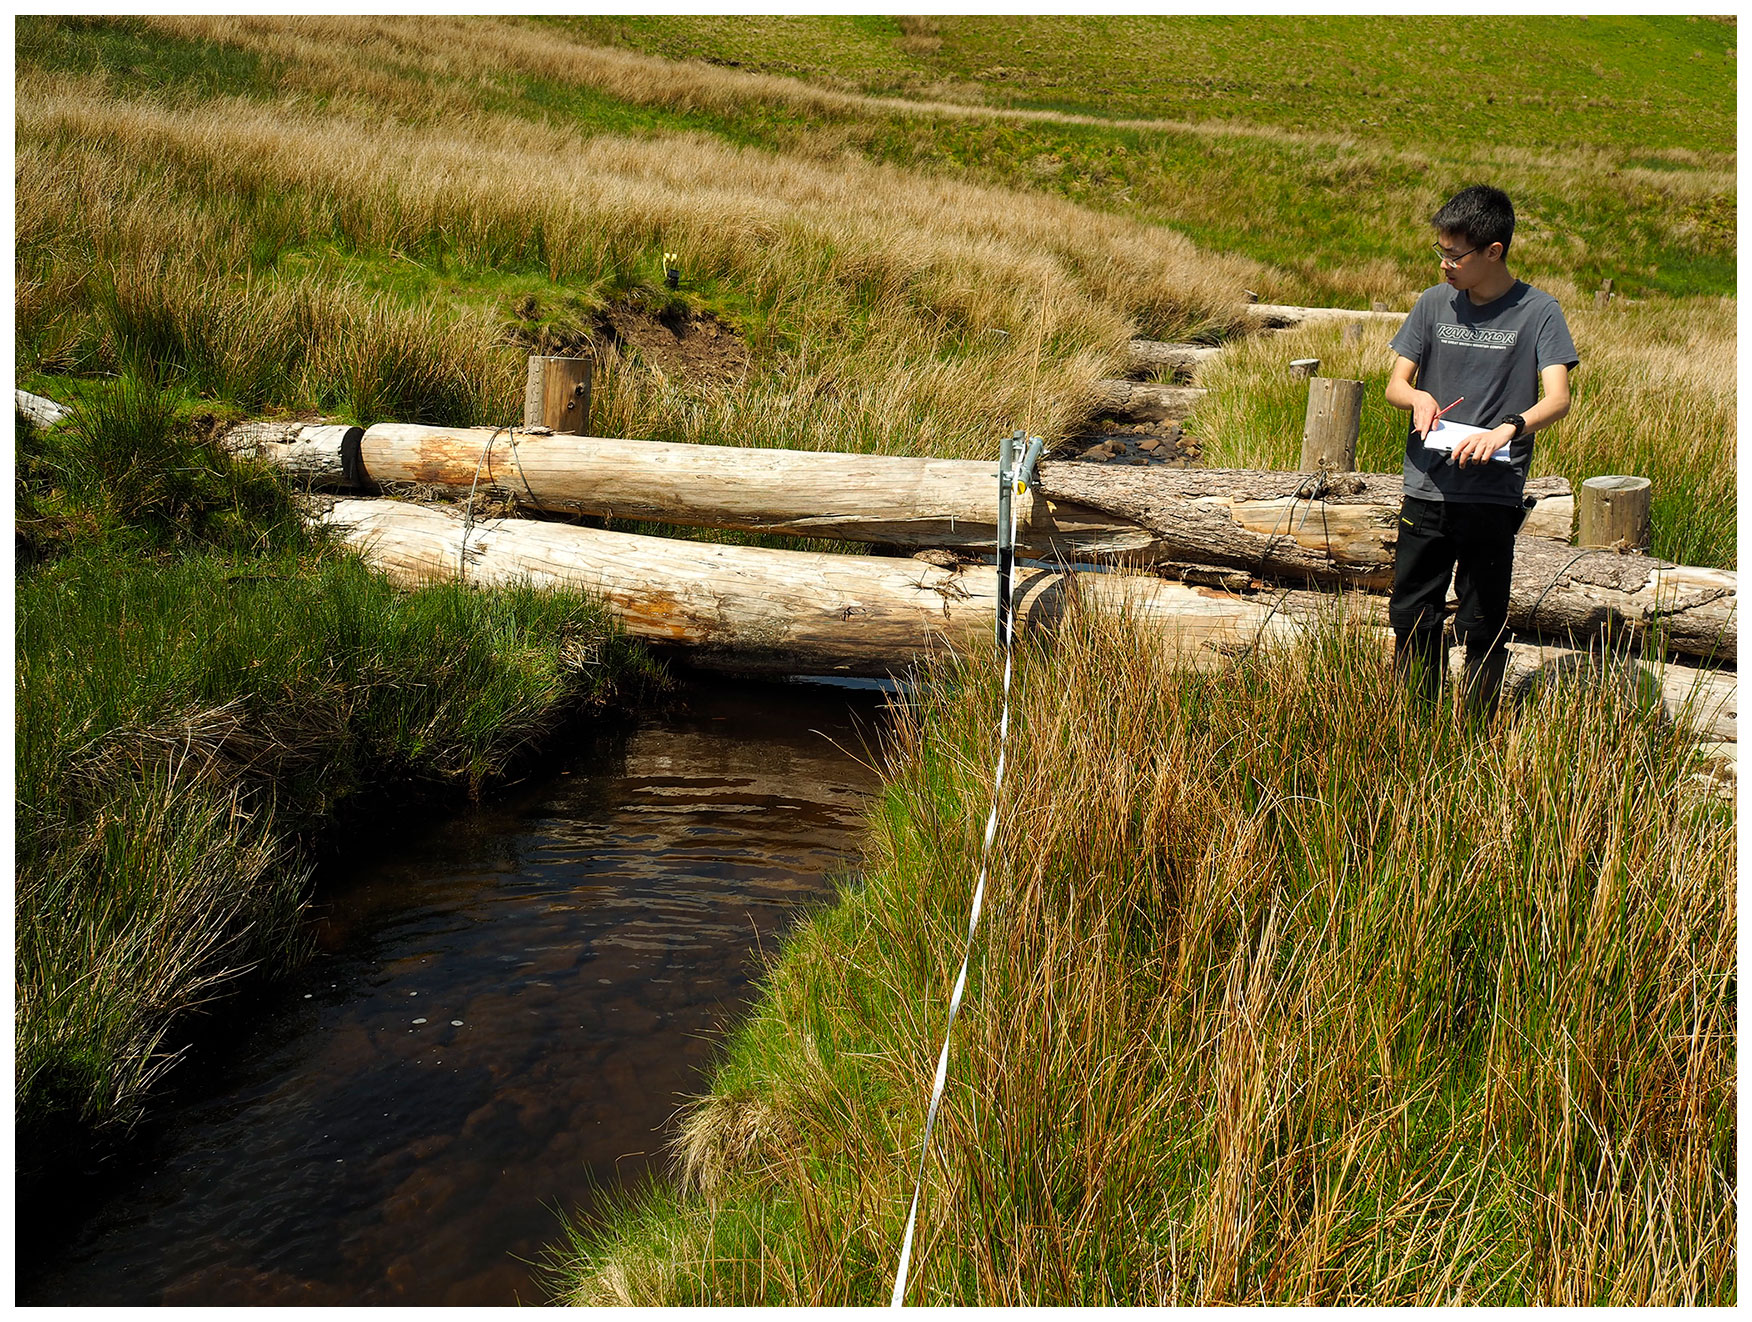

Figure 2The Tebay jams 19-17 in action, 11 January 2020 (photo courtesy of Tim Winder).
This spreadsheet (Follett and Beven, 2023) calculates the upstream depth, backwater volume, and residence times in the upstream backwater region behind a log jam from user-input channel and jam parameters for steady flow states. A compound trapezoidal channel is used based on specification of the channel bottom width, bankfull width, and estimated width of the channel 1 m above bankfull depth (Fig. 3).
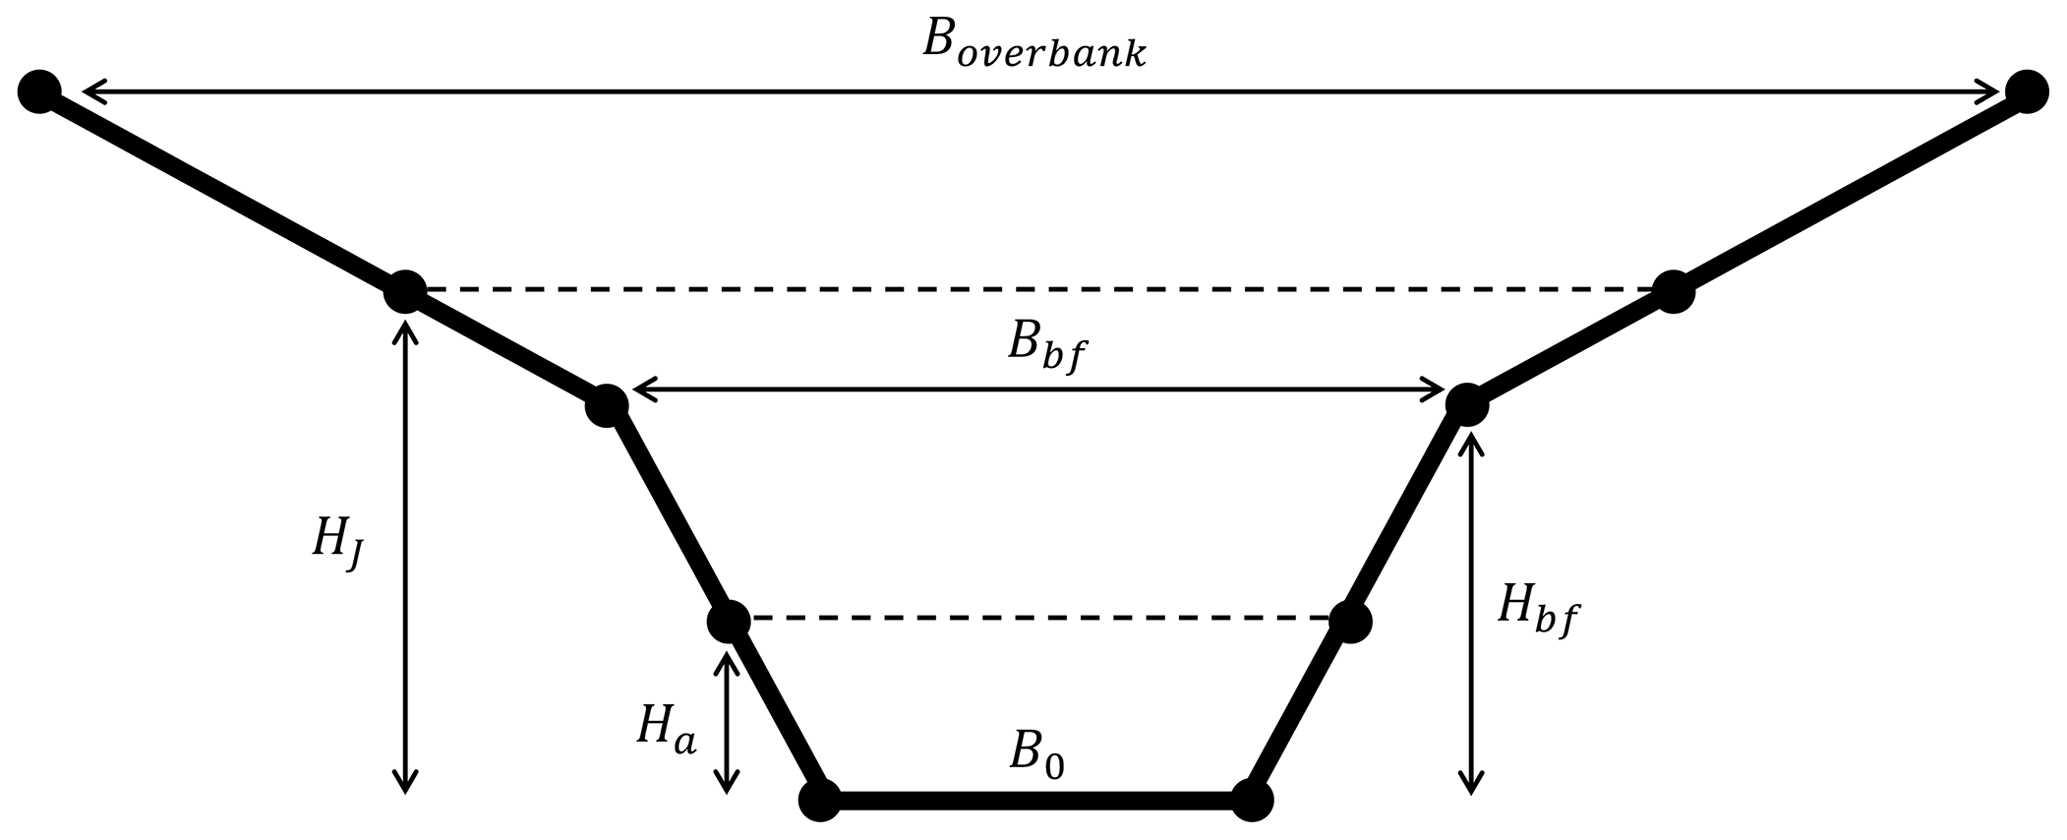
Figure 3Schematic diagram of channel cross section showing channel bottom width B0, bankfull width Bbf, overbank width 1 m above the channel bankfull depth, vertical distance of lower gap above the channel bed Ha, and vertical distance between the channel bed and top edge of the jam HJ.
Uniform flow is found from an input Chézy coefficient and slope, assuming a wide channel with low influence of sidewall resistance. The jam model accommodates jams that span the vertical distance of the channel and jams with a lower underflow gap (Follett et al., 2020, 2021). Flow over the jam once the storage has reached the top of the jam is assumed to follow a sharp-crested weir relationship (Munson et al., 2013; Hankin et al., 2020). Jam construction is related to relative magnitude of the jam-generated backwater rise. The backwater rise is given by the ratio of uniform flow depth to the flow depth generated upstream of a jam that spans the vertical channel extent, from which the dimensionless jam structural parameter, CA, is found.
3.1 Unobstructed open channel flow
The effect of a jam-generated backwater was investigated in a trapezoidal open channel of slope S, bankfull width Bbf, bankfull depth Hbf, and coefficient of gravitational acceleration g. Uniform flow depth h0 resulted from a balance between the weight of water on bed slope S balanced by bed friction, represented by a dimensionless Chézy coefficient Cz (Julien, 2010):
The channel followed a compound trapezoidal shape with bottom channel width B0 and overbank width 1 m above the channel bankfull depth Boverbank. The channel width B(z) was then,
for the in-channel and overbank sections.
3.2 Jam-generated upstream backwater rise
Flow through a jam generated momentum loss proportional to the number, size, and packing density of the logs comprising the jam (Follett et al., 2020, 2021), elevating the water depth upstream of the jam relative to unobstructed open channel flow. Flow through a jam with a lower gap was a combination of unit discharge passing through the jam and lower gap sections:
with vertical distance of the lower gap a, dimensionless jam structural parameter CA related to the jam length LJ, drag coefficient for a rigid circular cylinder Cd≅1, frontal area density af, and solid volume fraction ϕ (; Follett et al., 2020), gate discharge coefficient and (Malcherek, 2018; Follett et al., 2021). The dimensionless friction coefficient Cf may be related to the Chézy coefficient, (Julien, 2010). CA increases with the amount of solid wood present in the jam, and higher CA results in higher jam-generated backwater rise for a given discharge. Equation (3) corresponds to the upstream depth for a channel-spanning jam (Follett et al., 2020) when the lower gap vertical distance a=0,
CA was related to the relative magnitude of jam-generated backwater rise by comparing the upstream backwater depth generated by a channel-spanning jam (Eq. 4) and unobstructed uniform flow (Eq. 1), for the same unit discharge,
with the relationship between CA and relative ratio independent of unit discharge (Follett and Hankin, 2022). Discharge passing over the jam top edge HJ was represented by a sharp-crested weir (Munson et al., 2013; Hankin et al., 2020),
with discharge when upstream water depth is equal to the jam top edge Q(hJ=HJ) given by Eq. (3). The upstream backwater generated by the jam was assumed to occupy a simplified triangular shape, with backwater length and backwater volume
above the channel uniform flow volume . The total volume of water in the segment was then . The storage retention time was estimated from .
If we take a jam of dimensions similar to that of Fig. 1 at Tebay Gill we can use the spreadsheet to calculate the expected wave retention times. The data are input in a block as shown in Fig. 4a with the logs assumed to act as a solid gate.
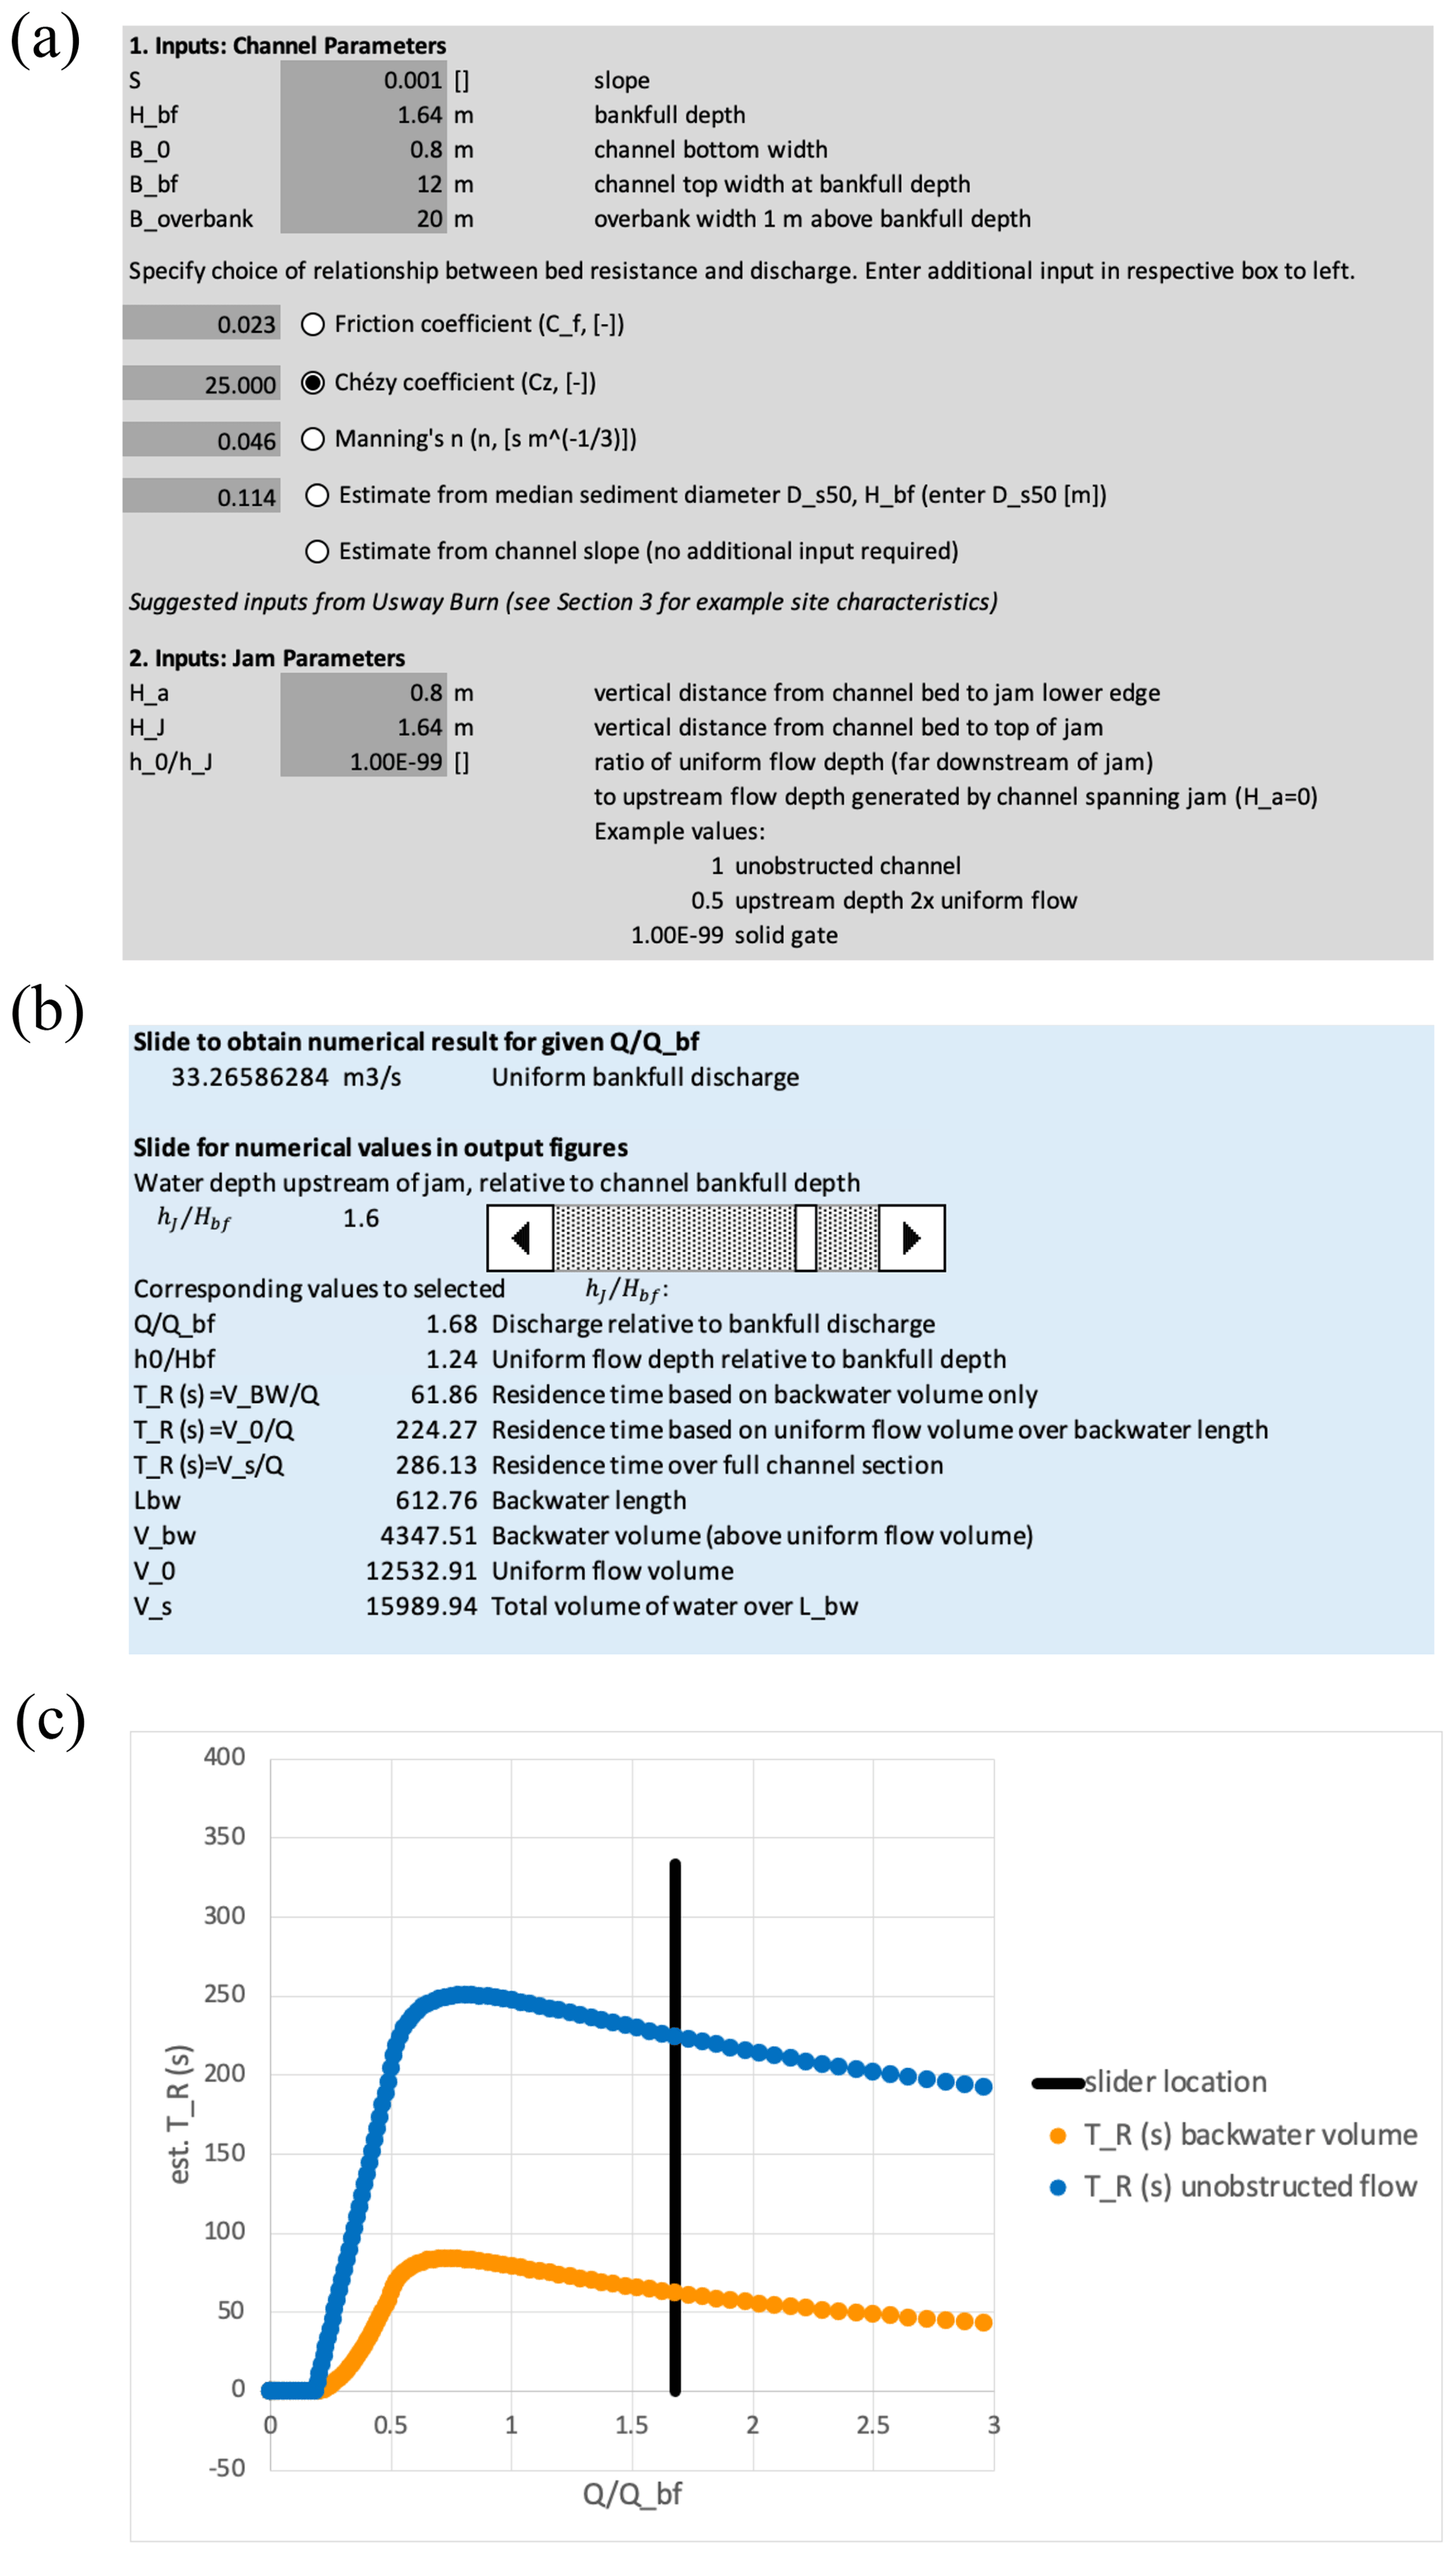
Figure 4(a) input data block, (b) output data block, and (c) part of graphical output block of spreadsheet tool, representing jam of dimensions similar to Fig. 1 acting as a solid gate.
Outputs are given both as numeric values for a given discharge or as graphical outputs over a range of discharge values (Fig. 5). Figure 4b, c shows the outputs for calculated retention times for storage behind the jam based on celerities over the backwater profile and using average backwater depth in comparison with the case of uniform flow without the jam in place. Other plots of the storage and water depths for different flow rates are also provided. The calculations for Jam 16 at Tebay Gill shown in Fig. 4 suggest that the peak flood wave retention time is on the order of minutes, peaking at about half the bankfull flow, not the hours suggested as most effective in the Metcalfe et al. (2018) study. The celerities are always slower than for uniform flow at the same discharge but give response times much less than the 1 h that Metcalfe et al. (2018) suggested would have relatively small effects on larger flood peaks.
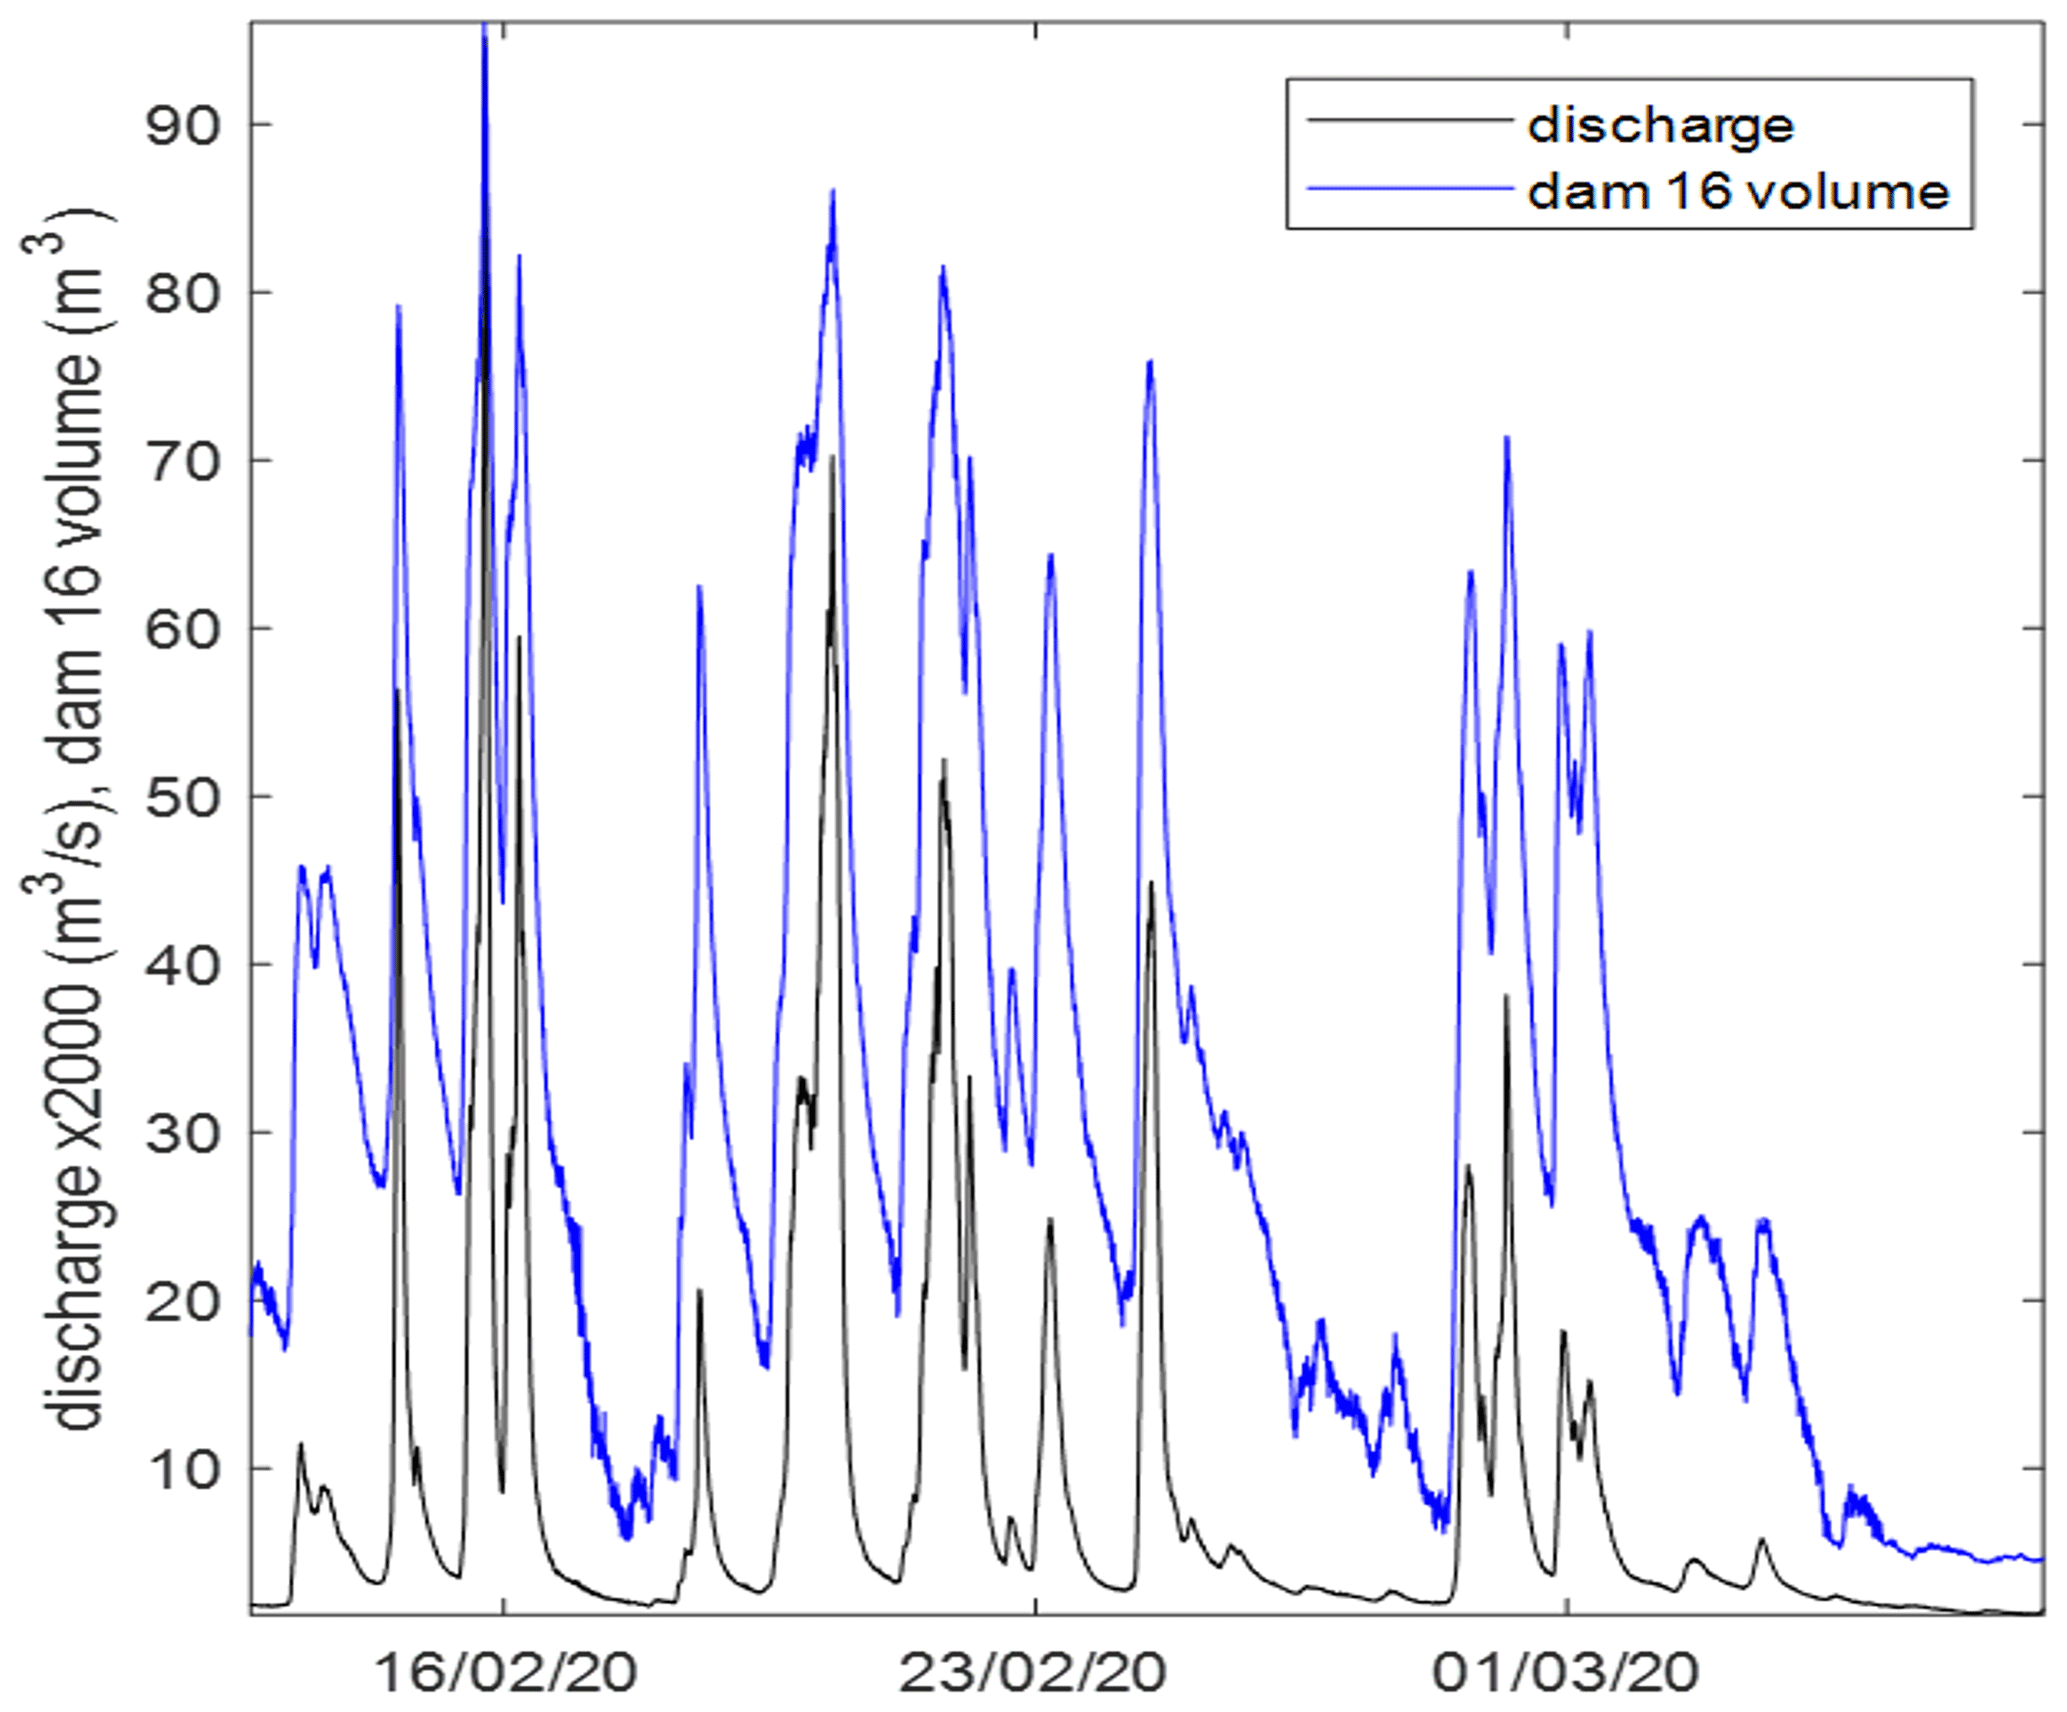
Figure 5Part of the time series of upstream flume discharge and storage volume at Tebay Jam 16 used in the DBM model analysis (including an approximately 1-in-1 year daily discharge event on 21 February 2020: derived from 4 years of record).
This analysis suggests that the dynamics of the storage volumes generated by RAFs are more important than the slowing of the celerities in determining the overall impacts of the jam. This, in effect, was also the basis of the Metcalfe et al. (2018) simulations, which treated each of many thousands of storage elements in the catchment as a linear store with an assumed time constant. For 4 of the jams at Tebay, including Jam 16, we can determine the time constants for the storage volume by fitting a Data-based Mechanistic (DBM) model (e.g. Young and Beven, 1994; Magliano et al., 2019) to the time series of discharges measured at an upstream flume and the volumes behind each jam, estimated from pressure transducer recordings of water level and channel geometry.
Table 1Results of first order DBM analysis of discharge/storage relationship for the jams with level recorders at Tebay.
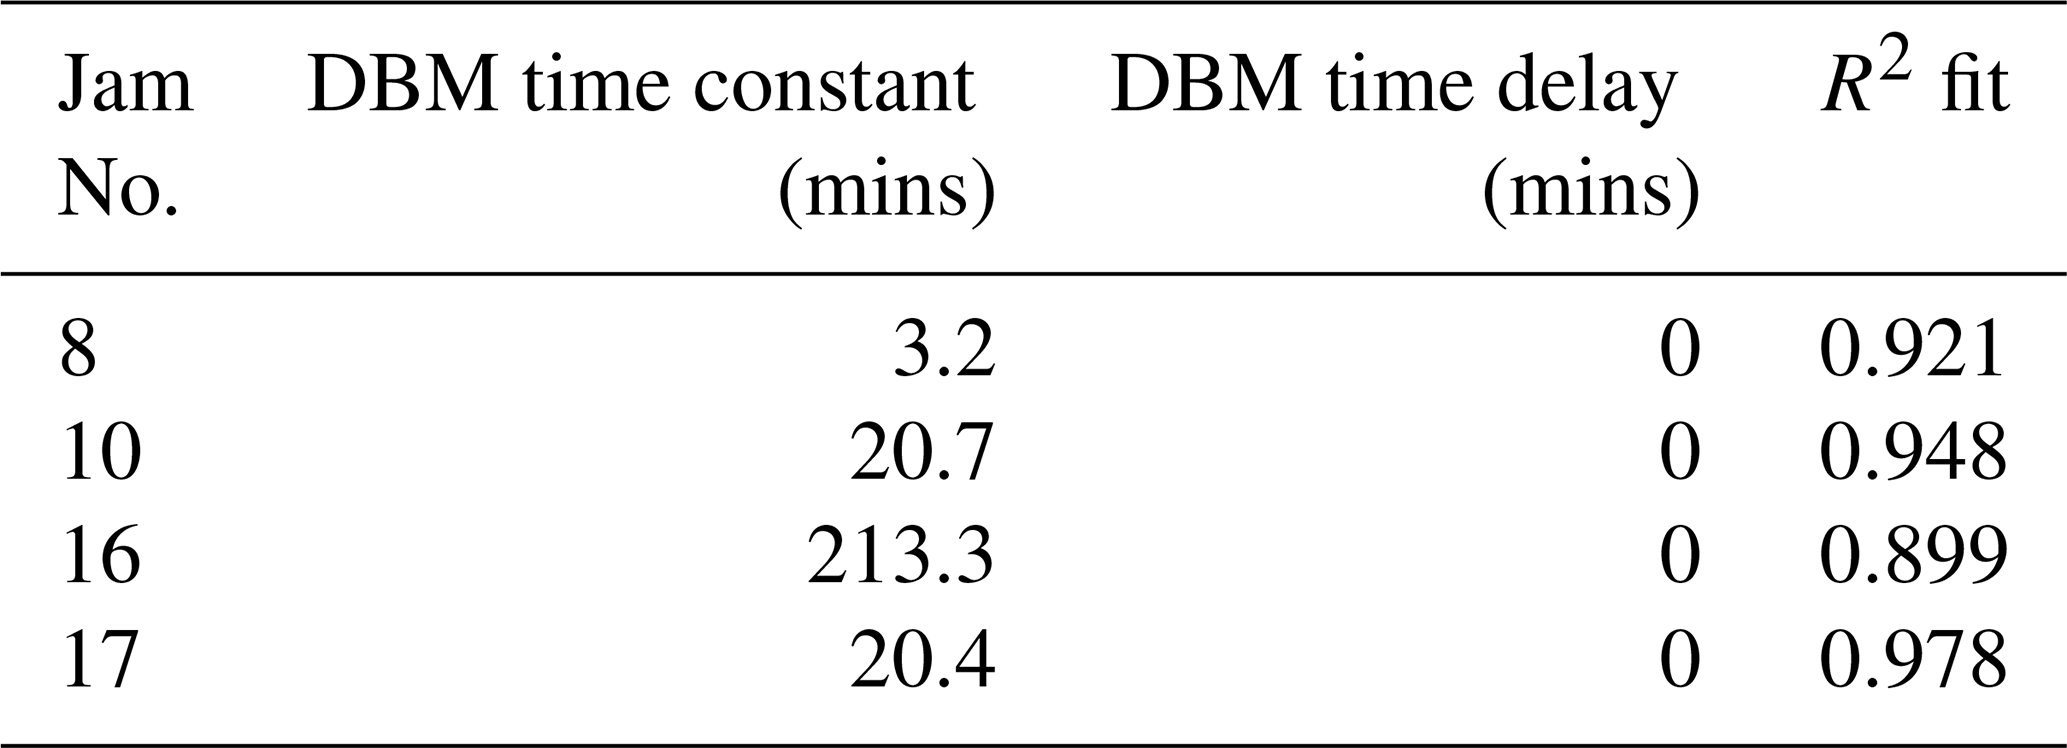
Figure 5 shows part of the time series available for a succession of events in February 2020. It is worth noting here that, as shown in Fig. 2, the storage volumes behind the jams are limited by the jam spacing, which will have an impact on the response (see Follett and Hankin, 2022, for an analysis of sequences of jams). Table 1 shows the results for each of the 4 jams with recorded water level. These time constants are longer than the estimated flood wave response based on the celerities, but are still less than the suggested 10 h required to maximise the impact on large floods suggested by Metcalfe et al. (2018). Jam 16, with the largest length upstream to the next jam (19 m) and critically the only jam with significant floodplain engagement, has the longest storage retention time at 3.5 h.
These results give a basis for estimating the volumes of storage that might be required to obtain the magnitude of retention times behind jams to achieve the maximum impact for large flood events such as Storm Desmond. The differences are striking. For example, if we take the Metcalfe et al. (2018) suggestion of 10 h (600 min) as of the right order, then between 2.8 and 187 times more storage would be required at each site.
A spreadsheet analysis of the effects of natural flood management flow retention features, allowing for underflow, seepage and weir overtopping under steady flow conditions shows that the celerities at higher flows are not sufficiently slowed to have a major impact on large or small flood events. This leads to the conclusion that any effects will be dominated by the dynamics of the storage behind the retention features. For the jams with level recorders, this is assessed in terms of the time constants calibrated for a first order DBM model. Comparison with the suggested retention time of approximately 10 h from the simulations by Metcalfe et al. (2018) that, for maximum impact at higher flood flows, retention times should be neither too long nor too short, reveals that the storages should be much larger. That is not to say that there will not be reduction in discharge peaks for frequently occurring rain-events, only that for events that produce flooding the effects will be limited.
The spreadsheet is freely available under hosting from the JBA Trust at https://www.jbatrust.org/how-we-help/publications-resources/rivers-and-coasts/nfm-leaky-barrier-retention-times (last access: 6 April 2023) and is archived in the Zenodo repository at https://doi.org/10.5281/zenodo.7806786 (Follett and Beven, 2023).
No additional data are required to run the spreadsheet. Data for the Tebay dams are available on request from Nick Chappell (n.chappell@lancaster.ac.uk).
KB conceived the idea for a software tool to calculate retention times for in-stream NFM measures. Most of the programming was done by EF. NC, DM and BH contributed to both the field and data analysis that were used to check the calculations. All authors contributed to the writing and editing of the paper.
The contact author has declared that none of the authors has any competing interests.
Publisher’s note: Copernicus Publications remains neutral with regard to jurisdictional claims in published maps and institutional affiliations.
This article is part of the special issue “IAHS2022 – Hydrological sciences in the Anthropocene: Variability and change across space, time, extremes, and interfaces”. It is a result of the XIth Scientific Assembly of the International Association of Hydrological Sciences (IAHS 2022), Montpellier, France, 29 May–3 June 2022.
This study has been carried out under the NERC funded Q-NFM project (grant no. NE/R004722/1). The first author has received funding from the Royal Academy of Engineering's Research Fellowships programme and the European Regional Development Fund through the Welsh Government Sêr Cymru programme (grant no. 80762-CU-241).
This paper was edited by Christophe Cudennec and reviewed by two anonymous referees.
Beven, K. J., Page, T., Hankin, B., Smith, P., Kretzschmar, A., Mindham, D., and Chappell, N. A.: Deciding on fitness-for-purpose – of models and of natural flood management, Hydrol. Process., 36, e14752, https://doi.org/10.1002/hyp.14752, 2022.
Dadson, S. J., Hall, J. W., Murgatroyd, A., Acreman, M., Bates, P., Beven, K., Heathwaite, L., Holden, J., Holman, I. P., Lane, S. N., O'Connell, E., Penning-Rowsell, E., Reynard, N., Sear, D., Thorne, C., and Wilby, R.: A restatement of the natural science evidence concerning catchment-based “natural” flood management in the UK, P. R. Soc. A, 473, 20160706, https://doi.org/10.1098/rspa.2016.0706, 2017.
Follett, E. and Beven, K.: Design tool: Leaky barrier retention times for Natural Flood Management interventions, Zenodo [code], https://doi.org/10.5281/zenodo.7806786, last access: 6 April 2023.
Follett, E. and Hankin, H.: Investigation of effect of logjam series for varying channel and barrier physical properties using a sparse input data 1D network model, Environ. Modell. Softw., 158, 105543, https://doi.org/10.1016/j.envsoft.2022.105543, 2022.
Follett, E., Schalko, I., and Nepf, H.: Momentum and energy predict the backwater rise generated by a large wood jam, Geophys. Res. Lett., 47, e2020GL089346, https://doi.org/10.1029/2020GL089346, 2020.
Follett, E., Schalko, I., and Nepf, H.: Logjams with a lower gap: Backwater rise and flow distribution beneath and through logjam predicted by two-box momentum balance, Geophys. Res. Lett., 48, e2021GL094279, https://doi.org/10.1029/2021GL094279, 2021.
Hankin, B., Hewitt, I., Sander, G., Danieli, F., Formetta, G., Kamilova, A., Kretzschmar, A., Kiradjiev, K., Wong, C., Pegler, S., and Lamb, R.: A risk-based network analysis of distributed in-stream leaky barriers for flood risk management, Nat. Hazards Earth Syst. Sci., 20, 2567–2584, https://doi.org/10.5194/nhess-20-2567-2020, 2020.
Julien, P. Y.: Erosion and sedimentation, 2nd Edn., Cambridge University Press, Cambridge, https://doi.org/10.1017/CBO9780511806049, 2010.
Lane, S. N.: Natural flood management, WIREs Water, 4, e1211, https://doi.org/10.1002/wat2.1211, 2017.
Magliano, P. N., Mindham, D., Tych, W., Murray, F., Nosetto, M. N., Jobbagy, E. G., Rufino, M. C., and Chappell, N. A.: Hydrological functioning of cattle ranching impoundments in the Dry Chaco rangelands of Argentina, Hydrol. Res., 50, 1596–1608, https://doi.org/10.2166/nh.2019.149, 2019.
Malcherek, A.: Eine neue, auf der impulsbilanz basierende theorie zur hydraulik des schützes – Ein diskussionsbeitrag, Wasser-Wirtschaft, 5, 40–69, https://doi.org/10.1007/s35147-018-0215-8, 2018.
Metcalfe, P., Beven, K., Hankin, B., and Lamb, R.: A new method, with application, for analysis of the impacts on flood risk of widely distributed enhanced hillslope storage, Hydrol. Earth Syst. Sci., 22, 2589–2605, https://doi.org/10.5194/hess-22-2589-2018, 2018.
Munson, B. R., Okiishi, T. H., Huebsch, W. W., and Rothmayer, A. P.: Fluid Mechanics, 7th Edn., Wiley and Sons, Singapore, ISBN-13 9781118116135, 2013.
Young, P. C. and Beven, K. J.: Data-based mechanistic modelling and the rainfall-flow non-linearity, Environmetrics, 5, 335–363, https://doi.org/10.1002/env.3170050311, 1994.
- Abstract
- Keywords
- Introduction
- The Retention Time Spreadsheet
- Theory and Methods
- Applying the spreadsheet
- Dynamics of the Storage Volumes
- Conclusions
- Code availability
- Data availability
- Author contributions
- Competing interests
- Disclaimer
- Special issue statement
- Financial support
- Review statement
- References