the Creative Commons Attribution 4.0 License.
the Creative Commons Attribution 4.0 License.
 | 18 Apr 2024
Rainfall data augmentation in Northern Italy through daily extremes and the Hershfield factor
Paola Mazzoglio
Ilaria Butera
Pierluigi Claps
The majority of rainfall measurements in the world is at the daily scale, i.e. related to a specific calendar day and measured over fixed 24 h. On these data, daily annual maximum rainfall depths (F-maxima) series are easily obtained. On the other hand, 24 h annual maximum rainfall depths (S-maxima), which refer to a period starting at any instant, are more useful indicators. S-maxima values cannot be less than the F-maxima, and are generally higher. The ratio between these extremes, called Hershfield factor (H), has been studied to move from F-maxima to S-maxima, allowing to take advantage of the relevant amount of information included in historical records of daily extremes. For instance, before 1980, in the Italian Hydrological Yearbooks only a subset (< 50 %) of the rain gauges was equipped with a recording device, from which annual maxima over 1, 3, 6, 12 and 24 consecutive hours can be derived. In this study we investigate the possibility of using F-maxima to complement the S-maxima records related to the Po river basin and the Liguria region (North of Italy). As a first step we retrieved from official databases all the daily rainfall measurements, available over this area, from early 1900 until today and we quality-controlled the measurements. We then computed the annual H for all the stations and all the years where both the F- and S-maxima were available, to obtain data that can be analyzed in their temporal and spatial variability. The spatial distribution of the Hershfield factor shows values similar to the ones suggested in the literature and is related to the geographic position of the stations, allowing the possibility to identify some distinct areas with positive or negative anomalies. The obtained map of the H factor, with interpolated local anomalies, allows to reconstruct the missing S-maxima in stations with only F-maxima, and improve the knowledge of the spatial variability of sub-daily rainfall extremes.
- Article
(2220 KB) - Full-text XML
- BibTeX
- EndNote


UPH 17; field observation; Italy; Po river basin; rainfall; extremes
For decades, several hydrological variables as the rainfall depths were measured on a calendar day basis, usually at 09:00 a.m. local time (Morbidelli et al., 2021). In Italy, those daily measurements are published in the Hydrological Yearbooks, a collection of data usually available only in printed format. The availability of shorter duration records was limited by the requirement of continuous monitoring rainfall gauges. After the replacement of the mechanical rain gauges with the automatic ones in the last decades of the 20th century, the reference time for the calendar day rainfall measure was shifted to 00:00 a.m. However, the daily measurement approach was never ended, even if it is widely known that such discretization in time leads to bias when dealing with extreme events (Papalexiou et al., 2016). Considering the vast heritage of measurements and its simplicity, the majority of annual maximum rainfall depths in the world are at the daily scale, i.e. expressed over fixed 24 h (F-maxima).
It is clear, however, that sliding 24 h maxima obtained from continuous measurements (S-maxima) are more useful values. They refer to 24 h periods starting at any instant and cannot be less than the F-maxima. An analysis conducted over the United States proved that the S-maxima statistics like the median, the mean and the standard deviation are higher than those of F-maxima and have a greater dispersion; the difference between the F- and S-maxima statistics increases as the time interval increases and appears to become constant for time scales larger than 36 h (Papalexiou et al., 2016).
The ratio between F- and S-maxima, named Hershfield factor (H), has been suggested to correct the incongruences induced by the different time discretization, allowing to take advantage of the relevant amount of information included in historical records of F-maxima (Hershfield, 1961; Harihara Ayyar and Tripathi, 1973; van Montfort, 1990; Dwyer and Reed, 1995; van Montfort, 1997; Papalexiou et al., 2016; Llabrés-Brustenga et al., 2020).
H acts as a multiplier that aims at correcting the underestimation caused by the daily time sampling. Hershfield itself suggested to use a value equal to 1.13 after an analysis carried out using data covering the United States (Hershfield, 1961). In a recent analysis in the United States, Papalexiou et al. (2016) obtained a value equal to 1.14. An application over India suggested a value equal to 1.15 (Harihara Ayyar and Tripathi, 1973). Over China, van Montfort (1997) obtained values in the range 1.04–1.17. Dwyer and Reed (1995) suggested a mean value of 1.16, while proposing differences according to different regimes: a correction factor of 1.15 for rainfall regimes with more frequent short-duration concentrated events, and 1.17 for sites with rainfall regimes with more frequent longer events, such as those produced by large frontal systems. Llabrés-Brustenga et al. (2020) obtained a mean value of 1.125 over Catalonia (Spain) and highlighted considerable variations within the year: summer is the season in which lower H (1.093) was obtained, justified by the fact that rainfall is often raised by the influence of the diurnal cycle and the S-maxima are not usually split by daily measuring in the morning; in spring, a higher H (1.161) was obtained, possibly determined by the fact that rainfall events are more often split when F-maxima measurements are taken at 08:00 a.m.
All these studies (except Papalexiou et al., 2016 and Llabrés-Brustenga et al., 2020) are based on old records. In our study, we investigated the possibility of using ≈1000 stations with at least 10 years of both F- and S-maxima for the same years, covering the period from early 1900 until today, to enrich the availability of S-maxima rainfall measurements, by selecting the data-rich Po river basin and the Liguria region (North of Italy) as a case study. The objective is to obtain mean values of H for the stations where both F- and S-maxima data are available and make these value available, through spatial interpolation, to F-maxima stations where S-maxima data are unavailable.
2.1 Area of interest
In this study we analysed an area of about 90 000 km2 extent located in the North of Italy, that coincides with the Po river basin and the Liguria region. The different administrative regions included in this area and the elevation data are represented in Fig. 1.
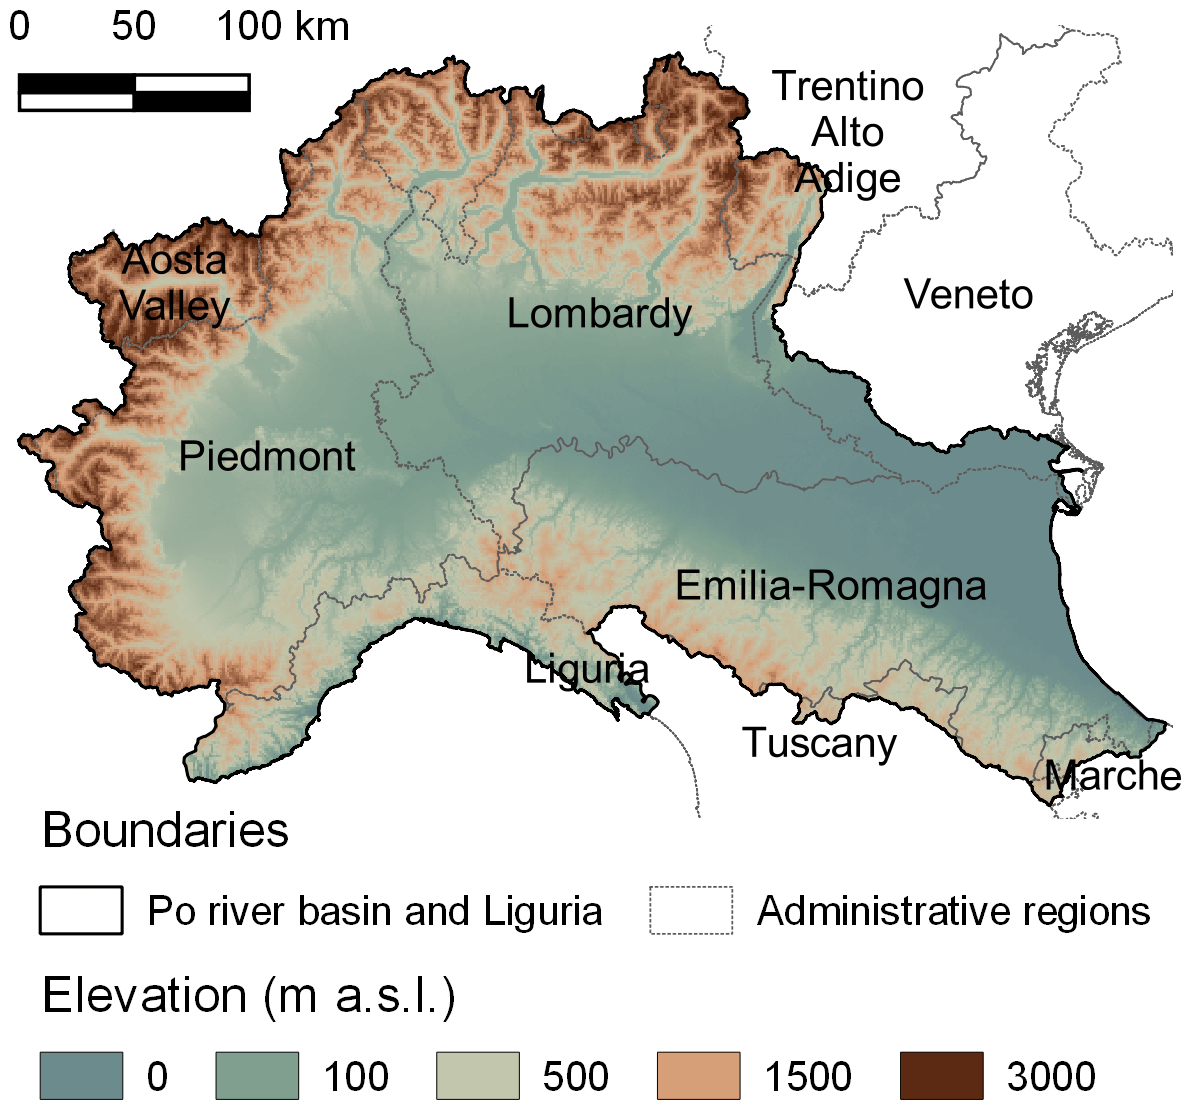
Figure 1Elevation data with borders and names of the administrative regions. Source: Shuttle Radar Topography Mission (Farr et al., 2007).
2.2 Validated S- and F-maxima datasets
Annual maximum rainfall depths related to a 24 h time interval (i.e., the S-maxima) are derived from the Improved Italian – Rainfall Extreme Dataset (I2-RED; Mazzoglio et al., 2020), a collection of rainfall extremes recorded since 1916 by more than 5200 rain gauges installed all over Italy. In this analysis we used only the time series of the 1713 rain gauges installed in the study area.
A set of validated F-maxima (i.e., quality-controlled daily annual maxima published in a dedicated table of annual maxima) is available in digital format from: ARPA Piemonte for the years 1988–2018 (ARPA Piemonte, 2022), the Functional Center of the Autonomous Aosta Valley Region for the years 1994–2016 (Centro Funzionale Regione Autonoma Valle d'Aosta, 2022), the VAPI Piemonte project for the years 1913–1986 (Villani, 2003), Meteotrentino for the years 1921–2009 (Meteotrentino, 2022) and ARPA Veneto for the years 1984–2021 (ARPA Veneto, 2022).
2.3 Continuous time series datasets
The spatio-temporal coverage of the validated datasets (Fig. 2) is very limited with respect to the spatio-temporal coverage of the printed version of the Hydrological Yearbooks. The digitization of the Yearbooks tables containing validated F-maxima would require a massive effort, out of the scope of this work. To fill the spatio-temporal gaps caused by missing validated data, we resorted to available historical continuous daily rainfall time series, available in digital format, that are partially uncontrolled. The main data source that we used is the SCIA database (ISPRA, 2022). It has been integrated with few daily time series, coming from: ARPA Piemonte for 1988 onwards (ARPA Piemonte, 2022), the “Banca dati meteoclimatica” of Liguria Region (Regione Liguria and ARPAL, 2022), the “Atlante climatico della Liguria” for the years 1960–2010 (Agrillo and Bonati, 2013) and the Dext3r webapp (ARPAE-SIMC, 2022).
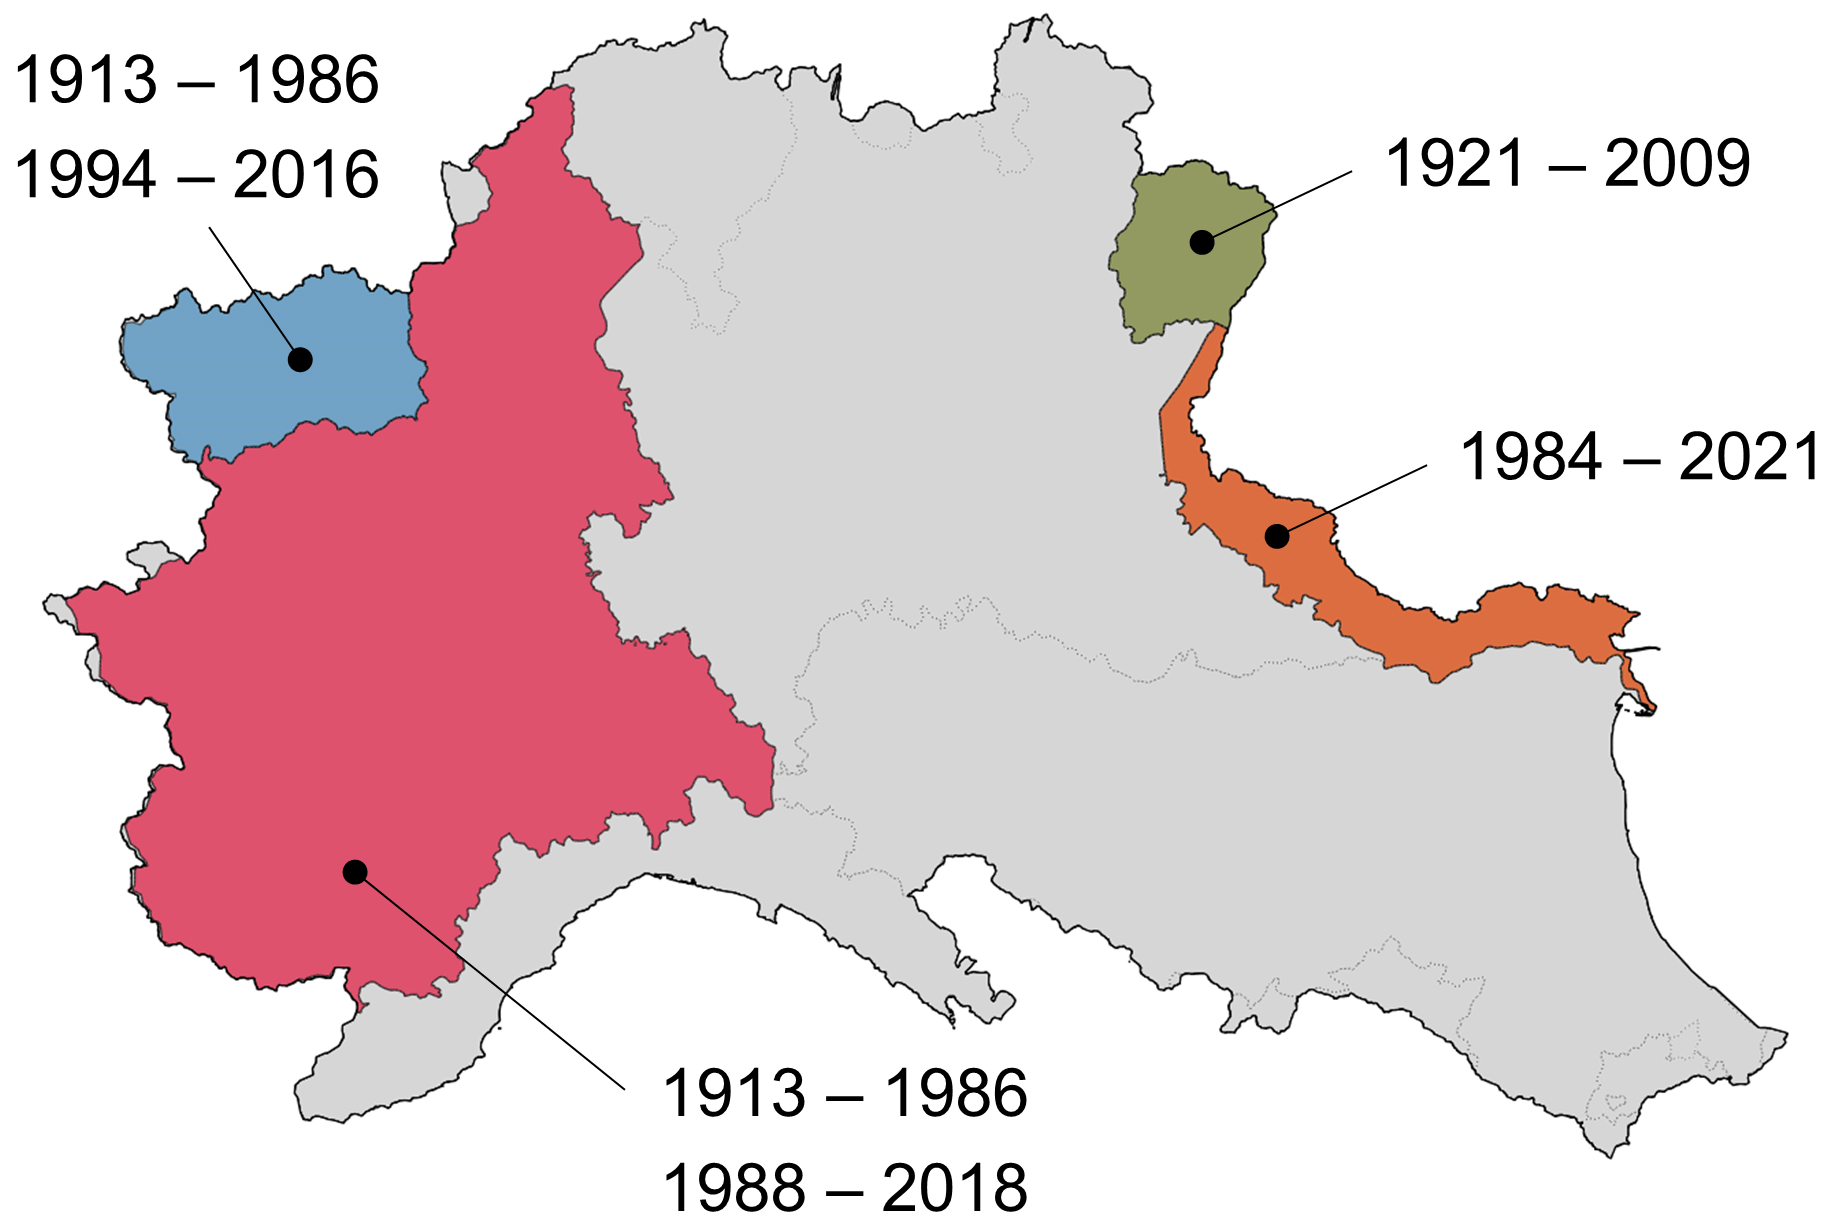
Figure 2Spatio-temporal availability of the validated F-maxima. Grey colour indicates areas where a database of daily annual maxima in digital format is not available.
In this study we did not consider the influence of the change of the time of the daily measurements, because precise and extensive information on the years in which the hydrological agencies started to record the daily measurement at 00:00 a.m. is not available. However, it should be noted that Llabrés-Brustenga et al. (2020) pointed out that very high H is obtained only in the case of F-maxima taken with starting time in the afternoon. They also argue that F-maxima is usually more precise if sampled at 00:00 a.m., even though 08:00 a.m. can be considered as a good sampling time.
All the continuous daily time series of the datasets mentioned before were merged into a unique dataset. The SCIA database was found lacking some of the most relevant daily maxima recorded in recent years in the Liguria region: a manual gap-filling procedure was thus performed after having identified the time series that contains only 1 missing daily data (i.e., the actual F-maxima). In this case, the missing measurement (that was probably removed by too strict quality-control procedure applied while building the SCIA dataset) was retrieved from the printed version of the Hydrological Yearbooks or from ARPA Liguria website. Afterwards, to verify the correctness of the continuous daily data, high precipitation values (greater than 500 mm) were manually controlled, to verify if they were realistic. In a few cases, these high values were removed, because caused by a mistake with decimals in the table.
After this merging and control operations, only continuous time series with at least 330 out of 365 daily measurements were used to compute the annual F-maxima. These were integrated with the already validated F-maxima.
2.4 Final datasets
The data merging procedure allowed us to reach a total of about 1000 stations with at least 10 years of both F- and S-maxima for the same years. Nevertheless, the total number of F-stations is significantly higher: in this region, 2149 stations with F-maxima are available, allowing to have a data density of 1 rain gauge every 42 km2 (the data density of the sub-daily time series is of 1 rain gauge every 53 km2). In Fig. 3 it is possible to observe the spatial distribution of the F- and S-maxima. From the figure one can realize that the data density is not uniform: even including the F-maxima, several locations in the lowlands or at high elevations are still poorly sampled.
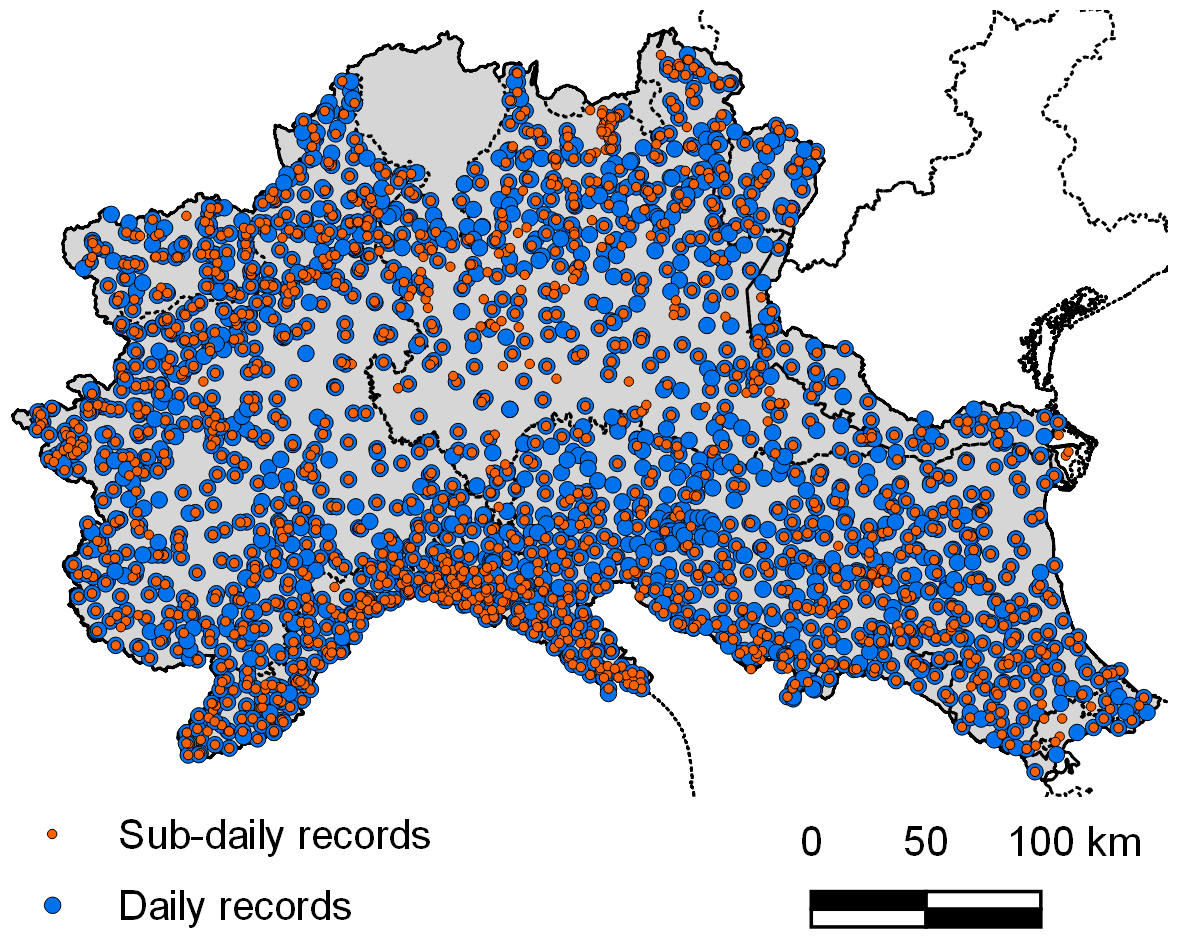
Figure 3Spatial distribution of the sub-daily and daily records. Source: I2-RED data (Mazzoglio et al., 2020).
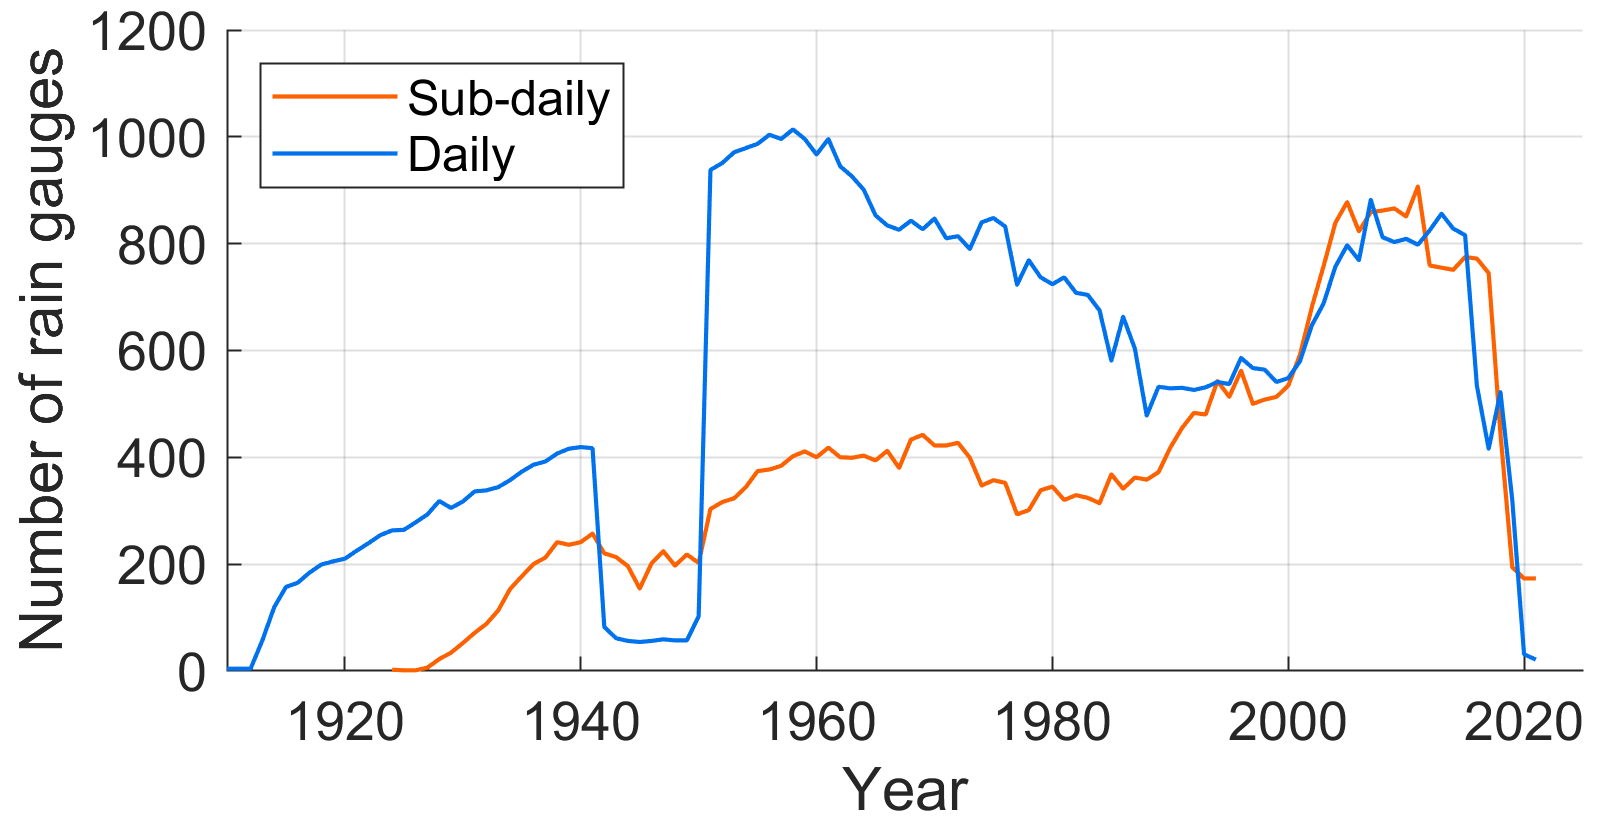
In Fig. 4 it is possible to see the time history of the available stations. From this figure it clearly emerges that, for instance, before 1980 only a subset (<50 %) of the rain gauges was equipped with a continuous recording device.
For all the stations and all the years where both the F-maxima and S-maxima are available, the Hershfield factor was computed according to its definition:
where h24 is the 24 h annual maximum and hg is the daily maximum in a given year.
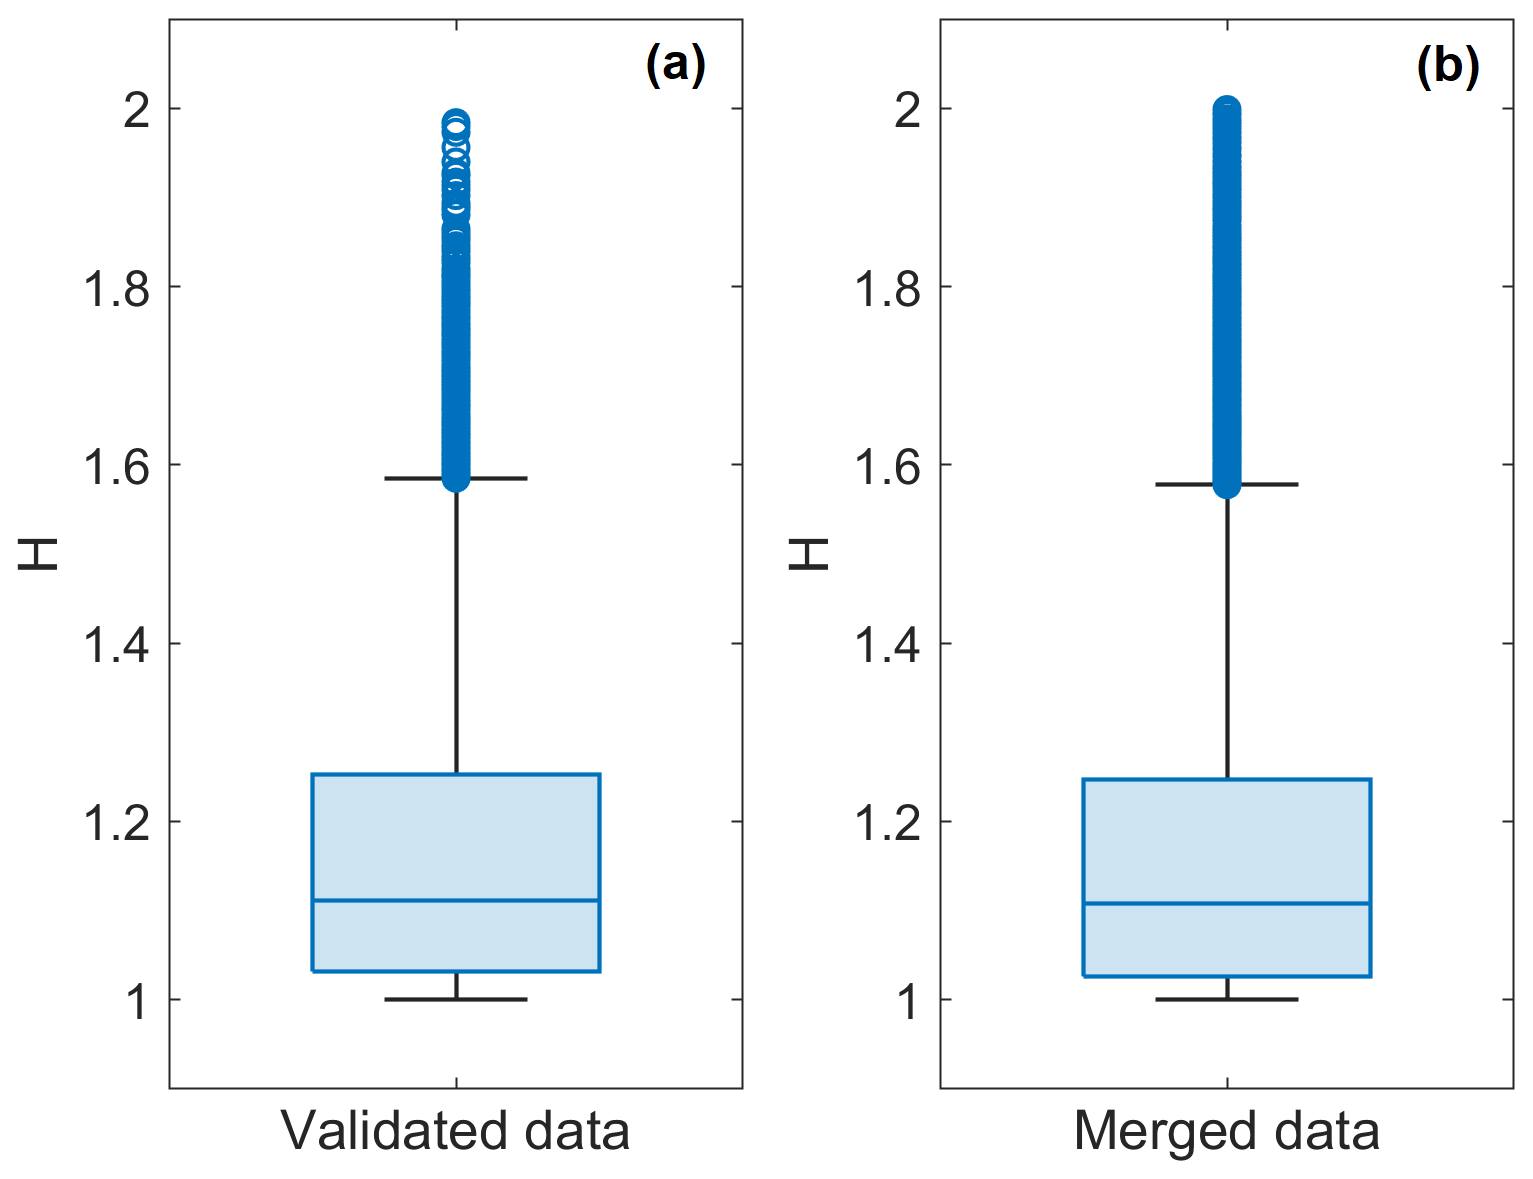
Figure 5Box plot of the yearly Hershfield factors computed using the validated data (a) and from the merged dataset (b). Each box plot displays the following information: the median, the lower and upper quartiles (blue box), any outlier (values that are more than 1.5 times the interquartile range, depicted as a blue circle), and the minimum and maximum values that are not outliers (black whiskers).
As a general rule, (van Montfort, 1997). It can be equal to 1 if the S-maxima occurred inside the same calendar day, while it can be equal to 2 if the extreme event is equally divided into two days.
In a first step, we analysed H using only the validated data, whatever the record length, to obtain reliable results that would be compared to those obtained using the entire dataset.
Even in validated data we found cases in which F-maxima were higher than S-maxima. This inconsistency is not unusual, and can be attributed to errors in the digitization, due to the manual daily recording. These occurrences, and the others in which we found H>2, were removed. Figure 5a shows the box plot of the individual H values obtained year by year: the overall median H is 1.112, while the whiskers ends are, respectively, 1 and 1.585. The overall mean value obtained for H is 1.170, somewhat higher than those in the literature.
Having removed only the undeniable anomalies (H<1 or H>2) does not exclude the possibility that other anomalies may have occurred. We then used the limits of the box plot to filter out possible outliers in the process of extending the computation to the entire dataset. Therefore, when computing the H values for all the stations using the entire dataset, made of validated and not validated data, we used series with at least 10 years of data and we used the whiskers ends of the validated data (1 and 1.585) as thresholds to remove the outliers. After this computation, the median H resulted of 1.144 and the mean resulted equal to 1.146, which are in line with the values reported in the literature. By increasing the minimum record length to 20 years we obtained an average of H equal to 1.142, and a median equal to 1.141, suggesting that even a time series of only 10 years could provide reliable estimates.
Examinig the box plots in Fig. 5 one can recognize that the variability of the H computed from the entire dataset turns out to be similar to the one of the validated data, despite a higher number of outliers. This evidence confirms the suitability of using also non-validated data to guarantee an higher spatio-temporal coverage of F-maxima.
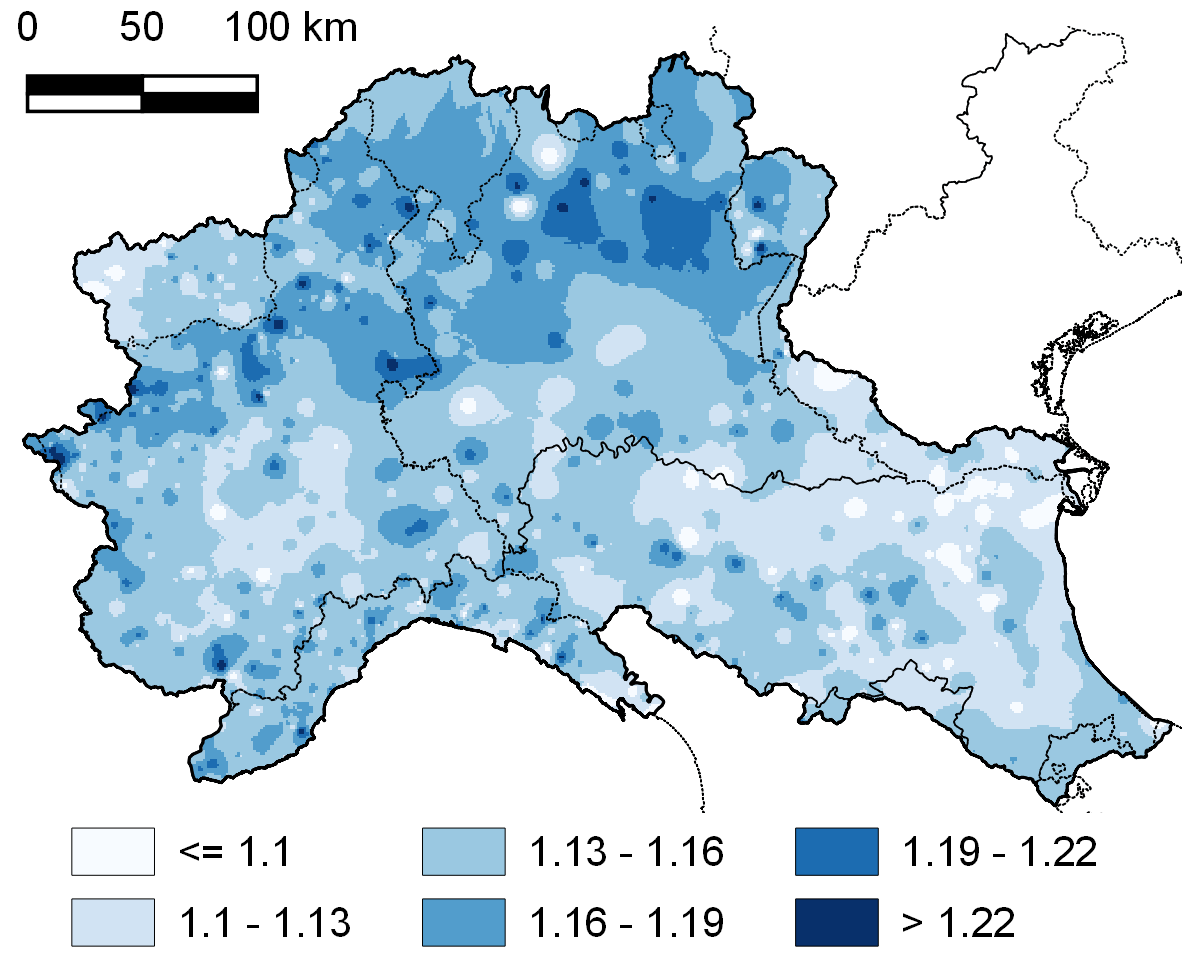
Figure 6Spatial distribution of the Hershfield factor obtained by applying and Ordinary Kriging with spherical variogram.
After the computation and validation of the H values in the so-reached ∼ 1000 stations, we proceeded to a spatial interpolation at 1 km resolution of the mean H. This procedure was realized using the Ordinary Kriging (Fig. 6). By analyzing the spatial distribution of the interpolated Hershfield factor within the study area, we found variability patterns similar to those available in the literature, i.e. the mean (at station) H values turn out to be non uniform over the space. They seem influenced by the geographic position of the stations, and the patterns entail the possibility to identify some distinct areas with a positive or negative anomaly with respect to the spatial average. More specifically, higher values emerge in the Northern part of the examined region, mainly in Piedmont and Lombardy. The Aosta Valley, despite its location in the northern parts, shows different anomalies. This difference could probably be addressed to different prevailing rainfall mechanisms occurring in the Aosta Valley, possibly due to the presence of high peaks at the borders between Piedmont and the Aosta Valley, which act as a barrier. An influence of the geographic position was also pointed out over Catalonia (Spain) by Llabrés-Brustenga et al. (2020), and over China, where van Montfort (1997) analyzed monthly H values in relation to the location of the station, the autocorrelation within its daily measurements and the fraction of wet days.
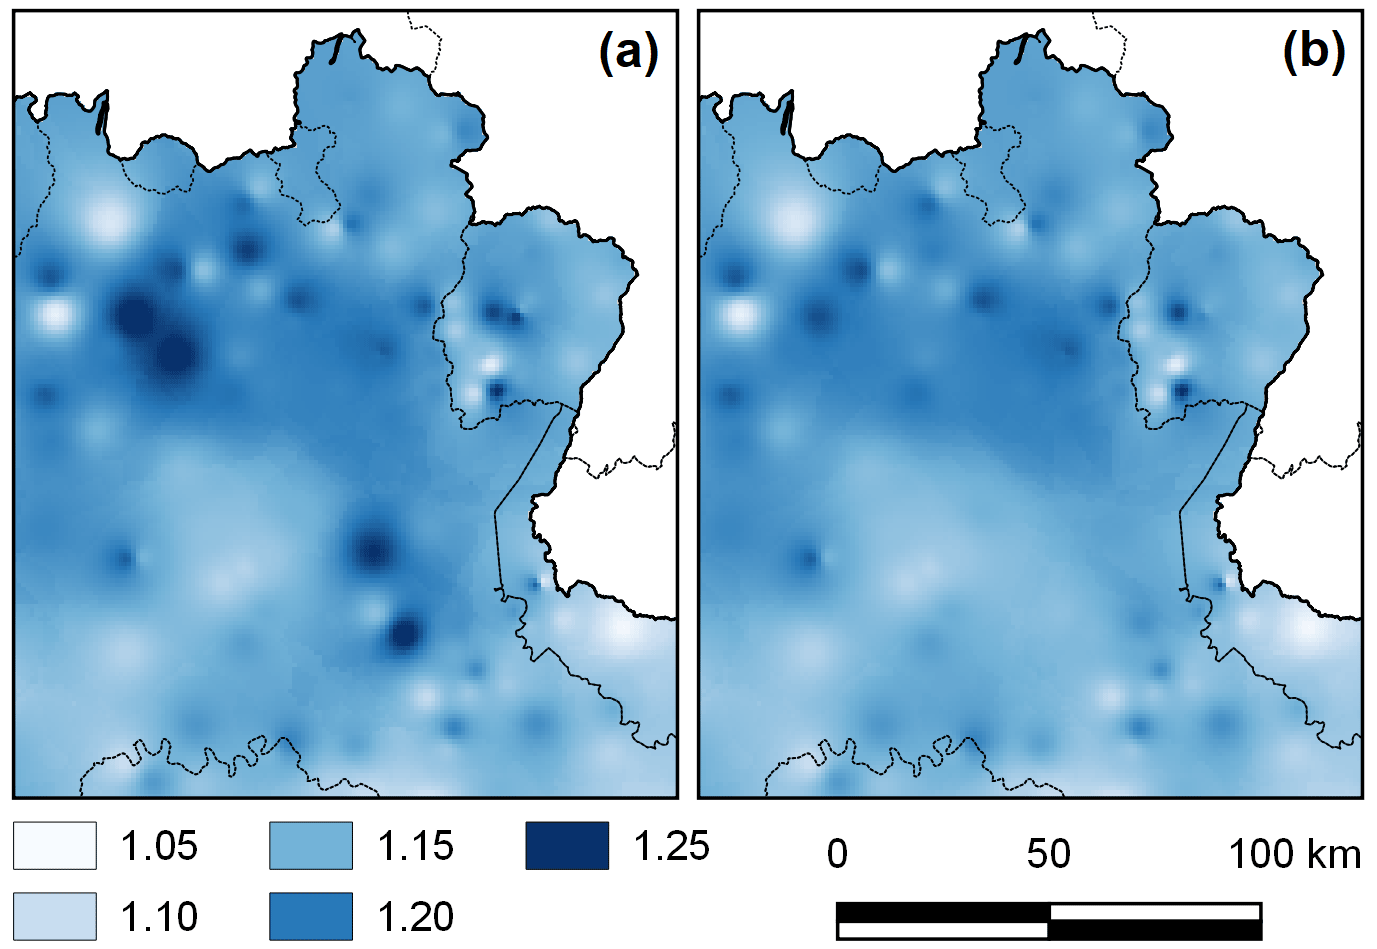
Figure 7Spatial distribution of the Hershfield factor before (a) and after (b) the site-specific data-cleaning operation. Focus over the Eastern part of Lombardy region.
The exam of the spatial distribution of H has suggested the necessity to perform an additional data control, as some suspicious isolated anomalies clearly emerged (Fig. 7a). This happened especially in areas where official and quality-controlled annual maxima were not available, so that F-maxima were computed from continuous daily records. For these isolated “peaks” of H, the F-maxima time series of the rain gauges have been checked and the incorrect F-maxima data have been replaced using the values reported in the printed version of the Hydrological Yearbooks, as depicted in Fig. 7b. Note that Fig. 6 already report the fully corrected version of the map.
To increase the spatial detail of the extremes of precipitation over the North of Italy, a consistent database including daily precipitation (F-maxima) can be used. The analysis of the ratio between 24 h and daily extremes (Hershfield factor) throughout the investigated area can allow to estimate annual S-maxima (i.e. over 24 h) in the stations that lack this information. In some areas (mountain regions and the lowlands between Piedmont and Lombardy) the increase in detail is noteworthy, and can provide important improvement over the spatial analysis of 24 h extremes.
Before proceeding with the use of these reconstructed data, some care must be exerted about the reliability of these newly-computed maxima. In these terms, it is worth mentioning that Koutsoyiannis and Iliopoulou (2022) pointed out that there is no theoretical basis behind the “inflation” through the Hershfield factor, even though it can represent an acceptable estimate from an engineering point of view. The authors pointed out that all realizations are stochastically equivalent and there is no theoretical basis for their correction. By correcting the series, its stochastic properties can be distorted.
In terms of series properties, indeed, Papalexiou et al. (2016) had previously noted that the ratios between the mean values of F- and S-maxima deviate from the standard deviation ratios: this implies that the application of the H factor cannot appropriately preserve the standard deviation of the F-maxima. These authors have then introduced an approach that simultaneously correct both the mean and the standard deviation errors.
Despite the caveats, however, we cannot ignore that the possibility to include data recorded in decades at the beginning of the past century (see Fig. 4) can produce relevant benefit in the spatial detail of the process. This suggests us to proceed with the application of the H factor to include the F-maxima in the existing 24 h records.
On the other hand, when looking for trends in the data, to protect the reconstructed data from the distortion mentioned by Koutsoyiannis and Iliopoulou (2022) robust methods can be used, as Sen's method, the non-parametric Mann-Kendall test and the Spearman rank correlation test that all exhibit negligible sensitivity to data distortion (Morbidelli et al., 2021).
In this work and in all the other ones cited in this paper the H values were considered as constant over time. Nevertheless, future works could be directed to investigate if the variations observed all over Italy in the 24 h extremes (Mazzoglio et al., 2022) can be detected also in the H values.
In this study we performed a complex data merging operation to recover all the F-maxima recorded starting from the 20th century by 2149 stations. This dataset was then used to evaluate the Hershfield factor, that is a coefficient computed as the ratio between the S-maxima and the F-maxima that can be relevant for the reconstruction of missing sub-daily annual maxima. The interpolation realized, reported with a map in Fig. 6, allows to reconstruct the missing S-maxima in stations with only F-maxima, and improves the knowledge of the spatial variability of sub-daily rainfall extremes.
In view of the extension of this data-recovering procedure to the entire Italy, further investigations are to be directed to the correction of distortion effects noted in the statistical properties of the reconstructed series. In that sense, it is important to consider the trade-off between the increase of uncertainty on the 24 h series properties and the increase in the spatial detail of S-maxima in data-scarce regions.
The daily time series can be downloaded from the original repositories. Full credits are reported in Sect. 2.
The 24 h rainfall data were obtained from the I2-RED database. Although Italian law requires an open-source policy for all public data, this right has not yet been implemented by all the Italian agencies involved in the management of the rain gauge network. The agreements we signed with some of these agencies, aimed at monitoring the correct use of the data, restricted their use to the aims of the authors' project. As a result of these legal restrictions, a complete version of I2-RED can only be provided to two groups of people: members of the authors' research group (who are already fully authorized to use the data) and people who can prove they have received clearance from the regional authorities. The entire quality-controlled database is available on Zenodo (https://doi.org/10.5281/zenodo.4269509, Mazzoglio et al., 2020), albeit with restricted access. The data can be used by third parties, for an indefinite timeframe, upon having completed an agreement with the authors and with the regional agencies involved in the data collection. The raw data availability depends on the region: a complete description of how to access these data is reported in Mazzoglio et al. (2020).
PC, IB and PM designed the experiments and PM carried them out. PM performed the data merging operation and developed the code. PM prepared the manuscript with contributions from all co-authors.
The contact author has declared that none of the authors has any competing interests.
Publisher’s note: Copernicus Publications remains neutral with regard to jurisdictional claims in published maps and institutional affiliations.
This article is part of the special issue “IAHS2022 – Hydrological sciences in the Anthropocene: Variability and change across space, time, extremes, and interfaces”. It is a result of the XIth Scientific Assembly of the International Association of Hydrological Sciences (IAHS 2022), Montpellier, France, 29 May–3 June 2022.
The authors acknowledge the regional agencies involved in the management of the rain gauge networks that provided the rainfall measurements included in I2-RED. Full credits are reported in Mazzoglio et al. (2020).
This paper was edited by Christophe Cudennec and reviewed by two anonymous referees.
Agrillo, G. and Bonati, V.: Atlante climatico della Liguria, ARPAL – Centro Funzionale Meteoidrologico di Protezione Civile, 127 pp., https://www.arpal.liguria.it/contenuti_statici//clima/atlante/Atlante_climatico_della_Liguria.pdf (last access: 3 April 2023), 2013.
ARPAE-SIMC: Dext3r, ARPAE-SIMC [data set], https://simc.arpae.it/dext3r/, last access: 25 April 2022.
ARPA Piemonte: Banca dati meteorologica, ARPA Piemonte [data set], http://www.arpa.piemonte.it/rischinaturali/accesso-ai-dati/annali_meteoidrologici/annali-meteo-idro/banca-dati-meteorologica.html (last access: 3 April 2023), 2022.
ARPA Veneto: Dati delle precipitazioni di massima intensità, ARPA Veneto [data set], https://www.arpa.veneto.it/bollettini/storico/precmax/ (last access: 3 April 2023), 2022.
Centro Funzionale Regione Autonoma Valle d'Aosta: Dati osservati del Centro Funzionale RAVDA, Centro Funzionale Regione Autonoma Valle d'Aosta [data set], https://presidi2.regione.vda.it/str_dataview_download (last access: 3 April 2023), 2022.
Dwyer, I. J. and Reed, D. W.: Correcting mean annual maxima for data discretization, Preprints 6th Int. Meet. on Statistical Climatology, Galway, Ireland, 447–450, http://imsc.pacificclimate.org/proceedings/6IMSC.pdf (last access: 3 April 2023), 1995.
Farr, T. G., Rosen, P. A., Caro, E., Crippen, R., Duren, R., Hensley, S., Kobrick, M., Paller, M., Rodriguez, E., Roth, L., Seal, D., Shaffer, S., Shimada, J., Umland, J., Werner, M., Oskin, M., Burbank, D., and Alsdorf, D.: The Shuttle Radar Topography Mission, Rev. Geophys., 45, RG2004, https://doi.org/10.1029/2005RG000183, 2007.
Harihara Ayyar, P. S. and Tripathi, N.: Relationship of the clock-hour to 60-min and the observational day to 1440-min rainfall, Ind. J. Meteorol. Geophys, 24, 279–282, 1973.
Hershfield, D. M.: Technical Paper No. 40: Rainfall frequency atlas of the United States, Department of Commerce, Weather Bureau, Washington, DC, 1961.
ISPRA: SCIA Sistema nazionale per l'elaborazione e diffusione di dati climatici, ISPRA [data set], http://www.scia.isprambiente.it/wwwrootscia/Home_new.html# (last access: 3 April 2023), 2022.
Koutsoyiannis, D. and Iliopoulou, T.: Ombrian curves advanced to stochastic modeling of rainfall intensity, in: Rainfall, edited by: Morbidelli, R., Elsevier, 261–284, https://doi.org/10.1016/B978-0-12-822544-8.00003-2, 2022.
Llabrés-Brustenga, A., Rius, A., Rodríguez-Solà, R., and Casas-Castillo, M. C.: Influence of regional and seasonal rainfall patterns on the ratio between fixed and unrestricted measured intervals of rainfall amounts, Theor. Appl. Climatol., 140, 389–399 https://doi.org/10.1007/s00704-020-03091-w, 2020.
Mazzoglio, P., Butera, I., and Claps, P.: I2-RED: a massive update and quality control of the Italian annual extreme rainfall dataset, Water, 12, 3308, https://doi.org/10.3390/w12123308, 2020.
Mazzoglio, P., Ganora, D., and Claps, P.: Long-term spatial and temporal rainfall trends over Italy, Environmental Sciences Proceedings, 21, 28, https://doi.org/10.3390/environsciproc2022021028, 2022.
Meteotrentino: Dati storici, Meteotrentino [data set], https://www.meteotrentino.it/#!/content?menuItemDesktop=111 (last access: 3 April 2023), 2022.
Morbidelli, R., Saltalippi, C., Dari, J., and Flammini, A.: A review on rainfall data resolution and its role in the hydrological practice, Water, 13, 1012, https://doi.org/10.3390/w13081012, 2021.
Papalexiou, S. M., Dialynas, Y. G., and Grimaldi, S.: Hershfield factor revisited: Correcting annual maximum precipitation, J. Hydrol., 542, 884–895, https://doi.org/10.1016/j.jhydrol.2016.09.058, 2016.
Regione Liguria and ARPAL: Banca dati meteoclimatica, Regione Liguria [data set], https://www.regione.liguria.it/servizi/item/14279-banca-dati-meteoclimatica.html (last access: 25 April 2022), 2022.
van Montfort, M. A. J.: Sliding maxima, J. Hydrol., 118, 77–85, https://doi.org/10.1016/0022-1694(90)90251-R, 1990.
van Montfort, M. A. J.: Concomitants of the Hershfield factor, J. Hydrol., 194, 357–365, https://doi.org/10.1016/S0022-1694(96)03212-X, 1997.
Villani, P. (Ed.): Rapporto sulla Valutazione delle piene in Piemonte, in: Relazione delle attività del CUGRI fino al 2001, 89–118, Ed. Del Paguro, ISBN 88-87248-35-4, 2003.