the Creative Commons Attribution 4.0 License.
the Creative Commons Attribution 4.0 License.
 | 16 Nov 2021
Studying recent hydroclimatic variability in Madagascar despite deficient measurement networks: use of CHIRPS and GRACE data at the scale of the Mahajunga province
Sylvain Bigot
Dominique Dumas
Télesphore Y. Brou
Rivo Ramboarison
Samuel Razanaka
Nathalie Philippon
Given the lack of in situ hydroclimatic measurements and networks in Madagascar, the GRACE (2003–2016) spatial gravimetry data, combined with other satellite data such as CHIRPS rainfall estimates or fire monitoring using GFED products, make it possible to establish an interannual assessment of certain climatic and environmental covariations at the northwest scale of the country. The results show a negative trend in continental rainfall and water content, especially after 2007, but also a time lag in the linear variations and trends of the Water Equivalent Height as well as the number of detected fires (variable indirectly measuring the pressure of deforestation by slash and burn agriculture).
- Article
(3110 KB) - Full-text XML
- BibTeX
- EndNote


The intensification of hydroclimatic risks requires the Malagasy authorities to adapt their national rural and urban development strategies and to be able to implement resilience policies. Especially since, at the same time, the island has been affected for several decades by intense deforestation which fundamentally modifies bio-geophysical and ecosystemic processes. Depending on these threats, Madagascar therefore urgently needs reliable hydroclimatic diagnostics for its many national socio-environmental issues (e.g., agriculture, water resources, biodiversity, and health situation). Despite the objectives of strengthening hydrometeorological measurement services and an adequate institutional framework in Madagascar, the national network and infrastructure remain deficient. With a surface area of 587 295 km2 (i.e. the 5th largest island in the world), the country currently has only 28 operational meteorological stations listed by the WMO. The hydrological network is in a similar state of obsolescence, and the flows of the large Madagascar rivers are no longer monitored continuously. The national hydroclimatic balances are generally based on imprecise, old (Chaperon et al., 1993) and anisotropic estimates that do not allow for a effective study of regional or intra-seasonal variations, which are decisive for the many Madagascar environmental problems (Bigot et al., 2018).

Figure 1(a) Location of the Betsiboka river catchment area (in blue) and the Boeny region (in grey). (b) Zoom on the Boeny region and the regional hydrographic network (data from HydroRIVERS 1.0 database). (c) Zoom on the Betsiboka River delta and Bombetoka Bay (TerraMetric image 2020, from © Google Maps).
An alternative solution for studying hydroclimatic variability is the use of satellite estimates. The data used here to analyze rainfall variations and soil water storage are CHIRPS (Climate Hazards Group InfraRed Precipitation with Station data) and GRACE (Gravity Recovery And Climate Experiment) data. The study focuses on the Boeny region (Fig. 1), in the province of Mahajanga (in the northwest of the country) where knowledge of the seasonal evolution of water resources is lacking, but crucial for socio-economic purposes. Given the water resources in the Betsiboka River (605 km, about 49 000 km2), the largest river in Madagascar, this region is considered the 'water tower' of the agricultural plain of Marovoay (located just downstream), the second largest rice growing area in Madagascar. But intense deforestation of the dry forests has considerably modified the water supply by accentuating the runoff during the rainy season, and by decreasing the regulating effect of the soils on the runoff.
The soils, deprived of the protection of the forest cover, are subject to very high erosion, which causes silting of the rice plots, and in turn contributes to deforestation for access to other arable land. This river catchment contributes to laterite and sediment transport from the uplands to its mouth in Bombetoka Bay and the Mozambique Channel (Fig. 1), with an estimated mean annual flow of 271 m3 s−1 and seasonal variations ranging from 400 to 4500 m3 s−1 at the watershed scale (Duvail et al., 2017), given the uncertainties due to the lack of recent in situ observations. Interannual classifications from remote sensing show that the total area occupied by the delta wetland was about 200 km2 in 1973, increasing to 765 km2 in 1989 and 1600 km2 in 2000, an increase of 800 % (Raharimahefa and Kusky, 2010).
The main objective of the study is to compare the interannual variations of precipitation analyzed with CHIRPS data to the hydrological time series of GRACE over the period 2003–2016. The challenge is to better define their correlation, which would eventually allow to use them to better determine and calibrate some uses of hydro- or agro-climatic modeling that are currently unavailable or deficient in terms of in situ data in Madagascar.
A secondary objective is also to analyze the time lag between rainfall–hydrological variations analyzed through CHIRPS and GRACE data, and the number of fires detected by satellite (which is a direct indicator of deforestation).
2.1 GRACE data (2003–2016)
2.1.1 Origin and interest in hydroclimatology
The GRACE satellite mission is a joint project between the National Aeronautic and Space Administration (NASA, USA) and the Deutschen Zentrum für Luftund Raumfahrt (DLR, Germany): http://grace.jpl.nasa.gov (last access: 29 November 2019). Launched into orbit on 17 March 2002, GRACE consists of two twin co-orbital and microwave telemetry interconnected satellites, flying in nearly identical polar orbits with an inclination of 89.5∘ and at an altitude of 500 km, with the instrumental binomial approximately 220 km apart (NASA, 2004). The GRACE mission ended on 12 October 2017 due to a power outage. The new GRACE-FO (Follow-On) mission was launched on 22 May 2018 to continue and enhance these acquisitions. The satellites fly over the entire Earth's surface in about 30 d, providing monthly estimates of a global gravity model with a surface spatial resolution of about 380 km.
The accuracy of continental water heights is about 0.7 cm for a drainage area of 400 000 km2, and 0.3 cm for one of 4 000 000 km2 (Swenson et al., 2003). Errors were estimated to be about 40 mm at the equator, decreasing to 15 mm in the polar regions. The main variations in gravity signals are due to changes in the distribution of water, snow and ice stored on Earth. On a continental scale, the analysis of water stocks and the derivation of water balances via GRACE provide a holistic view of total flows within a basin, as it integrates the flow of rivers, but also surface or deep water inflows and outflows. The regionalized experiments identified at the tropical scale are, for example, balances for the Congo, Amazon, Nile and Volta basins, these very large catchment areas being well adapted to the accuracy of GRACE signatures (Ahmed et al., 2014). Work has shown that once filtered, temporal variations in GRACE data acquired over central Africa and up to 10∘ S are essentially controlled by components of the hydrological cycle, especially runoff and recharge (Ahmed et al., 2014). GRACE estimates of land water storage now provide a new assimilation component for the simulation of continental surface models, and can be used, in conjunction with other remote sensing data, to develop operational hydro-climatic services (Dai, 2011; Frappart and Ramillien, 2018; Tapley et al., 2019).
2.1.2 The choice of GRACE Mascon products
Provided free by various distribution organizations: the Goddard Space Flight Center (GSFC: https://earth.gsfc.nasa.gov/geo/, last access: 29 November 2019), the Jet Propulsion Laboratory (JPL: https://grace.jpl.nasa.gov/, last access: 29 November 2019), the Center for Space Research (CSR: http://www2.csr.utexas.edu/grace/, last access: 29 November 2019) or the German Research Centre for Geosciences (GFZ: http://gravis.gfz-potsdam.de/home, last access: 29 November 2019), there are level 1 products (measured geophysical harmonics) and level 2 advanced solutions derived from the raw measurements (gravity fields and products expressed in geoid height or Water Equivalent Height – WEH). The data are used either with the initial spatial resolution of the spherical harmonic solutions, or with regionalized solutions that allow a better estimation of the variance of the water heights without being affected by spectral truncation effects and allow a better geographical localization of the hydrological patterns. In particular, there is the so-called “Mascon” (for “mass concentration”) approach, which recalculates discrete cells from the original data, each with its own gravity signal (Watkins et al., 2015).
However, even if the spatial resolution of the GRACE Mascon data is better (at 1∘ of arc resolution), their fundamental temporal definition is finally close to that defined with the original GRACE data due to the spatial autocorrelation.
2.2 The rainfall estimates CHIRPS
Rainfall variability is analyzed using CHIRPS (Climate Hazards Group InfraRed Precipitation with Station data) data available on a quasi-planetary scale, starting in 1981 with a daily or 10 d resolution. They integrate both satellite data (0.05∘ resolution) and time series of in situ reference stations (Funk et al., 2015). Although not obviously as reliable a measurement as in situ precipitation, and despite the uncertainties inherent in these satellite products, the performance of CHIRPS data is excellent to study environmental processes (Dembélé and Zwart, 2016). The estimates obtained are sufficiently accurate to study tropical rainfall patterns and their intra-seasonal and interannual variability over a multi-decadal temporal depth, particularly in regions with poor meteorological networks, as is typically the case in Madagascar (Bigot et al., 2018).
2.3 Main methodological points
The methodology used is based on a classical descriptive statistical approach, which seeks to identify synchronous and asynchronous linear relationships between the different indicators selected. Two steps are used:
-
the analysis of linear correlations between CHIRPS rainfall series and GRACE hydrological series (WEH: Water Equivalent Height) at Boeny Region scale between January 2003 and December 2016, and from standardized values;
-
the analysis of linear co-variations between these hydroclimatic series and time series of some environmental indicators: the PDSI (Palmer Drought Severity Index; from TerraClimate data) and regional fire count (from Global Fire Emissions Database data); the main objective is to be able to determine if there is a lag between hydroclimatic variations and those theoretically directly related to the risk of drought or fire intensity.
At the global scale, GRACE trends suggest an increase in water storage at high and low latitudes, and rather a decrease at mid-latitudes with drying trends (Tapley et al., 2019). Analysis of the GRACE Mascon (2002–2016) time series at the scale of Madagascar shows a rather different and opposite trend to that of much of Africa, with a generalised decline in Water Equivalent Height – WEH (Fig. 2). The strongest downward trends (>0.6 cm yr−1) are observed on the eastern facade, plains and central reliefs. The upper catchment area of the Betsiboka shows a trend of −0.62 cm yr−1 of the WEH, with values decreasing towards the downstream basin to reach −0.36 cm yr−1.
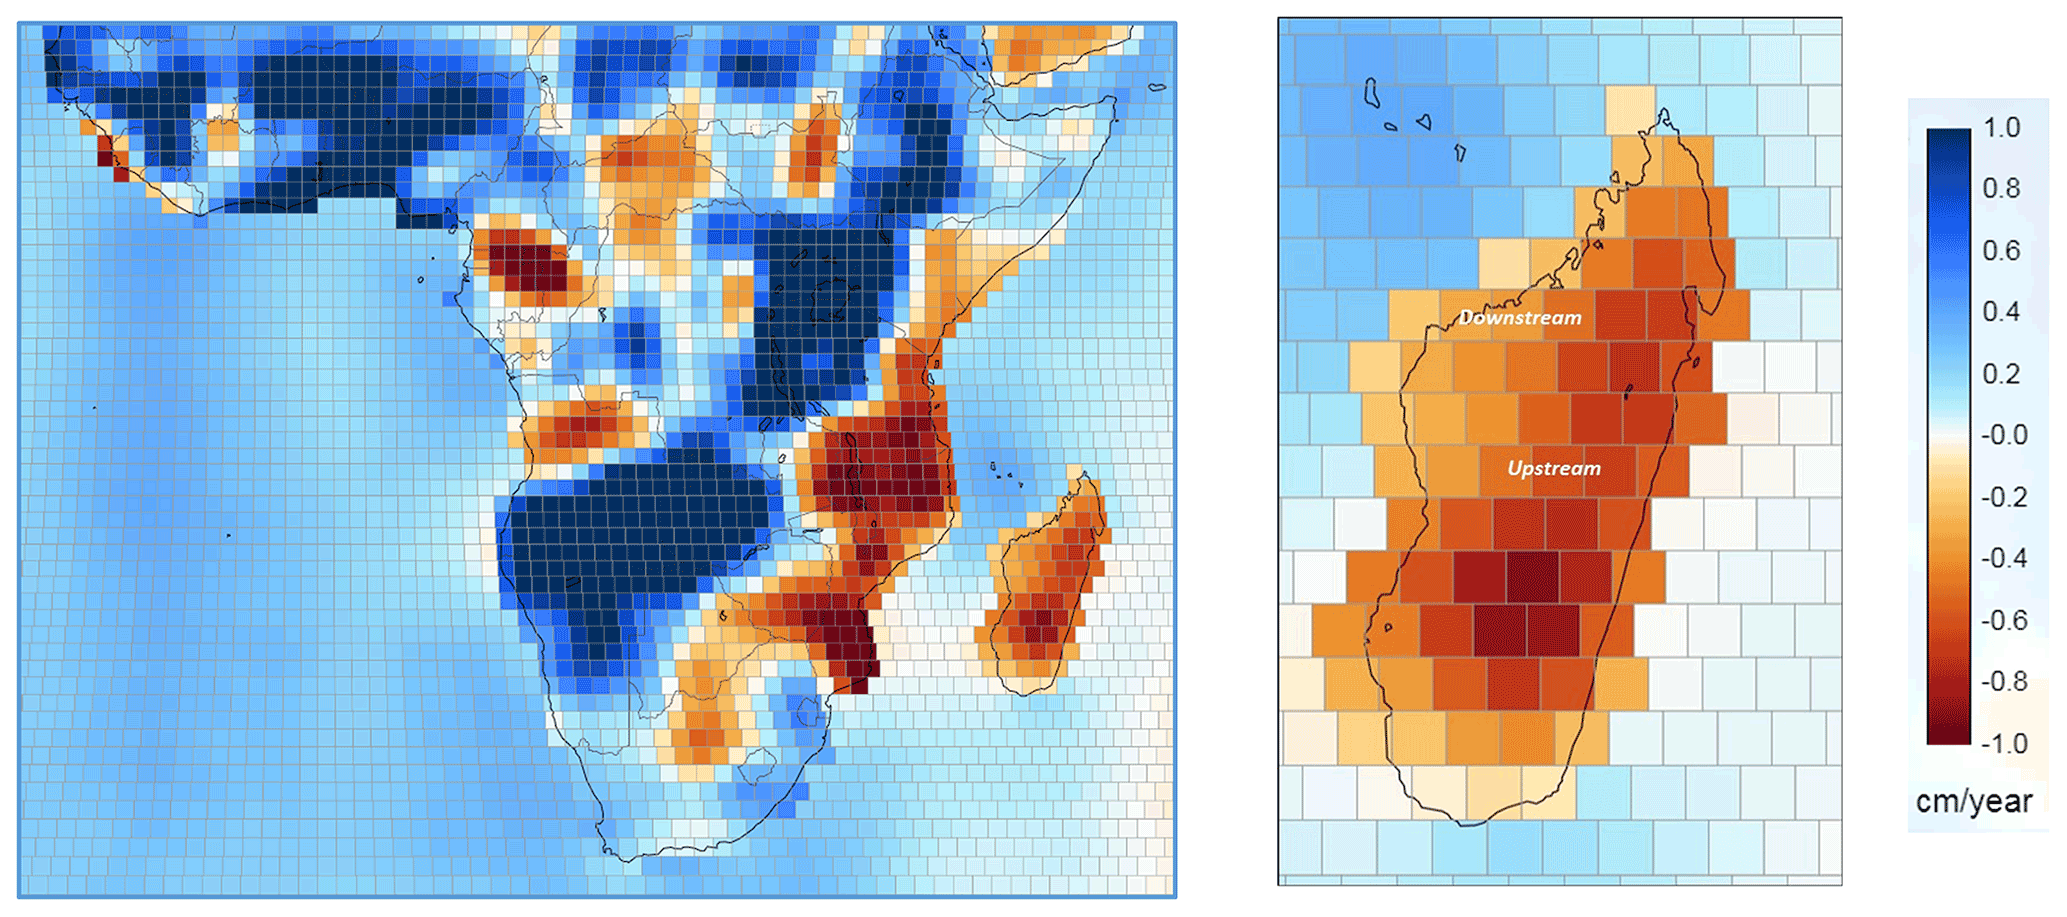
Figure 2Trend (in cm yr−1) of the Water Equivalent Height (WEH) at the spatial resolution of GRACE Mascon cells (∼1∘) over the 2002–2016 period on the African continent scale (left panel) and for a zoom on Madagascar (with the location of the upstream and downstream regions of Betsiboka); adapted from Goddard Space Flight Center and Colorado Center for Astrodynamics Research data.
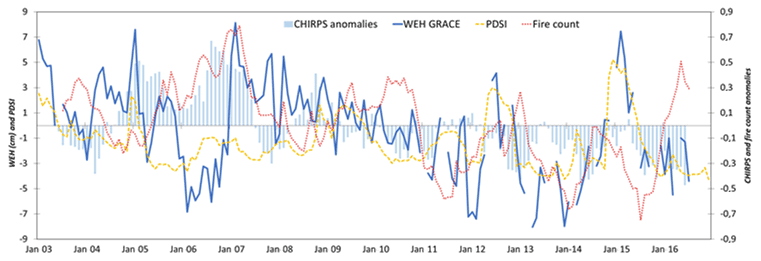
Figure 3Covariations at Boeny Region scale between January 2003 and December 2016 of rainfall anomalies (CHIRPS data, reduced centred values), Water Equivalent Height (WEH, in cm; GRACE Mascon data), PDSI (Palmer Drought Severity Index; TerraClimate data) and regional fire count (Global Fire Emissions Database data).
In Madagascar these hydrological trends are attributed to natural variations, anthropogenic climate change, and human water management and land use practices. Rather, increased precipitation and/or decreased temperatures explain an increase in total water levels (due to reservoir storage and decreased evaporation), and vice versa. However, anthropogenic practices can modulate these variations depending on climate variability, or even reverse the expected evolutions. Goel (2006), for example, showed at the scale of the Congo Basin that the decrease in groundwater levels in a context of stable rainfall would be mainly explained by changes in land use and deforestation that favour runoff to the detriment of infiltration and recharge.
At the scale of the Boeny region, several hydroclimatic and land-use related covariations can be discriminated, by studying synchronous or asynchronous linear correlations (Fig. 3):
-
The CHIRPS time series show a significant negative trend in regional rainfall, especially after 2007 (Bigot et al., 2019), but without having been able to analyze at the same time the hydrological variations.
-
The negative trend in continental water resources transcribed by the GRACE 2003–2016 data is also strong and with a visible break around 2007; but several interannual trends correspond to ocean–atmospheric variations imposed by the Indian Ocean Dipole Oscillation (Bigot et al., 2020). For example, the three positive events in 2006, 2012 and 2015 coincide with a significant increase in precipitation at the scale of the study area, and an increase in gravimetrically estimated water heights in the ground.
-
The Palmer Drought Severity Index (PDSI) from TerraClimate data, based on a rainfall/temperature calculation, reproduces the main variations observed with GRACE, but is much less accurate because it does not take into account continental and regional components (Tapley et al., 2019).
-
As observed in other regional studies and explained by the response of continental mechanisms, there is an increase in linear correlation with a 5 to 6 month lag between rainfall and the variation in moisture and ground storage observed with GRACE (Fig. 4).
-
The interannual evolution of the fire counts, a direct index of agricultural activities, deforestation and land-use changes in the region (Bigot et al., 2019), is calculated over the same period for the study area using satellite data from the Global Fire Emissions Database (GFED) portal. The interannual covariation between rainfall anomalies and fire count is strong but more complex than that evident on a seasonal scale, and the succession between the rainy season and the wildfire season. The most significant correlation (R=0.37) occurs when fires precede hydrological changes by 7 months (Fig. 4), which here seems to suggest that a change in soil moisture content could be the consequence of the number of fires (and thus deforestation and land-use changes) recorded earlier in the year.

Figure 4Synchronous linear correlation (lag 0) and up to an 10-month time lag between CHIRPS precipitation and WEH GRACE monthly variations on the 2002–2016 period (in blue) and between fire count and WEH GRACE (in red); the 99 % significance level is indicated by a dashed line.
This confirms certain elements of Maina et al. (2012) on Madagascar which shows that there is a significant covariance between forest cover, anthropogenic pressure, river flow, sediment load and interannual and seasonal coastal environmental indicators. With this regional example, it is therefore clear that the GRACE data, apart from their evident contribution in hydroclimatology, could also bring some diagnoses in the sensitivity and evolution of Malagasy forest ecosystems.
However, due to the very short analysis period here (14 years), the time links highlighted on a monthly scale must be put into perspective, as they do not have sufficient statistical robustness to be able to determine and validate a stable rainfall/WEH/PDSI/fires empirical model. This would require, on the one hand, the analysis of rainfall over a longer period (e.g. with the CHIRPS data available since 1979); but also, on the other hand, the availability of updated in situ rainfall and hydrological series in Madagascar, in order to validate these remote sensing products.
The contribution of GRACE data allows a more detailed study of hydroclimatic and environmental variations because Madagascar has almost no in situ monitoring network. On the one hand, they allow monitoring and therefore also modelling, the asynchronous consequences of rainfall variations on regional water resources. But more broadly, the GRACE data allow for integrated studies of the relationships between water resource variability and land use change influenced by deforestation and fire use. Of course, a large part of the variance of the components of the water cycle also remains imposed by certain ocean-atmosphere variations in the Indian Ocean or global changes such as the increase in temperatures that impose flow, evapotranspiration, water storage and the seasonal intensity of vegetation fires.
All software codes can be requested from the contact author.
GRACE land data are available at https://doi.org/10.5067/TELND-3AC64 (Landerer, 2021) and Landerer and Swenson (2012), supported by the NASA MEaSUREs Program.
SB conceived of the presented idea and performed the computations and figures. DD and TYB verified the analytical methods and contributed to the final manuscript. All authors provided critical feedback and helped shape the research, analysis and manuscript.
The contact author has declared that neither they nor their co-authors have any competing interests.
Publisher's note: Copernicus Publications remains neutral with regard to jurisdictional claims in published maps and institutional affiliations.
This article is part of the special issue “Hydrology of Large River Basins of Africa”. It is a result of the 4th International Conference on the “Hydrology of the Great Rivers of Africa”, Cotonou, Benin, 13–20 November 2021.
Ahmed, M., Sultan, M., Wahr, J., and Yan, E.: The use of GRACE data to monitor natural and anthropogenic induced variations in water availability across Africa, Earth-Sci. Rev., 136, 289–300, 2014.
Bigot, S., Dumas, D., Brou, Y. T., Ramboarison, R., Razanaka, S., Descroix, L., Philippon, N., and Gwiazdzinski, L.: La difficulté du monitoring climatique à une échelle fine dans une région fortement impactée par la déforestation tropicale: la forêt sèche du parc national d'Ankarafantsika (Madagascar), Publications de l'Association Internationale de Climatologie, 31, 356–361, 2018.
Bigot, S., Dumas, D., Brou, T., Curt, T., and Razanaka, S.: Feux de végétation et conditions pluviométriques à Madagascar (2001–2017), Publications de l'Association Internationale de Climatologie, 32, 169–174, 2019.
Bigot, S., Dumas, D., Brou, T., Ramboarison, R., Razanaka, S., and Philippon N.: Etude hydroclimatique dans le nord-ouest de Madagascar: apport des données satellitaires GRACE, Publications de l'Association Internationale de Climatologie, 33, 121–126, 2020.
Chaperon, P., Danloux, J., and Ferry, L.: Fleuves et rivières de Madagascar, in: Monographies hydrologiques, 10, ORSTOM, Paris, France, p. 874, 1993.
Dai, A.: Characteristics and trends in various forms of the Palmer Drought Severity Index during 1900–2008, J. Geophys. Res., 116, 1–26, 2011.
Dembélé, M. and Zwart, S. J.: Evaluation and comparison of satellite-based rainfall products in Burkina Faso, West Africa, Int. J. Remote Sens., 37, 3995–4014, 2016.
Duvail, S., Hamerlynck, O., Paron, P., Hervé, D., Nyingi, W. D., and Leone, M.: The changing hydro-ecological dynamics of rivers and deltas of the Western Indian Ocean: Anthropogenic and environmental drivers, local adaptation and policy response, C. R. Geosci., 349, 269–279, 2017.
Frappart, D. and Ramillien, G.: Monitoring groundwater storage changes using the Gravity Recovery and Climate Experiment (GRACE) Satellite Mission: A review, Remote Sens., 10, 829–853, https://doi.org/10.3390/rs10060829, 2018.
Funk, C., Peterson, P., Landsfeld, M., Pedreros, D., Verdin, J., Shukla, S., Husak, G., Rowland, J., Harrison, L., Hoell, A., and Michaelsen, J.: The climate hazards infrared precipitation with stations – a new environmental record for monitoring extremes, Scient. Data, 2, 150066, https://doi.org/10.1038/sdata.2015.66, 2015.
Goel, P.: Water pollution: Causes, Effects and Control, 2nd Edn., New Age International Publisher, New Delhi, 432 pp., 2006.
Landerer, F.: TELLUS_GRAC_L3_CSR_RL06_LND_v04, Ver. RL06 v04, PO.DAAC [data set], CA, USA, https://doi.org/10.5067/TELND-3AC64, 2021.
Landerer, F. W. and Swenson, S. C.: Accuracy of scaled GRACE terrestrial water storage estimates, Water Resour. Res., 48, W04531, https://doi.org/10.1029/2011WR011453, 2012.
Maina, J., de Moel, H., Vermaat, J. E., Bruggemann, J. H., Guillaume, M. M., Grove, C. A., Madin, J. S., Mertz-Kraus, R., and Zinke, J.: Linking coral river runoff proxies with climate variability, hydrology and land-use in Madagascar catchments, Mar. Pollut. Bull., 64, 2047–2059, 2012.
NASA: CALIPSO, CloudSat, GRACES: Sciences writers's guide – A guide for reporters to understand the mission and purpose of NASA's satellites, sciences mission directorate, NP-2005-8-709-GSFC, NASA, Greenbelt, MD, USA, 44 pp., 2004.
Raharimahefa, T. and Kusky, T. M.: Environmental monitoring of Bombetoka Bay and the Betsiboka Estuary, Madagascar, using multi-temporal satellite data, J. Earth Sci., 21, 210–226, 2010.
Swenson, S., Wahr, J., and Milly, P. C. D.: Estimated accuracies of regional water storage variations inferred from the Gravity Recovery and Climate Experiment (GRACE), Water Resour. Res., 39, 1223, https://doi.org/10.1029/2002WR001808, 2003.
Tapley, B. D., Watkins, M. M., Flechtner, F., Reigber, C., Bettadpur, S., Rodell, M., Sasgen, I., Famiglietti, J. S., Landerer, F. W., Chambers, D. P., Reager, J. T., Gardner, A. S., Save, H., Ivins, E. R., Swenson, S. C., Boening, C., Dahle, C., Wiese, D. N., Dobslaw, H., Tamisiea, M. E., and Velicogna, I.: Contributions of GRACE to understanding climate change, Nat. Clim. Change, 358, 358–369, 2019.
Watkins, M. M., Wiese, D. N., Yuan, D.-N., Boening, C., and Landerer, F. W.: Improved methods for observing Earth's time variable mass distribution with GRACE using spherical cap mascons, J. Geophys. Res.-Solid, 120, 2648–2671, https://doi.org/10.1002/2014JB011547, 2015.