the Creative Commons Attribution 4.0 License.
the Creative Commons Attribution 4.0 License.
 | 16 Nov 2021
Assessing climate change impact on the hydropower potential of the Bamboi catchment (Black Volta, West Africa)
Tariro Cynthia Mutsindikwa
Aymar Yaovi Bossa
Jean Hounkpè
Seyni Salack
This study evaluates the impact of future climate change (CC) on the hydropower generation potential of the Bamboi catchment (Black Volta) in West Africa using a conceptual rainfall-runoff model (HBV light) and regional climate models (RCMs)–global climate models (GCMs). Two climate simulation datasets MPI-ESM-REMO (CORDEX) and GFDL-ESM2M-WRF (WASCAL) under RCP4.5 were applied to the validated hydrological model to simulate the catchment runoff. Based on reference and future simulated discharges, a theoretical 1.3 MW run of river hydro power plant was designed to evaluate the hydropower generation. Hydrological and hydropower generation changes were expressed as the relative difference between two future periods (2020–2049 and 2070–2099) and a reference period (1983–2005). The climate models' ensemble projected a mean annual precipitation increase by 8.8 % and 7.3 % and discharge increase by 11.4 % and 9.735 % for the 2020–2049 and 2070–2099 periods respectively (for bias corrected data). On the contrary an overall decrease of hydropower generation by −9.1 % and −8.4% for the 2020–2049 and 2070–2099 periods was projected respectively. The results indicate that projected increases in discharge should not solely be considered as leading to an increase in hydropower potential when prospecting climate change impact on hydropower.
- Article
(473 KB) - Full-text XML
- BibTeX
- EndNote


Hydropower is the leading source of renewable energy in West Africa (Hamududu et al., 2012). This source is climate sensitive, while West Africa is a region that is projected to be severely affected by CC (Sylla et al, 2016). Several studies (e.g. Obahoundje, 2015) have already assessed the impacts of CC on water resources in West Africa although not much work was done on its impacts on hydropower potential. Both Oyerinde et al. (2016) and Obahoundje (2015) undertook researches on the potential impact of CC on hydropower generation at the Kainji dam (the Niger Basin) and the Bui dam (Black Volta basin) respectively; and results showed that while CC is projected to decrease the hydropower potential of Bui, the opposite is expected for Kainji.
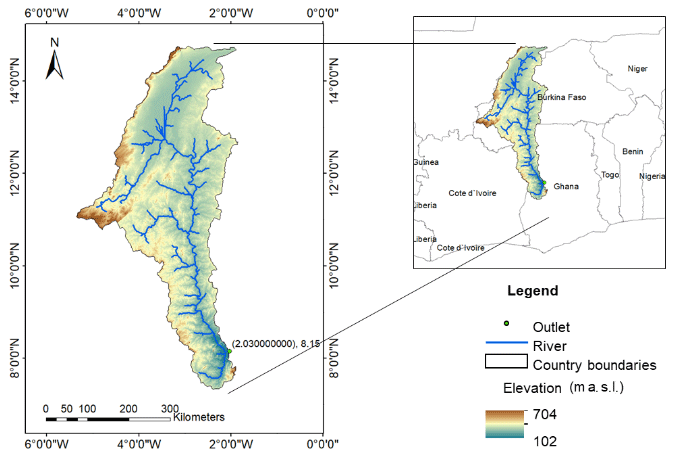
Figure 1Location of the Bamboi catchment.
A strong reduction in the rainfall occurrence has been experienced in the Bamboi catchment (Black Volta) since 1960s, and notably during the 1973/1974 and 1983/1984 droughts (Boadi et al., 2017). These reductions have led to strong fluctuations in the river discharge with generally a negative trend from 1960–2000. The aim of this research is to assess the impacts of CC on hydropower potential of Bamboi catchment. Accordingly, it has the following three objectives: (i) to set up the conceptual hydrological simulation model HBV light for the Bamboi catchment; (ii) to assess the impact of future CC on the hydrological regime of the catchment through scenario (RCP4.5) application comparing a reference period (1983–2005) to two future periods (2020–2049 and 2070–2099); and (iii) to assess the impact of CC on hydropower potential of the catchment.
2.1 Study area
This study was carried out in the Bamboi catchment covering a total area of 134 200 km2 (Fig. 1). The catchment spans across Mali, Burkina Faso, Ghana and Ivory coast. The main river in the basin is the Black Volta which originates as Mouhoun in Burkina Faso and as Sourou in Mali and it has a length of 1325 km (Atulley, 2013). Temperature in the basin ranges from 15 to 44 ∘C and March and April are the hottest months whereas the coolest month is August. Rainfall ranges from 400 to 1400 mm and it increases from North to South likewise humidity (Obahoundje, 2015).
2.2 Hydrological modelling
The hydrological modeling was carried out with the HBV-light model (Seibert and Vis, 2012). Compared to many other hydrological models, HBV has a limited number of parameters and requires few inputs for a classic application. Only three modules of the model structure were applied: (i) soil, (ii) routing, and (iii) response. The built-in Genetic Algorithm and Powell optimization (GAP) were adopted for the calibration of the model. Although the retrieved observed discharge data span from 1979–2007, the series of data over the 1979–2001 featured important gaps and was therefore only use as warm-up data. During the calibration phase, the period of January 1979–January 2001 was used for warming, and 1 January 2001–1 January 2004 was applied for parameters optimization. Statistical criteria were reported by considering NSE, R2 and KGE. However, only KGE was set as objective function during parameters optimization. For the validation process the warm up period was taken from 1 January 1979–1 January 2004 and the validation period ranged from 1 January 2004–28 February 2007. Table 1 provides the type and source of applied datasets in the study.

2.3 Climate impact assessment on the hydrology and hydropower generation potential of the catchment
For climate impact assessment two RCM GCM climate datasets developed by WASCAL at 12 km spatial resolution using WRF and the CORDEX climate product (0.44∘ spatial resolution) with the same concentration pathway RCP4.5 were applied in this study. It is worth noting that the WASCAL dataset is only available for the RCP4.5 scenario. A climate data bias correction was applied to both RCMs–GCMs following the non-parametric quantile mapping using the empirical quantiles method. The bias corrected climate data (reference_1983–2005 and future_2020–2049 and 2070–2099) was used as inputs for the hydrological model to simulated both historical and projected discharges. Power and Energy production were calculated from the simulated discharges using the hydropower Eqs. (1) and (2).
where P is power (W), E is Energy (W h−1), e is the efficiency of the turbine (set to 80 %), ρ is the density of water (kg m−3), Q is the water released to the turbine (set to Q80 of the mean simulated historical and projected discharges, m3 s−1), g is the gravitational force (m s−2), H set to 20 m is the water level above the turbine (mm), and Δt is time (h).
Table 2RCM–GCM products and the corresponding label used in the study.

3.1 Hydrological model calibration and validation
Goodness of fit for the Calibration and validation periods are shown in Fig. 2. The quality measures achieved during calibration equal 0.66, 0.66 and 0.73 for R2, NSE and KGE respectively, indicating a satisfactory to good agreement between observed and simulated discharges. As for the validation phase, the KGE efficiency is within the same range as during the calibration. NSE and R2 however dropped by 0.07 and 0.09 points compared the calibration phase. The visual inspection of the hydrographs shows a broad agreement between simulated and observed discharges.
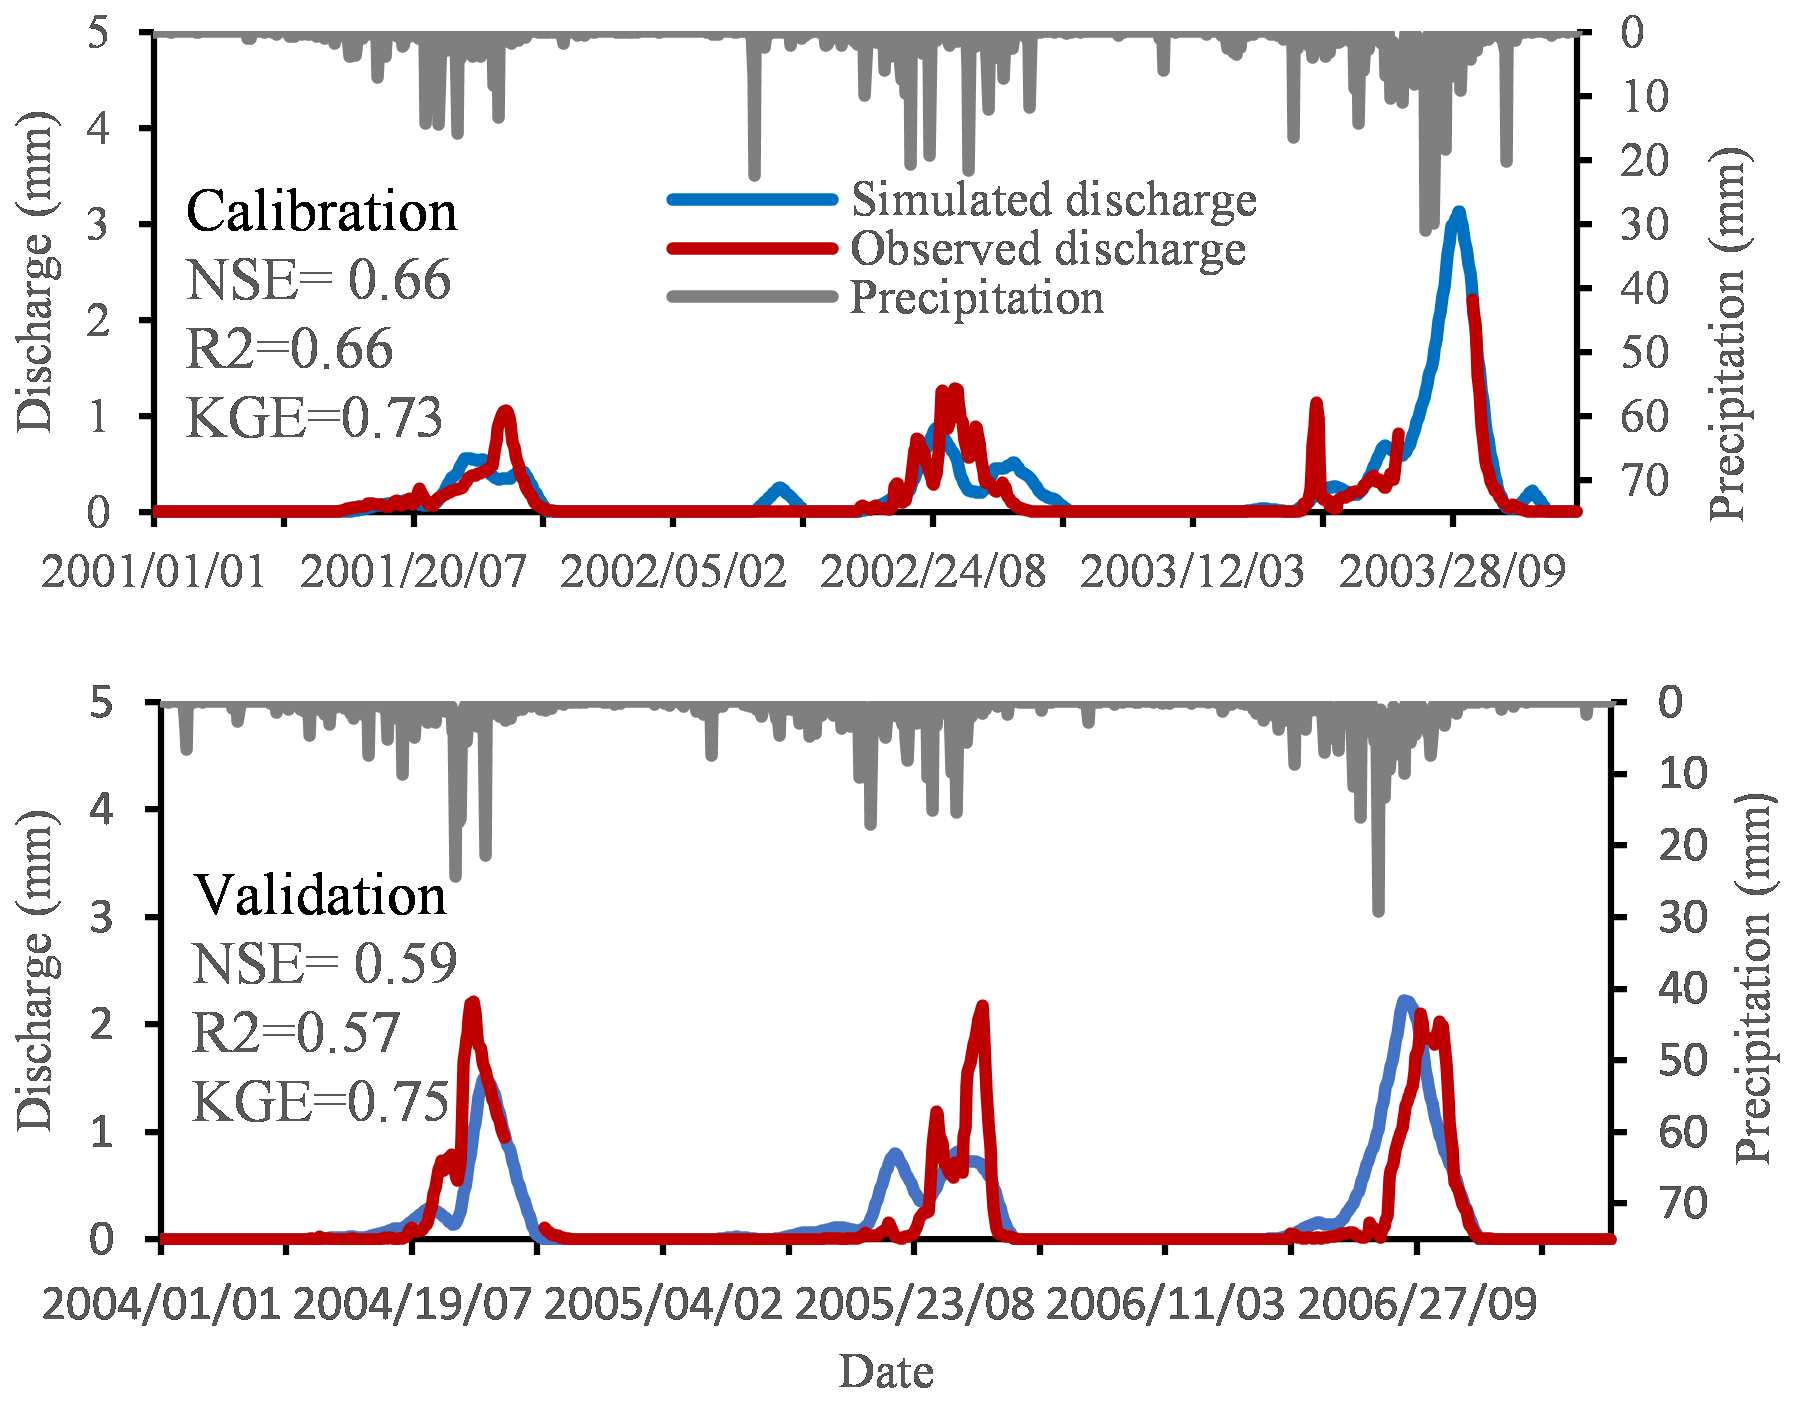
Figure 2Calibration and validation results of the HBV for Bamboi catchment for the period 2001–2004 and 2004–2007 respectively.
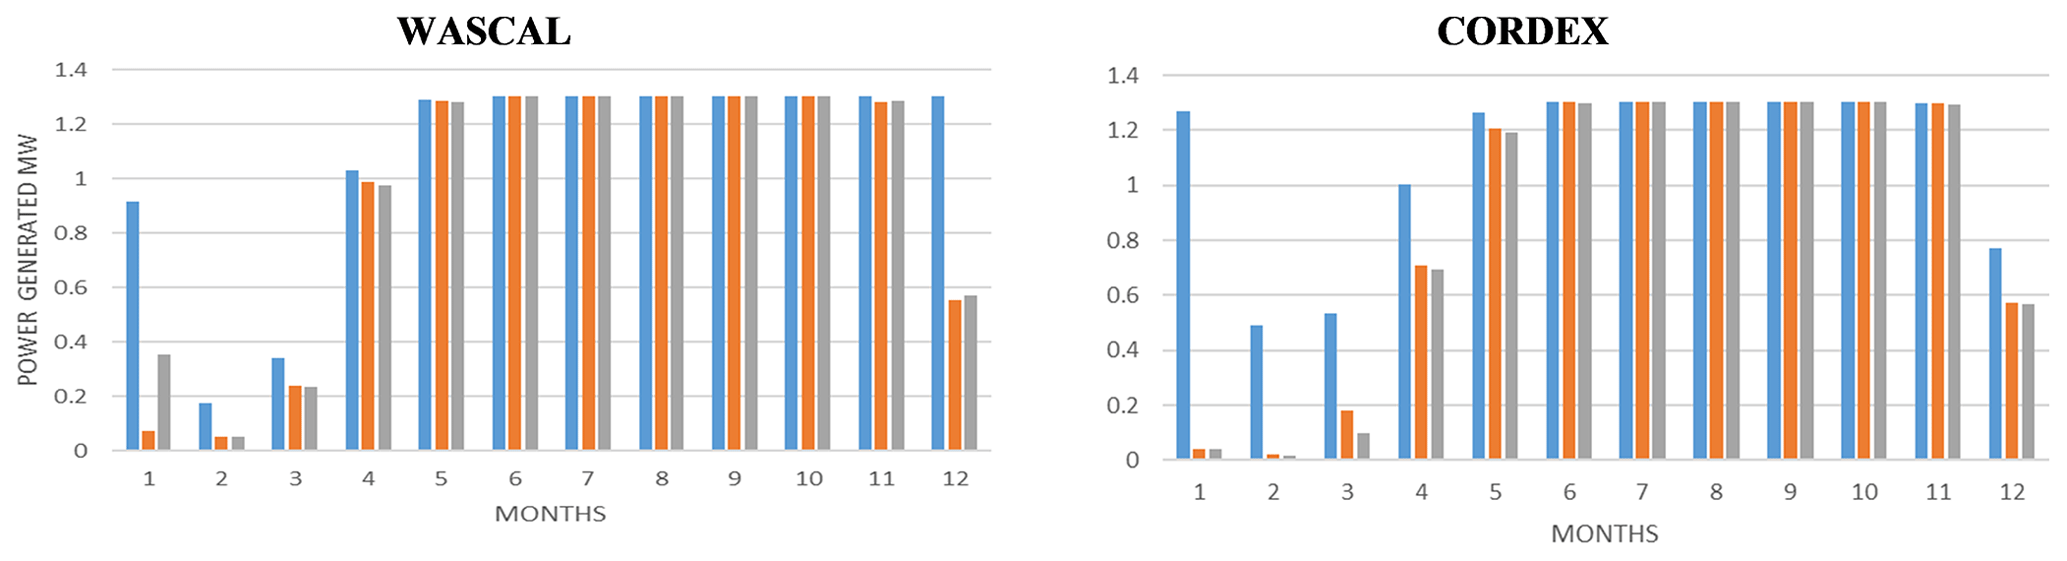
Figure 3Projected and historical power by WASCAL and CORDEX climate products (corrected data). Blue refers to the reference period (1983–2005), orange is the future period of 2020–2049, and grey represents the future period 2070–2099.
3.2 Hydrological and hydropower potential changes
3.2.1 Discharge change
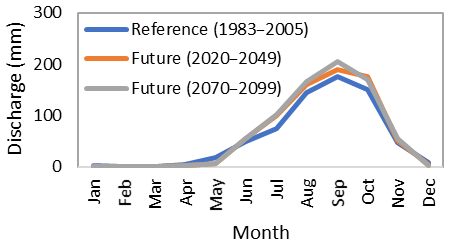
Future discharges simulated with GFD LESM2M–WRF and MPI–ESM REMO with both bias corrected and non-bias corrected climate data, were compared to the reference discharge. The comparison indicates an increase in the annual discharge by both climate models (Table 3). For the mid-century (2020–2049), GFD LESM2M–WRF projects a 14.4 % increase in annual discharge, which is a consequence of relative increase in precipitation of around 11 %. However, for the end of century (2070–2099) there is a slight decrease in discharge as compared to mid-century (2020–2049). These trends are similar with non-bias corrected climate data, and also apply to the MPI–ESM REMO climate dataset.
Table 3Projected discharge change between the reference between the reference (1983–2005) and future periods reference (2020–2049) and future (2070–2099).

3.2.2 Hydropower generation change
Figure 3 indicates that the maximum amount of hydropower power will be generated in wet season and minimum generation will occur in the dry season. This is due to the fact that runoff increases with precipitation in the wet season so does discharge thereby increasing the hydropower production. Both climate datasets indicate that the average hydropower generation will reduce in the future as compared to the reference period (1983–2005) as more hydropower is produced in the historical period in the dry season compared to future periods.
This trend is consistent with the projected change in the annual discharge pattern (Fig. 4).
The projected hydropower potential trends by CORDEX climate product is in agreement with the WASCAL climate product, only slight differences in the magnitude of the changes can be noticed.
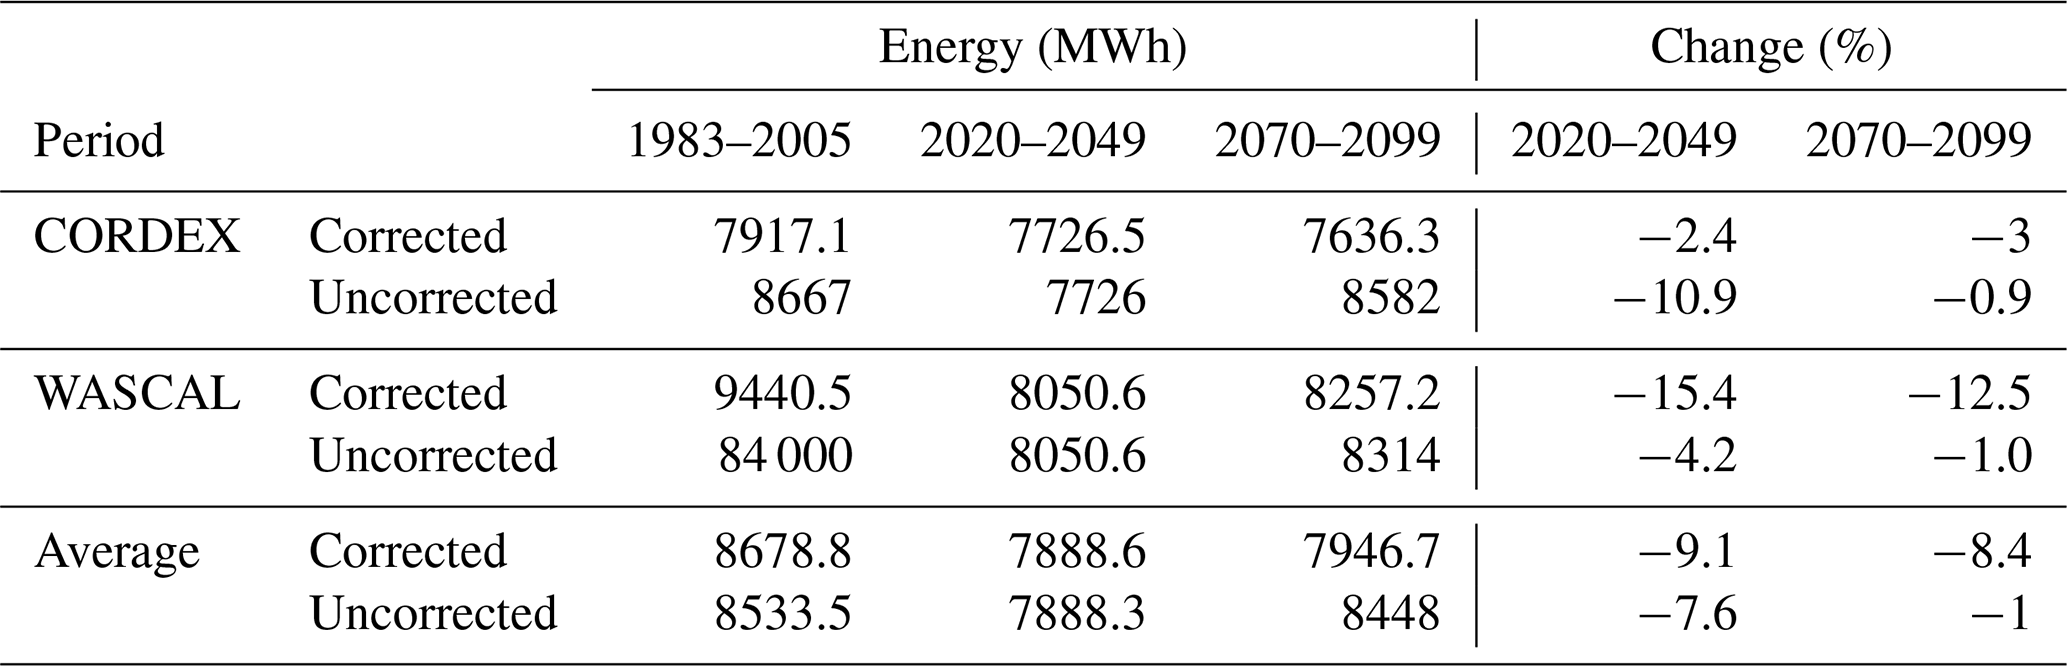
It can be noted from that Table 4 that the average annual hydropower generation will decrease in the future for both climate datasets. For the mid-century (2020–2049) period a decrease in the average annual hydropower production by −9.1 % for bias corrected data and −7.6 % for uncorrected data climate ensemble is projected. By end of century (2070–2099), the average annual power production shows a slight increase as compared to the 2020–2049 period, however the amount is still lower compared to the reference period. These changes are not consistent with the projected annual discharges increase.
Fair model statistical quality measures were achieved during the calibration and validation phases. However, several discrepancies can be observed; notably, (i) some peaks are not well reproduced in 2001 and 2002, (ii) peaks are underestimated in 2001, 2002, 2004 and 2005 and (iii) peaks are overestimated in 2003. Beside model imperfection, important gaps in the GRDC runoff time series combined with the use of reanalysis climate data (CFSR) can reasonably explain these discrepancies (Poméon et al., 2017). These authors also reported, the suitability of the HBV model to simulate the hydrology of some west African catchments. The often-mentioned misrepresentation of peak flow by the model is usually attributed to measurement errors during high discharge events as overbank flow characterizes many rivers in the region.
Both WASCAL and CORDEX climate datasets projected an increase in precipitation and discharge in the rainy season for the future periods. However, the increase in discharge occurs during the wet season where the power plant already operates at its full potential. As a consequence, the discharge increase does not translate in additional energy production. The annual discharge increase is overshadowed by a decrease in monthly discharge during the dry season. Indeed, the decrease of discharge over the dry season will lead to a loss of hydropower. A decrease in average annual hydropower generation in the future is also reported by previous studies in the region (e.g. Obahoundje, 2015). Such a decrease is however attributed to a reduction in precipitation.
GFDL ESM 2M of WASCAL and MPI ESM REMO of CORDEX were applied to the HBV to assess the impacts of CC on the hydropower generation of the Bamboi catchment comparing two future periods 2020–2049 and 2070–2099 to a reference period (19836–2005). The results indicated that precipitation will increase in both future periods, however the hydropower generation will decrease for both future periods. Hydropower is projected to decrease in the dry season while the discharge increase in the wet season. Both climate datasets, are agreeing that hydropower production is projected to decrease in the end of the century 2070–2099, while the decrease in the mid-century is even higher. These results underline that the projected increases in discharge do not necessarily mean an increase in hydropower generation.
WaSIM code is not publicly accessible. The applied Richards version of the software is available for download at http://www.wasim.ch/en/products/wasim_richards.htm (last access: 10 October 2021) (WaSiM-ETH, 2021).
The CORDEX-Africa data applied in this study are publicly accessible at https://esg-dn1.nsc.liu.se/search/esgf-liu/ (last access: 10 October 2021). The WASCAL climate data applied in this study are publicly accessible at https://doi.org/10.1594/PANGAEA.880512 (Heinzeller et al., 2018).
YY, AYB and TCM developed the concept. All authors contributed to implementing the concept and writing the manuscript.
The contact author has declared that neither they nor their co-authors have any competing interests.
Publisher’s note: Copernicus Publications remains neutral with regard to jurisdictional claims in published maps and institutional affiliations.
This article is part of the special issue “Hydrology of Large River Basins of Africa”. It is a result of the 4th International Conference on the “Hydrology of the Great Rivers of Africa”, Cotonou, Benin, 13–20 November 2021.
The authors are grateful to Luc Olivier Crépin SINTONDJI for supervising this work.
Atulley, J.: Impact of small reservoirs and dugouts in ghana on hydrology and water allocation in the Black Volta Basin. Dissertation, Kwame Nkrumah University of Science and Technology, available at: https://hdl.handle.net/10568/42166 (last access 10 octobre 2021), 2013.
Boadi, S. A. and Owusu, K.: Impact of climate change and variability on hydropower in Ghana, Afr. Geogr. Rev., 6812, 1–15, https://doi.org/10.1080/19376812.2017.1284598, 2017.
Hamududu, B. and Killingtveit, A.: Assessing climate change impacts on global hydropower, Energies, 5, 305–322, https://doi.org/10.3390/en5020305, 2012.
Heinzeller, D., Dieng, D., Smiatek, G., Olusegun, C., Klein, C., Hamann, I., Salack, S., Bliefernicht, J., and Kunstmann, H.: The WASCAL high-resolution regional climate simulation ensemble for West Africa: concept, dissemination and assessment, Earth Syst. Sci. Data, 10, 815–835, https://doi.org/10.5194/essd-10-815-2018, 2018.
Obahoundje, S.: Potential Impacts of Land Use, Land Cover Change and Climate Change on Hydro power Generation in West Africa: The case study of Bui Dam (Ghana), MSc Thesis, Université Abdou moumouni, Niamey, Niger, 2015.
Oyerinde, G. T., Wisser, D., Hountondji, F. C. C., Odofin, A. J., Lawin, A. E., Afouda, A., and Diekkrüger, B.: Quantifying Uncertainties in Modeling Climate Change Impacts on Hydropower Production, Climate, 4, 34, https://doi.org/10.3390/cli4030034, 2016.
Poméon, T., Jackisch, D., and Diekkruger, B.: Evaluating the Performance of Remotely Sensed and Reanalysed Precipitation Data over West Africa Using HBV Light, J. Hydrol., 547, 222–235, https://doi.org/10.1016/j.jhydrol.2017.01.055, 2017.
Seibert, J. and Vis, M. J. P.: Teaching hydrological modeling with a user-friendly catchment-runoff-model software package, Hydrol. Earth Syst. Sci., 16, 3315–3325, https://doi.org/10.5194/hess-16-3315-2012, 2012.
Sylla, M. B., Nikiema, P. M., Gibba, P., Kebe, I., and Klutse, N. A. B.: Climate Change over West Africa: Recent Trends and Future Projections, in: Adaptation to Climate Change and Variability in Rural West Africa, edited by: Hesselberg, J. and Yaro, J. A., 25–40, https://doi.org/10.1007/978-3-319-31499-0_3, 2016.
WaSiM-ETH: WaSiM (Richards) [code], available at: http://www.wasim.ch/en/products/wasim_richards.htm, last access: 10 October 2021.