the Creative Commons Attribution 4.0 License.
the Creative Commons Attribution 4.0 License.
 | 16 Nov 2021
Characterization of the variability in climate extremes in the Ferkessédougou sugar complexes (Northern Côte d'Ivoire)
Affoué Berthe Yao
Sampah Georges Eblin
Loukou Alexis Brou
Kouakou Lazare Kouassi
Gla Blaise Ouede
Ibrahim Salifou
Arona Diedhiou
Bi Crépin Péné
This study aims to analyse the frequency, intensity and duration of extreme climate events in order to optimise sugarcane production in the Ferkessédougou sugar complexes. The methodological approach is based on the calculation of extreme climate indices defined by the Expert Team on Climate Change Detection and Indices (ETCCDI) from daily rainfall and temperature data observed at the Ferké 2 station over the period 1999–2018. The results show that the rainfall indices are negative, except for the number of consecutive dry days (CDD); this shows a decreasing trend in rainfall with, however, insignificant trends. Over the period 1999–2006, the number of intense rainfall days (R10 mm) decreased from 40 to 28 d with an average decrease of 0.3 d yr−1 and the number of very intense rainfall days (R20 mm) fluctuated between 26 and 2 d, with a slope of 0.083. The extreme temperature indices show statistically significant positive trends for the warm sequences; this confirms the rising of temperatures on both a local and national scale. This study could enable the Ferkessédougou sugar complexes managers to develop strategies for adaptation to climate change.
- Article
(3269 KB) - Full-text XML
- BibTeX
- EndNote


Figure 1Location of the Upper Bandama watershed.
The consequences of climate change are clearly visible with the advent of extreme events such as floods, droughts, melting glaciers, scarcity of water resources, increase in infectious diseases, etc. (Handmer et al., 2012). Of these extreme events, drought is one of the extreme weather conditions that affects more people than any other form of natural disaster (Wilhite, 2000). The occurrence of drought in recent decades in West Africa highlights the importance of this phenomenon (Bhaga et al., 2020; Faye et al., 2017). Moreover, climate projections have shown that West Africa will experience a significant increase in temperature, with high variability in rainfall (Kouakou et al., 2014; Kouamé et al., 2014; Ly et al., 2013; Yapo et al., 2020). In Côte d'Ivoire, rainfall is the fundamental climatic element that conditions the development of various agricultural activities. Thus, their absence, scarcity, excess/deficit or poor spatial and temporal distribution generates crises (Péné and Assa, 2003). This is the case of the sugar complexes located in the departments of Ferkessédougou and Tafiré, in the north of Côte d'Ivoire. These sugar complexes exploit the water of the Bandama river for sugar cane irrigation, sugar cane production and domestic needs. Following the example of the large agri-food industry in Côte d'Ivoire, water needs for irrigation and for the populations of this region are progressively increasing and water resources are more and more in demand. However, studies of climate variability in the area have shown that the decline in rainfall that began in the 1970s is continuing (Soro et al., 2013). Annual and inter-annual irregularities in rainfall result in rainy seasons with poor harvests (Péné et al., 2010). Projections show that extreme weather events are expected to become more frequent as the climate warms (Yapo et al., 2020). These events have a negative impact on agriculture, livestock and natural resources, which are sectors on which the bulk of the Ivorian economy is based. It is therefore essential to analyse the variability of rainfall and temperature extremes observed in this region, which is an area of interest for Côte d'Ivoire because of its sugar production capacity. The aim of this study is to analyse the frequency, intensity and duration of extreme climate events with a view to optimising sugarcane production in the Ferkessédougou sugar complexes. The methodological approach is based on the calculation of climate indices defined by the Expert Team on Climate Change Detection and Indices (ETCCDI).
The study area is located in the Upper Bandama watershed, at the Korhogo-Badikaha road station, between longitudes 5∘00′ and 6∘20′ W and latitudes 9∘00′ and 10∘20′ N (Fig. 1). It covers the square degrees of the Poro, Tchologo and part of the Bagoue regions with an estimated area of 9850 km2 and represents about 10 % of the entire Bandama watershed. The two sugar complexes of Ferkessédougou (Ferké 1 & Ferké 2) cover an area of 42 721 ha. Sugar cane is grown under both irrigated and rain-fed conditions.
The study area is under the influence of the tropical transitional regime characterised by two main seasons (Soro et al., 2013) (Fig. 2).
-
a long rainy season, from April to October, with average monthly rainfall ranging from 129.3 to 250.4 mm and
-
a long dry season, from November to March, with average rainfall ranging from 1.9 to 82.5 mm.
Average monthly temperature ranges from 25 ∘C in August to 29 ∘C in March.
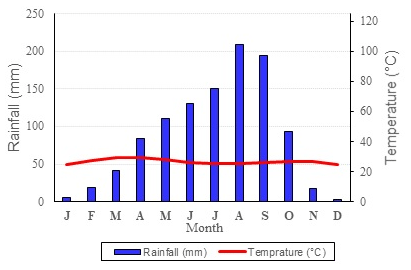
Table 1List of ETCCDMI core Climate Indices used (Zhang and Yang, 2004).

3.1 Material
The material consists of climatic data such as daily rainfall and temperature data for the period 1999–2018. These data come from the Ferkessédougou sugar complexes and were recorded at the Ferké 2 station. The synoptic overview of the variability of climate extremes in the study area is carried out with the RClimDex software. The software provides a data quality check to identify recording errors that may exist in the daily data (WMO, 2009). The quality control process is based on the following principles:
-
erroneous values of the maximum daily temperature must be replaced by −99.9 if it is lower than the minimum daily temperature;
-
it must not have more than 365–366 daily observations per year;
-
February should have no more than 28 observations in any given year;
-
missing or negative data (for rainfall) are replaced by −99.9.
3.2 Methods
The analysis of rainfall and temperature extremes was possible through the calculation of climate indices. Although there are many climate indices, 27 have been defined by the Expert Team on Climate Change Detection and Indices (ETCCDI). This method of analysis is commonly used to study extreme events (Aguilar et al., 2009; Filahi et al., 2015; Hountondji et al., 2011; New et al., 2006; Santos et al., 2010).
Detailed descriptions of these indices and the RClimDex are available on the ETCCDI website (https://github.com/ECCC-CDAS/RClimDex, last access: 19 April 2021). In this study, 8 rainfall indices and 7 temperature indices were used (Table 1). The choice of these indices was made to highlight extreme rainfall events and their frequency on the one hand and to assess temperature variations and their duration on the other hand. The parameters selected are those that can have a positive or negative impact on sugarcane yield. Indeed, Saithanu et al. (2017) studied the effect of minimum temperature on the different phenological phases of sugarcane. According to Mali et al. (2014), high humidity leads to better sugarcane growth and increased sugar content. Linear trend analysis (expressed as % per year) was carried out from 1999 to 2018 by linear regression between the different rainfall indices and time (in years). The slopes thus estimated were grouped into two classes indicating significant and non-significant trends. The boundary of the two classes considered is defined from the Student's t-statistic used to test the hypothesis of a slope equal to 0. The trend is therefore qualified as significant if the probability p (p value) of the t-test applied to the regression slope is less than 0.05, whereas it is not significant when it exceeds the 0.05 threshold.
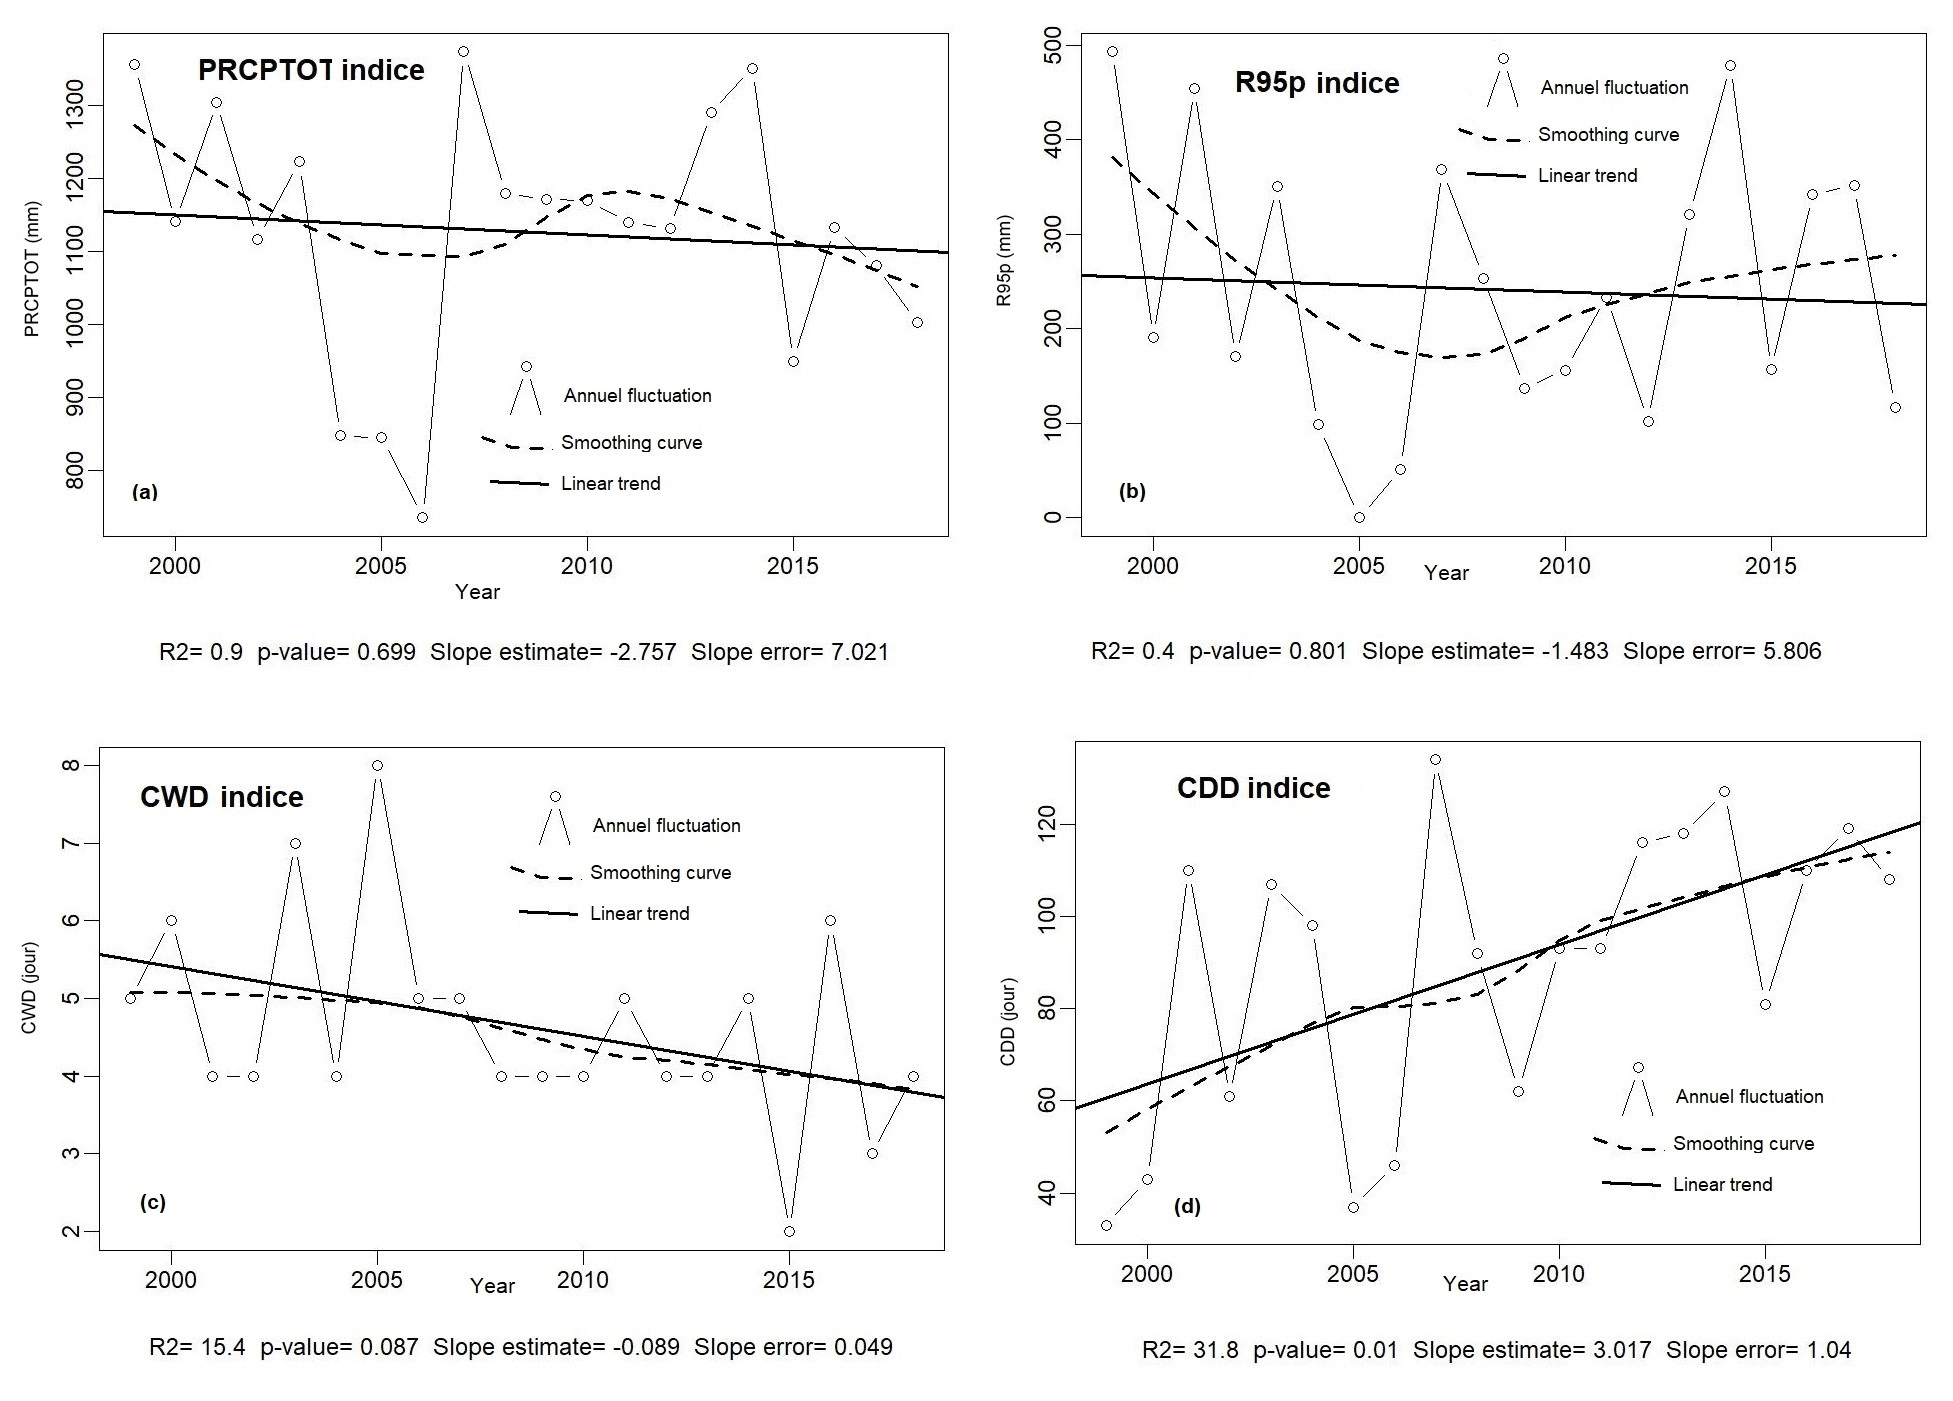
Figure 3Trends in extreme rainfall indices calculated over the period 1999–2018 at the Ferké 2 station: (a) PRCPTOT indice, (b) R95p indice, (c) CWD indice and (d) CDD indice.
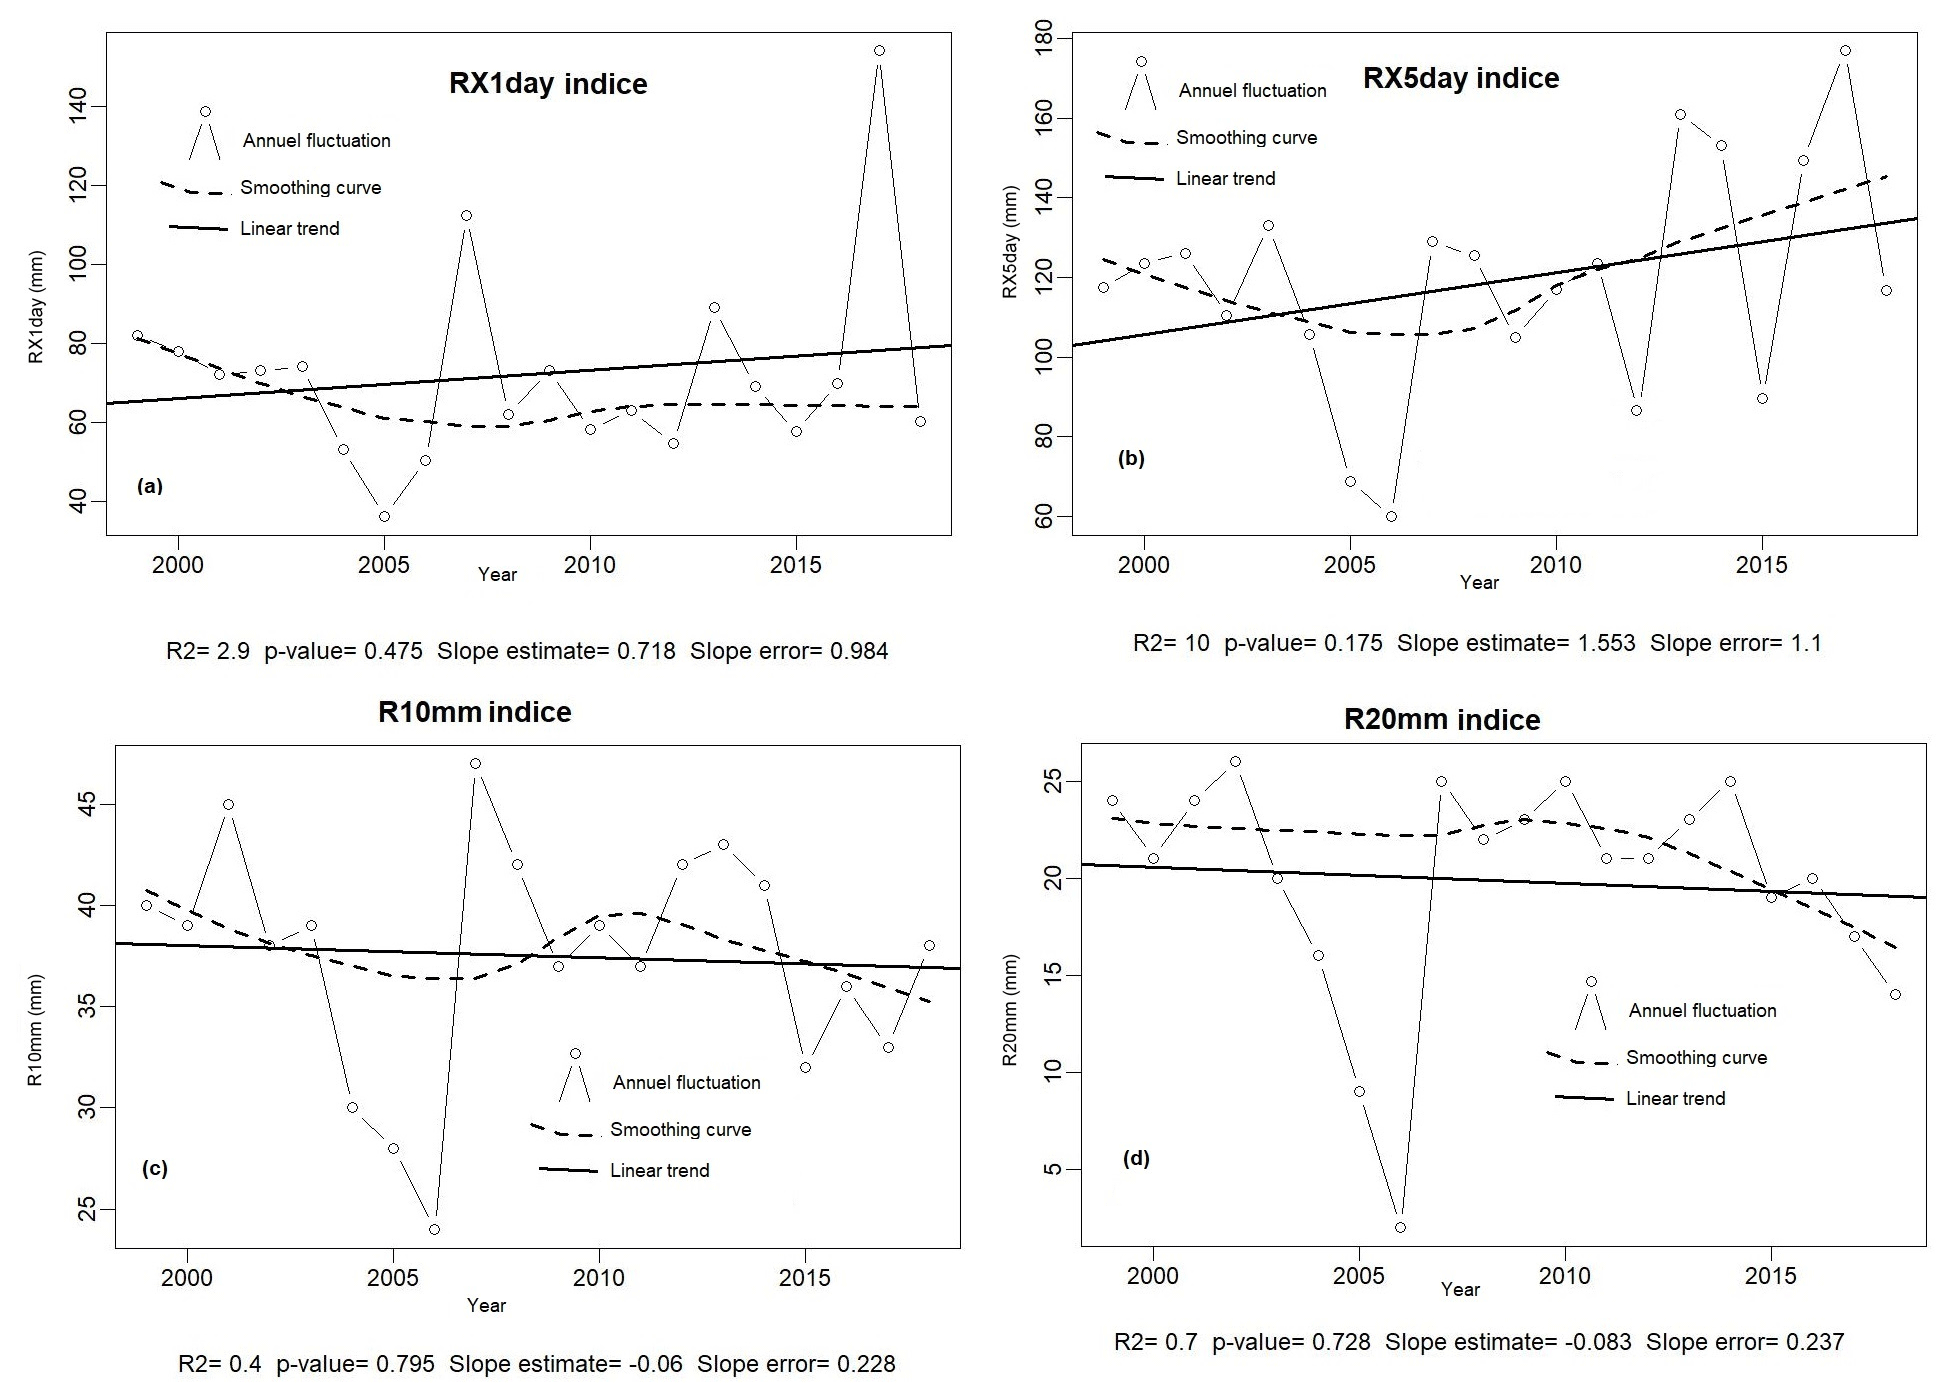
Figure 4Trends in extreme rainfall indices calculated over the period 1999–2018 at the Ferké 2 station: (a) RX1day indice, (b) RX5day indice, (c) R10 mm indice and (d) R20 mm indice.
4.1 Results
4.1.1 Variability of extreme rainfall in Ferkessédougou
Figures 3 and 4 show the trends in the variability of the different extreme rainfall indices at the Ferké 2 station over the period 1999–2018. The linear trend line analysis (Fig. 3a) shows a regression of the annual rainfall amounts. The index trend is decreasing by 2.76 mm yr−1. This regression is statistically insignificant with a p value of 0.699. The smoothing curve shows three phases in the evolution of the total annual rainfall. The period 1999–2006 is marked by a drop in annual totals. The period 2006–2014 is characterised by a slight increase in cumulative rainfall. This phase is followed by a further decline from 2015. Similarly, the R95p index (Fig. 3b), which defines the cumulative rainfall above the 95th percentile of the rainfall time series, is marked by alternating downward and upward trends, with one downward trend that is not very significant (with a p value of 0.801).
Figure 3c and d show the evolution of consecutive wet days (CWD) and consecutive dry days (CDD) at the Ferké 2 station. It can be seen that the CDD (Fig. 3d) is increasing while that of CWD (Fig. 3c) is decreasing. In Ferkessédougou, the maximum number of CWD is 5 to 6 d while CDD reach 120 d (Fig. 3c). The decrease in CWD and CDD remains significant in the Ferkessédougou sugar complexes with p values of 0.087 and 0.01 respectively. In sum, these results confirm the decrease in average annual precipitation in the Ferkessédougou sugar complexes.
Indices Rx1day and Rx5day represent the monthly maximum 1 d precipitation and the monthly maximum consecutive 5 d precipitation respectively during the year (Fig. 4a and b). There was a slight upward trend in both indices. However, this increase is non-significant with p values of 0.475 and 0.175 respectively.
The evolution of intense (Fig. 4c) and very intense (Fig. 4d) rainfall days is similar to that of annual total wet-day precipitation (PRCPTOT). Over the period 1999–2006, the number of intense rainfall days (R10 mm) decreased from 40 to 28 d with an average decrease of 0.3 d yr−1 and the number of very intense rainfall days (R20 mm) fluctuated between 26 and 2 d, with a slope of 0.083. From 2006 to 2018, the overall trend for both indices is downward, with little significance. In sum, these analyses show that the decrease in precipitation appears to be due to a decrease in consecutive wet days and an increase in consecutive dry days.
4.1.2 Variability of extreme temperatures in Ferkessédougou
The analysis of Fig. 5 shows a generalized trend of increasing maximum (Fig. 5a) and minimum (Fig. 5b) temperatures, with a highly significant trend (p value equal to 0). The Min Tmax (Fig. 5c) in Ferké 2 station remains almost stationary while the Min Tmin indicates a regression (Fig. 5d).
The trend in the indices of the cold and warm sequences evolves inversely at Ferké 2 station as shown in Fig. 6. According to this figure, the number of hot days (Fig. 6a) in the year increased by 1.15 % yr−1. Conversely, the number of cold days (Fig. 6b) in the year decreased by 0.13 % yr−1 in Ferkessédougou. The evolution of the diurnal temperature range (DTR) (Fig. 6c), which is also increasing, confirms the global warming. Indeed, the p value of the duration indices of the warm sequences and the thermal amplitudes are lower than 0.05, which indicates that the climatic warming observed in the complexes is very significant.
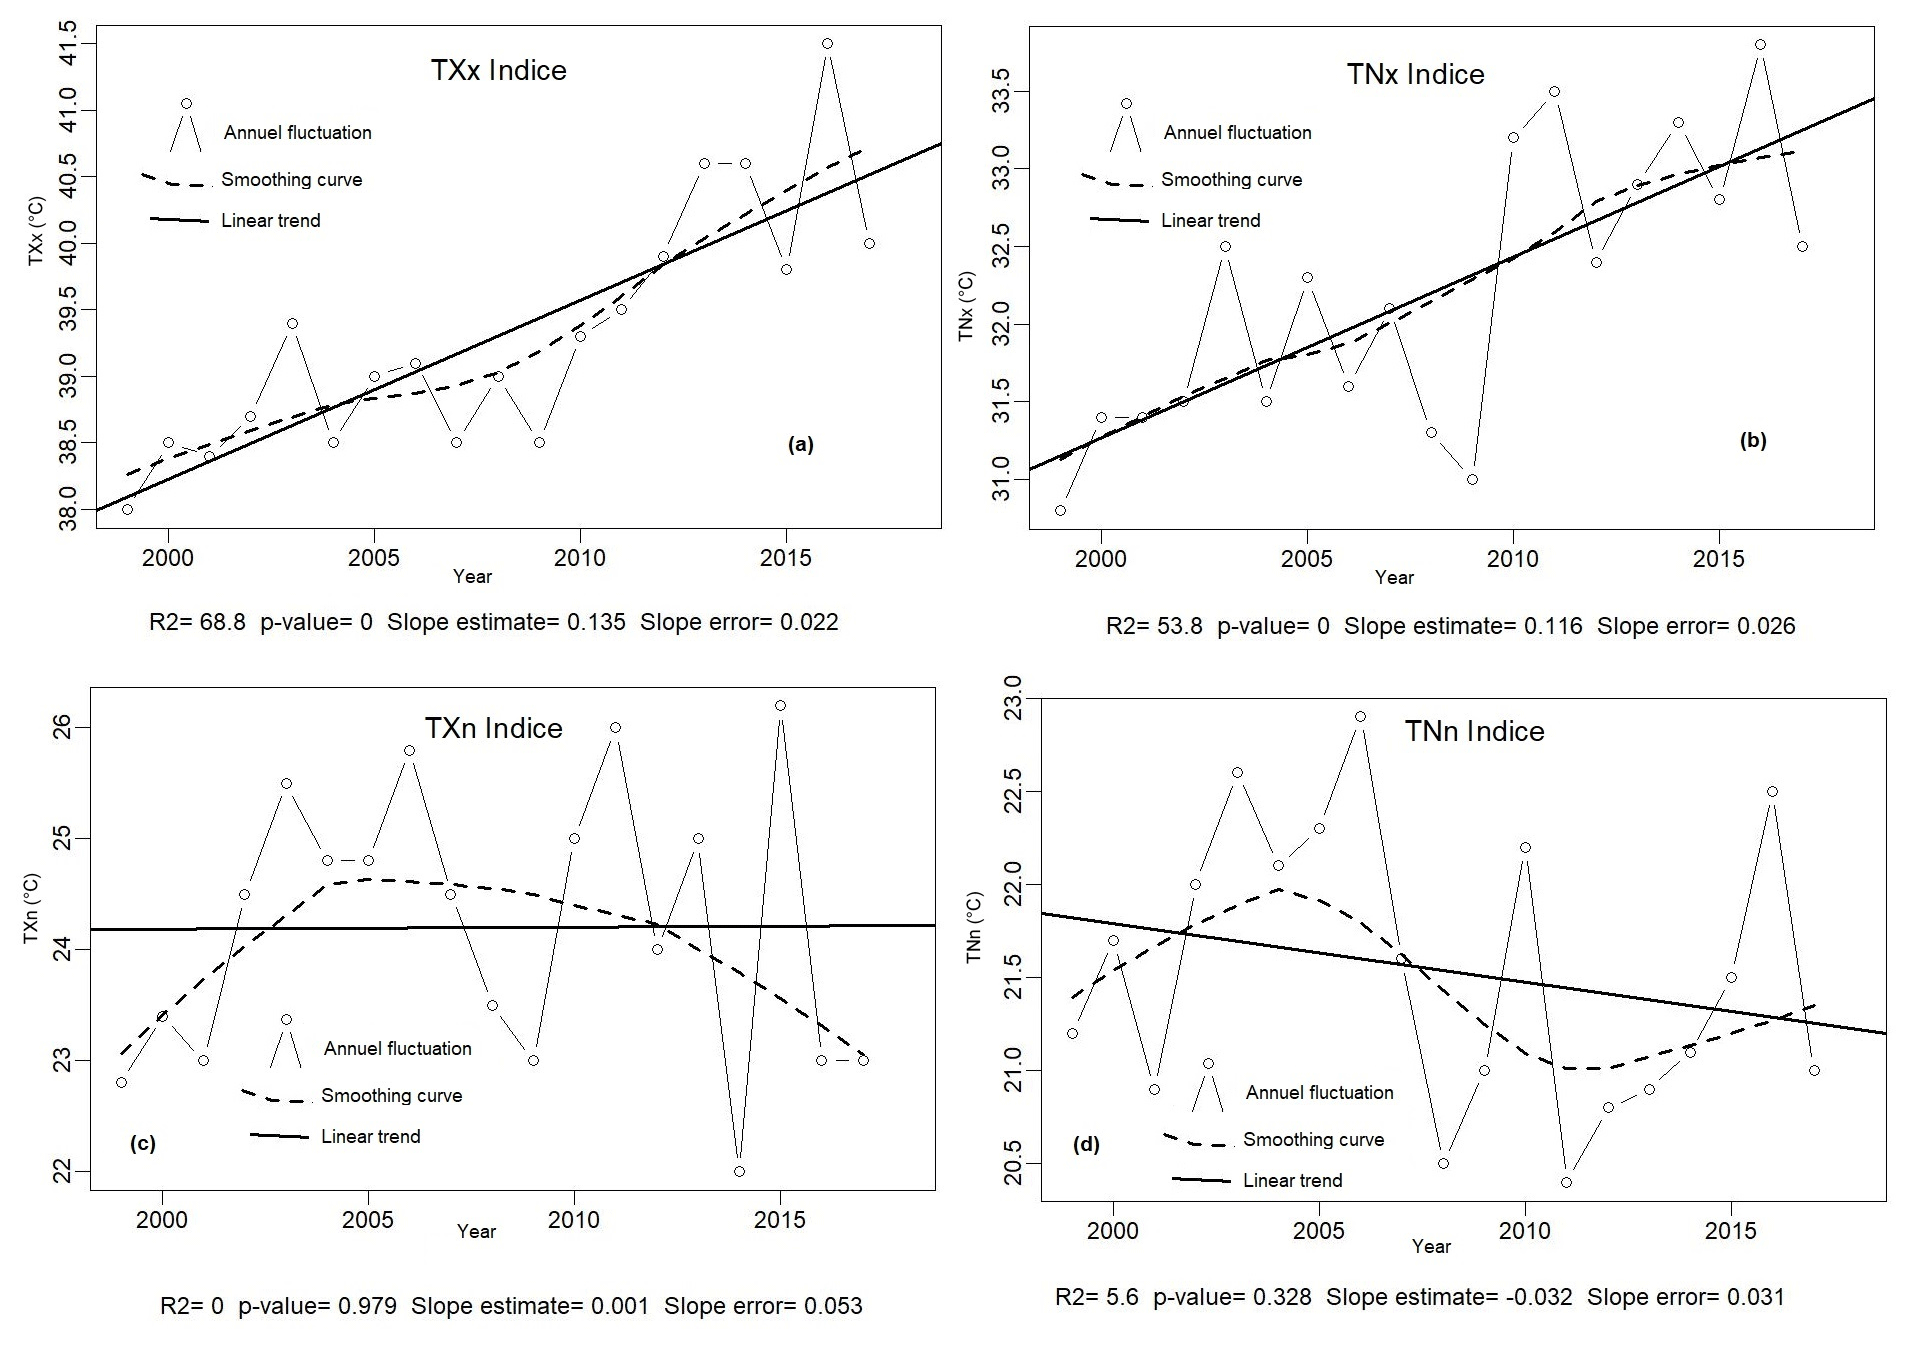
Figure 5Trend in extreme temperature indices from 1999–2018 at the Ferké 2 station: (a) Max Tmax indice, (b) Max Tmin indice, (c) Min Tmax indice, and (d) Min Tmin indice.
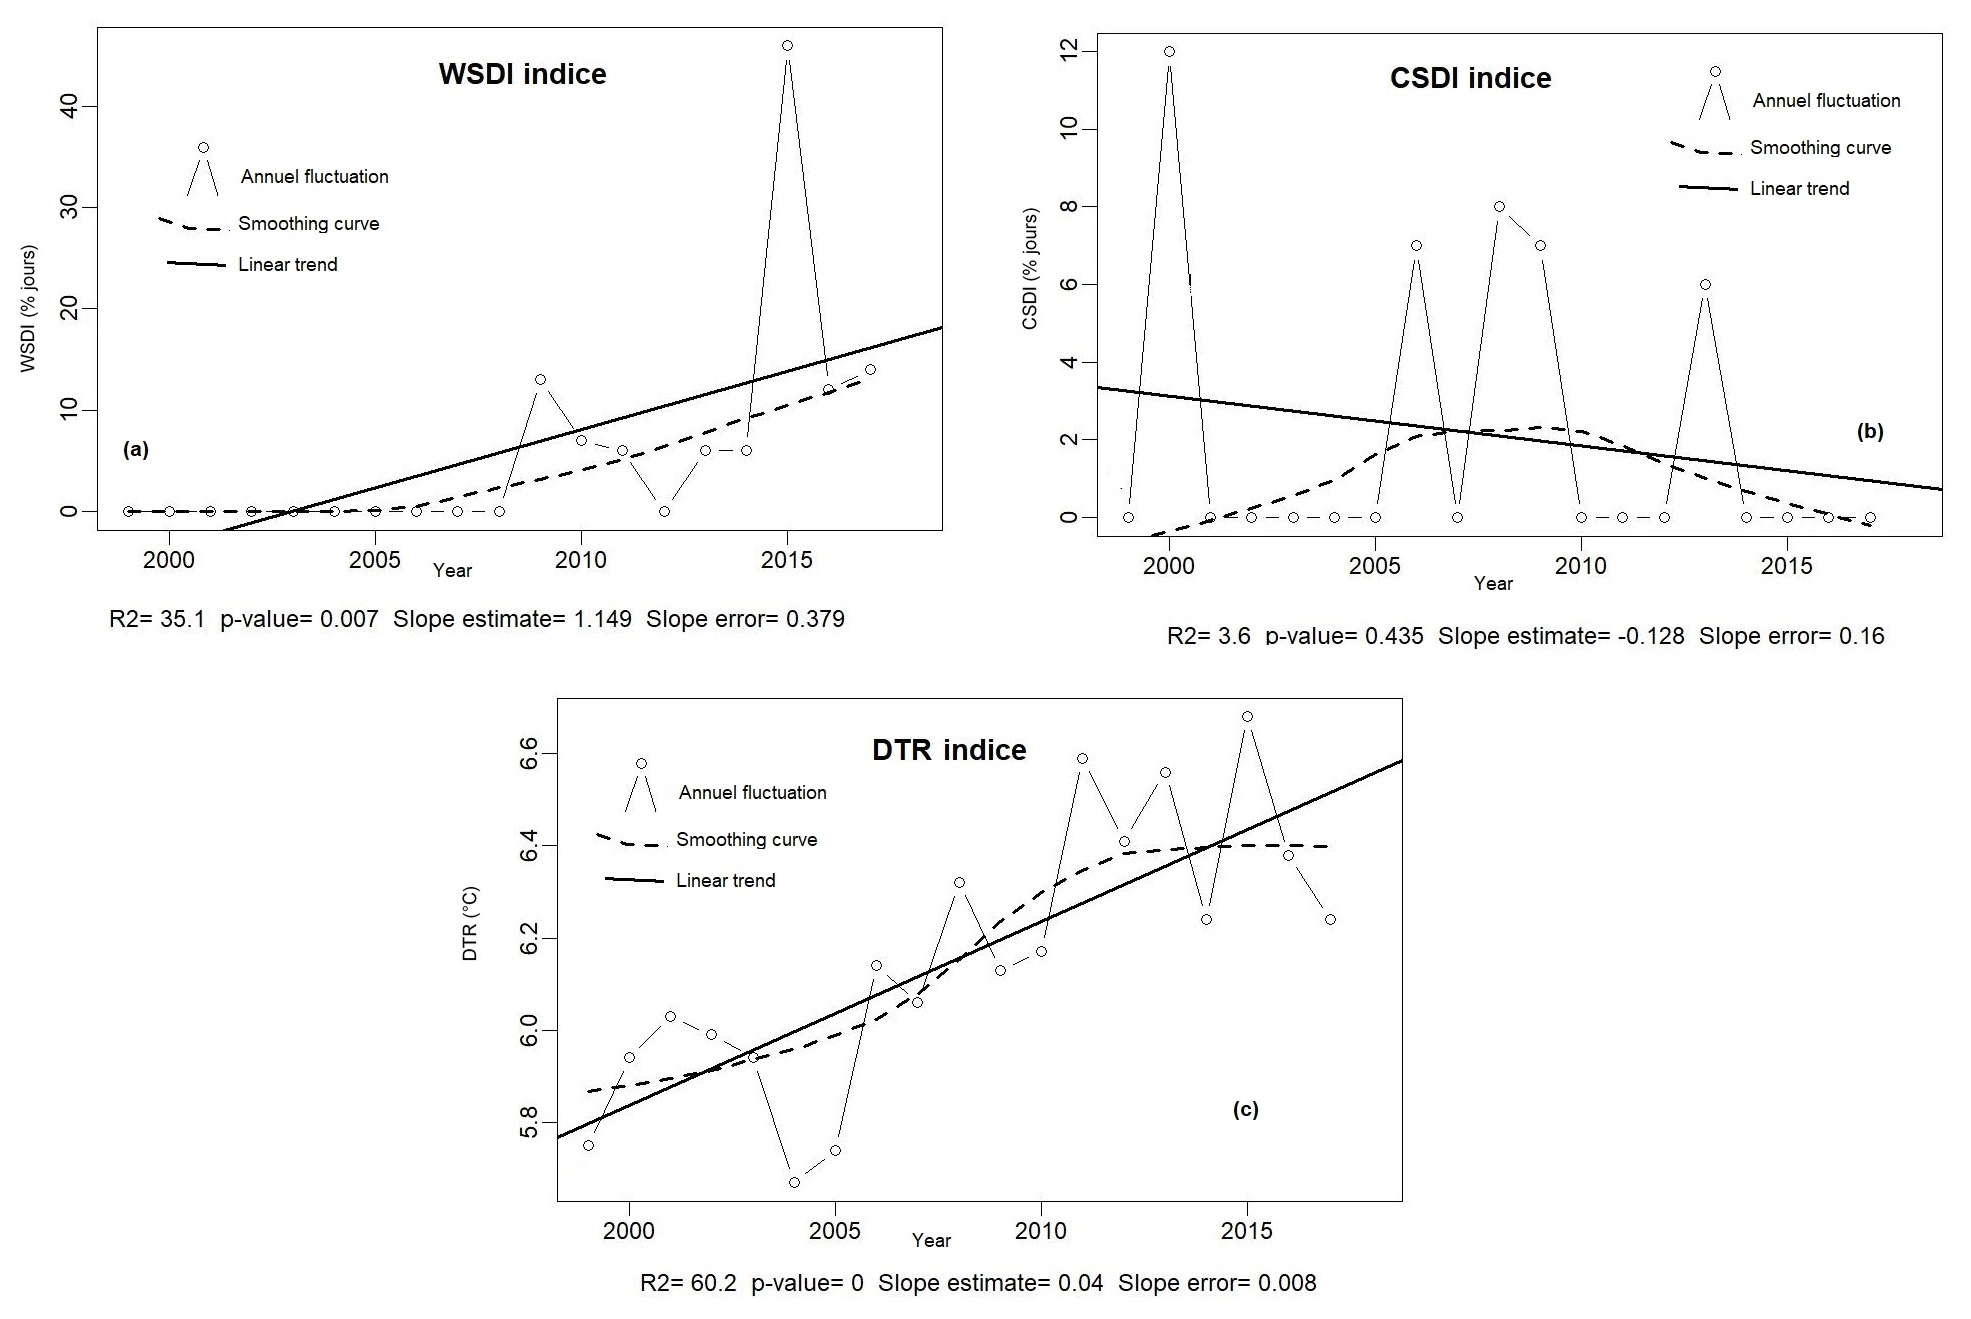
Figure 6Trend of extreme temperature indices over the period 1999–2018 at Ferké 2 station: (a) WSDI indice, (b) CSDI indice and (c) DTR indice.
4.2 Discussion
The application of extreme climate indices in the Ferkessédougou sugar complexes revealed a decrease in cumulative annual rainfall, the number of consecutive wet days and the number of heavy precipitation days at the Ferké 2 station over the period 1999–2018. The analysis reveals a significant trend in the number of consecutive wet days only. These results are similar to those obtained by N'Guessan et al. (2020) in the Lobo watershed. According to this study, all precipitation indices have decreased over the period 1984–2013. Indeed, the drought trend observed in the north of Côte d'Ivoire is confirmed by the index of consecutive dry days, which is on the rise in the Ferkessédougou area with a very significant regression trend. Thus, these results on the decreasing trend in the number of heavy precipitation days (R10 mm) and very heavy precipitation days (R20 mm) confirm this. Kouassi et al. (2010) reported that the decrease in the frequency of rainy days is synchronous with the decrease in annual rainfall. This decrease in the number of heavy (R10 mm) and very heavy (R20 mm) precipitation days observed in this study would be due to the decrease in the frequency of daily rainfall of between 10 and 50 mm. These different trends indicate that the drought that began in the 1960s and 1970s (Soro et al., 2013) is continuing in the Ferkessédougou sugar complexes, which could have considerable impacts on agricultural production. Indeed, according to studies by Atchérémi et al. (2018), the occurrence of a sequence of consecutive dry days within the rainy season can have a strong impact on agricultural production. The dry sequences create a lack of water in the plant. When they occur at the beginning or in the middle of the growing season, they can cause a false start to the season or even mortgage an entire crop year. These trends highlighted in our work are in line with those of Djossou et al. (2020), on the Pendjari watershed at the Porga outlet in Benin.
The trend in maximum and minimum temperatures in Ferké 2 station is generally upwards. This increase seems to be accompanied by a significant decrease in the duration of cold sequences while that of warm sequences is increasing. These results are similar to those of Filahi et al. (2015), Karimou-Barke et al. (2015) and Djossou et al. (2020) in their studies on the evolution of peak temperatures in West Africa. These various studies indicate a more or less significant positive trend in the various indices of temperature extremes at local or regional level. These authors have shown a generalized trend of increasing hot days (TX90p index) and a significant increase in the duration of dry sequences (WSDI, TXx and TNn). The increase in temperature extremes can be attributed to heavy anthropisation and more particularly to the development of land use leading to the destruction of vegetation cover, which has increased over the last twenty years throughout the world (Abdalah, 2005). Thus, future projections also predict an upward trend in these extreme temperature indices (Diedhiou et al., 2018; Yapo et al., 2019) namely heat wave episodes, heat waves, extremely hot and more frequent nights. These extreme events are thought to be related to wind anomalies opposing the mean circulation in the upper and lower troposphere of West Africa (Fontaine et al., 2013).
This study examined the evolution of rainfall and extreme temperature indices in the Ferkessédougou sugar complexes over the period 1999–2018. Trend analysis of these indices showed that temperatures have increased significantly, but trends in indices of precipitation extremes are globally insignificant. The temperature extremes show statistically significant positive trends for the warm sequences and the maximum of the max and min temperatures. This confirms the warming of temperatures both locally and nationally.
The precipitation indices are negative, with the exception of the number of consecutive dry days; this shows a decreasing trend in rainfall with, however, insignificant trends. The decrease in the number of heavy (R10 mm) and very heavy (R20 mm) precipitation days observed in this study would be due to the decrease in the frequency of daily rainfall of between 10 and 50 mm. Over the period 1999–2006, the number of heavy precipitation days (R10 mm) decreased from 40 to 28 d with an average decrease of 0.06 d yr−1 and the number of very heavy precipitation days (R20 mm) fluctuated between 26 and 2 d, with a slope of 0.083. From 2006 to 2018, the overall trend for both indices is downwards. Thus, dry seasons are getting longer while the rainy seasons are getting shorter. Further investigations are underway to analyse the impact of temperature and precipitation extreme variability on sugarcane yields in the Ferkessédougou sugar complexes.
The Rclimdex software is freely available to the public. The manual and the software can be downloaded from the website: https://github.com/ECCC-CDAS/RClimDex, last access: 19 April 2021 (Chan, 2021).
Precipitation and temperature data are not publicly available due to the structure's research policy. However, in the framework of a research cooperation as in this study, these data can be provided free of charge.
ABY analyzed the data and wrote the manuscript; SGE and LAB assisted in the preparation of the manuscript and reviewed the document; GBO and IS contributed to the data processing in the RClimDex software, KLK and AD supervised the study through the CLIMSUCAF project and BCP facilitated access to the SUCAF-CI data.
The contact author has declared that neither they nor their co-authors have any competing interests.
Publisher's note: Copernicus Publications remains neutral with regard to jurisdictional claims in published maps and institutional affiliations.
This article is part of the special issue “Hydrology of Large River Basins of Africa”. It is a result of the 4th International Conference on the “Hydrology of the Great Rivers of Africa”, Cotonou, Benin, 13–20 November 2021.
This work was carried out as part of the AFD-CLIMSUCAF project (Convention IRS/ECO/No. 499-2019). The authors would like to thank the CLIMSUCAF project and SUCAF-CI company for providing funds and data for this study.
Abdalah, M.: Besoins d’observation pour les évènements extrêmes et pour l’adaptation au changement climatique. In: Rapport de l'atelier régional sur le système mondial d'observation du climat pour le bassin Méditerranéen, Marrakech, Maroc, du 22 au 24 novembre 2005, 61–64, 2005.
Aguilar, A., Aziz Barry, A., Brunet, M., Ekang, Fernandes, L. A., Massoukina, M., Mbah, J., Mhanda, A., Do Nascimento, D. J., Peterson, T. C., Thamba Umba, O., Tomou, M., and Zhang, X.: Changes in temperature and precipitation extremes in western central Africa, Guinea Conakry and Zimbabwe, 1955–2006, J. Geophys. Res., 114, 1–11, https://doi.org/10.1029/2008JD011010, 2009.
Atchérémi, K. N. D., Jourda, J. P. R., Saley, M. B., Kouamé, K. J., and Balliet, R.: Etude de l'évolution des extrêmes pluviométriques et de température dans le bassin versant de rivière Davo (Sud-Ouest de la Côte d'Ivoire) à partir de certains indices du logiciel RCLIMDEX, Larhyss Journal, 36, 99–117, 2018.
Bhaga, T. D., Dube, T., Shekede, M. D., and Shoko, C.: Impacts of climate variability and drought on surface water resources in Sub-saharan Africa using remote sensing: A review, Remote Sens., 12, 1–36, https://doi.org/10.3390/rs12244184, 2020.
Chan, R.: RClimDex, available at: https://github.com/ECCC-CDAS/RClimDex, Github [code], last access: 19 April 2021.
Diedhiou, A., Bichet, A., Wartenburger, R., Seneviratne, S. I., Rowell, D. P., Sylla, M. B., Diallo, I., Todzo, S., Toure, N. E., Camara, M., Ngatchah, B. N., Kane, N. A., Tall, L., and Affholder, F.: Changes in climate extremes over West and Central Africa at 1.5 ∘C and 2 ∘C global warming, Environ. Res. Lett., 13, 065020, https://doi.org/10.1088/1748-9326/aac3e5, 2018.
Djossou, M. L. D., Kodja, D. J., and Vissin, E. W.: Analyse de la Variabilité des Extrêmes Climatiques dans le Bassin Versant de la Pendjari à l'Exutoire de Porga au Bénin, Int. J. Prog. Sci. Technol., 22, 176–182, 2020.
Faye, C., Ndiaye, A., and Mbaye, I.: A comparative assessment of sequences of drought weather indices, by time scales and climate in Senegal areas, J. Water Environ. Sci., 1, 11–28, 2017.
Filahi, S., Mouhir, L., Tanarhte, M., and Tramblay, Y.: Tendance et variabilité des événements extrêmes au Maroc, XXVIIIe Colloque de l'Association Internationale de Climatologie, 1–4 Juillet 2015, Liège, Belgique, 463–468, 2015.
Fontaine, B., Janicot, S., and Monerie, P.: Recent changes in air temperature, heat waves occurrences and atmospheric circulation in Northern Africa, J. Geophys. Res., 118, 8536–8552, https://doi.org/10.1002/jgrd.50667, 2013.
Handmer, J., Honda, Y., Kundzewicz, Z. W., Arnell, N., Benito, G., Hatfield, J., Mohamed, I. F., Peduzzi, P., Wu, S. Sherstyukov, B., Takahashi, K., and Yan, Z.: Changes in impacts of climate extremes: human systems and ecosystems, in: Managing the Risks of Extreme Events and Disasters to Advance Climate Change Adaptation, edited by: Field, C. B., Barros, V., Stocker, T. F., Qin, D., Dokken, D. J., Ebi, K. L., Mastrandrea, M. D., Mach, K. J., Plattner, G.-K., Allen, S. K., Tignor, M., and Midgley, P. M., A Special Report of Working Groups I and II of the Intergovernmental Panel on Climate Change (IPCC), Cambridge University Press, Cambridge, UK, and New York, NY, USA, 231–290, 2012.
Hountondji, Y. C., De Longueville, F., and Ozer, P.: Trends in extreme rainfall events in Benin (West Africa), 1960–2000, Proceedings of the 1st International Conference on Energy, Environment and Climate Change, 26–27 August 2011, Ho Chi Minh City, Vietnam, available at: http://hdl.handle.net/2268/96112 (last access: 18 October 2021), 2011.
Karimou-Barke, M., Ambouta, K., Sarr, B., and Tychon, B.: Analyse des phénomènes climatiques extrêmes dans le Sud-Est du Niger, XXVIIIème Colloque de l'Association Internationale de Climatologie, 1–4 Juillet 2015, Liège, 537–542, 2015.
Kouakou, K. E., Kouadio, Z. A., Kouassi, F. W., Goula, B. T. A., and Savané, I.: Modélisation de la température et de la pluviométrie dans un contexte de changement climatique: cas de l'Afrique de l'Ouest, Afr. Sci., 10, 145–160, 2014.
Kouamé, Y. M., Soro, G. E., Kouakou, K. E., Kouadio, Z. A., and Meledje, N. E. H.: Scénarios des changements climatiques pour les précipitations et les températures en Afrique subsaharienne tropicale humide: Cas du bassin versant de Davo, Côte d'Ivoire, Larhyss Journal, 18, 197–213, 2014.
Kouassi, A. M., Kouamé, K. F., Koffi, Y. B., Djé, K. B., Paturel, J. E., and Oularé, S.: Analyse de la variabilité climatique et de ses influences sur les régimes pluviométriques saisonniers en Afrique de l'Ouest: cas du bassin versant du N'Zi (Bandama) en Côte d'Ivoire, Cybergéo: European Journal of Geography, Environnement, Nature, Paysage, 513, 1–29, https://doi.org/10.4000/cybergeo.23388, 2010.
Ly, M., Traoré, S. B., Alhassane, A., and Sarr, B.: Evolution of some observed climate extremes in the West African sahel, Weather Climate Extreme, 1, 19–25, https://doi.org/10.1016/j.wace.2013.07.005, 2013.
Mali, S. C., Shrivastava, P., and Thakare, H. S.: Impact of weather changes on sugarcane production, Res. Environ. Life Sci., 7, 243–246, 2014.
New, M., Hewiston, B., David, B., Tsiga, S. A., Kruger, A., Manhinsue, A., Gomez, B., Coelho, C. A. S. D., Masisi, N., Kalulanga, E., Bulane, E., Fortunata, L., Mdoka, M. L., and Lajoie, R.: Evidence of trends in daily climate extremes over southern and West Africa, J. Geophys. Res., 111, D14102, https://doi.org/10.1029/2005JD006289, 2006.
N'Guessan, B. V. H., Adjakpa, T. T., Allechy, F. B., Youan Ta, M., Assa, Y. F., and Affian, K.: Variabilité et prévision des extrêmes climatiques dans le bassin de la Lobo (Centre-Ouest de la Côte d'Ivoire): Apport des chaines de Markov et du générateur de temps mulgets, International Journal of Engineering Science Invention (IJESI), 9, 44–54, https://doi.org/10.35629/6734-0906024454, 2020.
Péné, C. B. and Assa, A. D.: Variations interannuelles de la pluviométrie et de l'alimentation hydrique de la canne à sucre en Côte d'Ivoire, Sécheresse, 14, 43–52, https://doi.org/10.1029/2005JD006289, 2003.
Péné, C. B., Ouattara, M. H., and Koulibaly, S. G.: Late season sugarcane performance as affected by soil water regime at the yield formation stage on commercial farms in northern Ivory Coast, 19th World Congress of Soil Science, Soil Solutions for a Changing, World, 1–5 August, Brisbane, Queensland, Australia, 2010.
Saithanu, K., Sittisom, P., and Mekparyup, J.: Estimation of Sugar Cane Yield in the Northeast of Thailand with MLR Model, Burapha Sci. J., 22, 197–201, 2017.
Santos, C. A. C. D., Neale, C. M. U., Rao, T. V. R., and Silva, B. B. D.: Trends in indices for extremes in daily temperature and precipitation over Utah, USA, Int. J. Climatol., 31, 813–1822, https://doi.org/10.1002/joc.2205, 2010.
Soro, T. D., Kouakou, B. D., Kouassi, E. A., Soro, G., Kouassi, A. M., Kouadio, K. E., Yéi, M.-S. O., and Soro, N.: Hydroclimatologie et dynamique de l'occupation du sol du bassin versant du Haut Bandama à Tortiya (Nord de la Côte d'Ivoire), VertigO, 13, 1–22, https://doi.org/10.4000/vertigo.14468, 2013.
Wilhite, D. A.: Drought as a Natural Hazard: Concepts and Definitions. Drought: A Global Assessment Routledge, London, UK, 2000.
WMO: Troisième conférence mondiale sur le climat, Bulletin de l'OMM, 58, 139–223, 2009.
Yapo, A. L. M., Diawara, A., Yoroba, F., Kouassi, K. B., Sylla, B. M., Kouadio, K., Odoulami, R. C., and Tiémoko, T. D.: Twenty-First Century Projected Changes in Extreme Temperature over Côte d'Ivoire (West Africa), Int. J. Geophys., 1–19, https://doi.org/10.1155/2019/5610328, 2019.
Yapo, A. L. M., Diawara, A., Kouassi, B. K., Yoroba, F., Sylla, M. B., Kouadio, K., Tiémoko, D. T., Koné, D. I., Akobé, E. Y., and Yao, K. P. A. T.: Projected changes in extreme precipitation intensity and dry spell length in Côte d'Ivoire under future climates, Theor. Appl. Climatol., 140, 871–889, https://doi.org/10.1007/s00704-020-03124-4, 2020.
Zhang, X. and Yang, F.: RClimDex (1.0): User Manual, Climate Research Branch Environment Canada, Downsview, Ontario, Canada, 23 pp., 2004.