the Creative Commons Attribution 4.0 License.
the Creative Commons Attribution 4.0 License.
 | 16 Nov 2021
Estimation of dry events duration in Northern Tunisia – Analysis of extremes trends
Majid Mathlouthi
Fethi Lebdi
Modeling of extremes dry spells in Northern Tunisia, in order to detect the severity of the phenomenon, is carried out. Dry events are considered as a sequence of dry days (below a threshold) separated by rainfall events from each other. The maximum dry event duration follows the Generalized Extreme Value distribution. The data series adherence to the probability distribution was verified by the Anderson-Darling test. The positive trend and non-stationarity of dry spells was verified respectively by the Mann–Kendall test and Dickey–Fuller and augmented Dickey–Fuller tests. The irregular distribution of rainfall in the growing season for Sidi Abdelbasset station has increased the number of dry spells. The increase of rainy days in Ghézala dam and Sidi Salem gauge stations resulted in a decrease of dry spells in this area. Regarding the return period of one year (wet season), dry events occurred from 14 to 27 d in this region constitute an agricultural potential risk. The Southern region was the most vulnerable.
- Article
(1329 KB) - Full-text XML
- BibTeX
- EndNote


Although northern Tunisia is subhumid, the rainfall is not uniformly distributed in all seasons. The phenomenon of drought during the rainy season is recurring. Worldwide, scientific research into rainfall modeling is active. The results are useful in planning and management of water resources. Several authors have used different statistical distributions to model the dry spell occurrence. Lana et al. (2006) used the extreme value distribution. The Gamma distribution in Dan'azumi and Shamsudin (2011); the Geometric distribution in Mahamud et al. (2011), Log-Normal distribution in Dan'azumi and Shamsudin (2011), the Pareto distribution in Lana et al. (2006) and the Negative Binomial distribution in Mathlouthi and Lebdi (2009).
The objective of this study was to model the occurrence of extreme dry events in Ichkeul Lake basin of Tunisia and to estimate the return period and the severity of the phenomenon.
The data used in this analysis are the daily rainfall data that spans for 37 to 60 years of five rain gauges (Table 1) located in the Ichkeul lake basin Northern Tunisia (Fig. 1) collected from the Directorate General of Water Resources in Tunisia. The rainy season starting at September and lasting until April. The average annual rainfall is 600 mm. The dry season lasts from May to August. Daily values of precipitation are quite variable. There is also considerable variation from year to year.
Table 1Mann–Kendall test and Sen's slope for the maximum yearly dry spell length for Ichkeul lake basin.
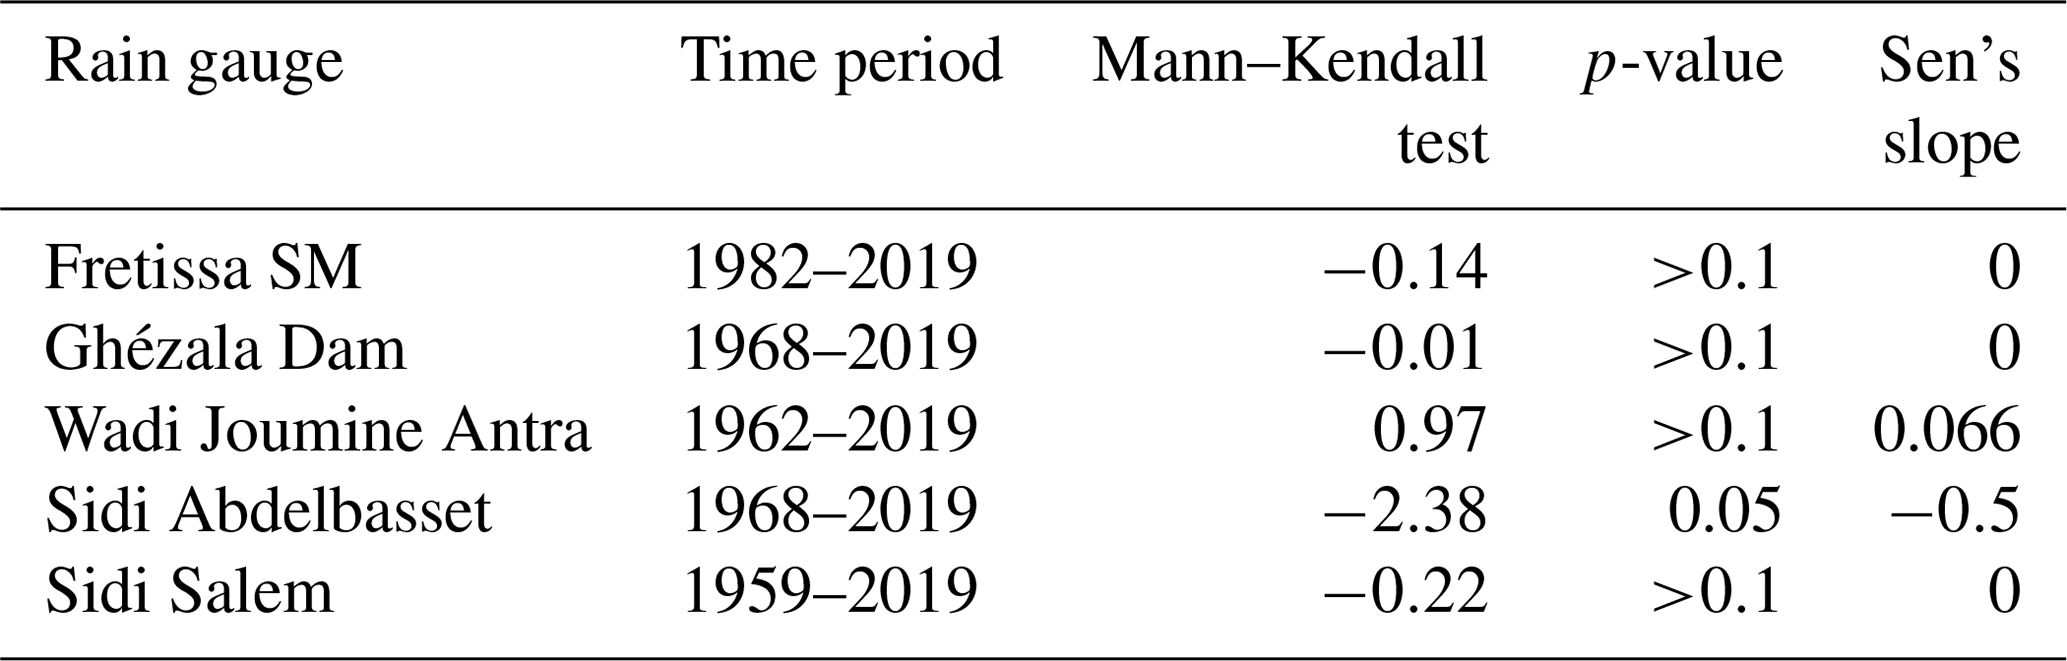

Figure 1The Ichkeul Lake Basin and the location of gauge stations (the names and the time periods are listed in Table 1).
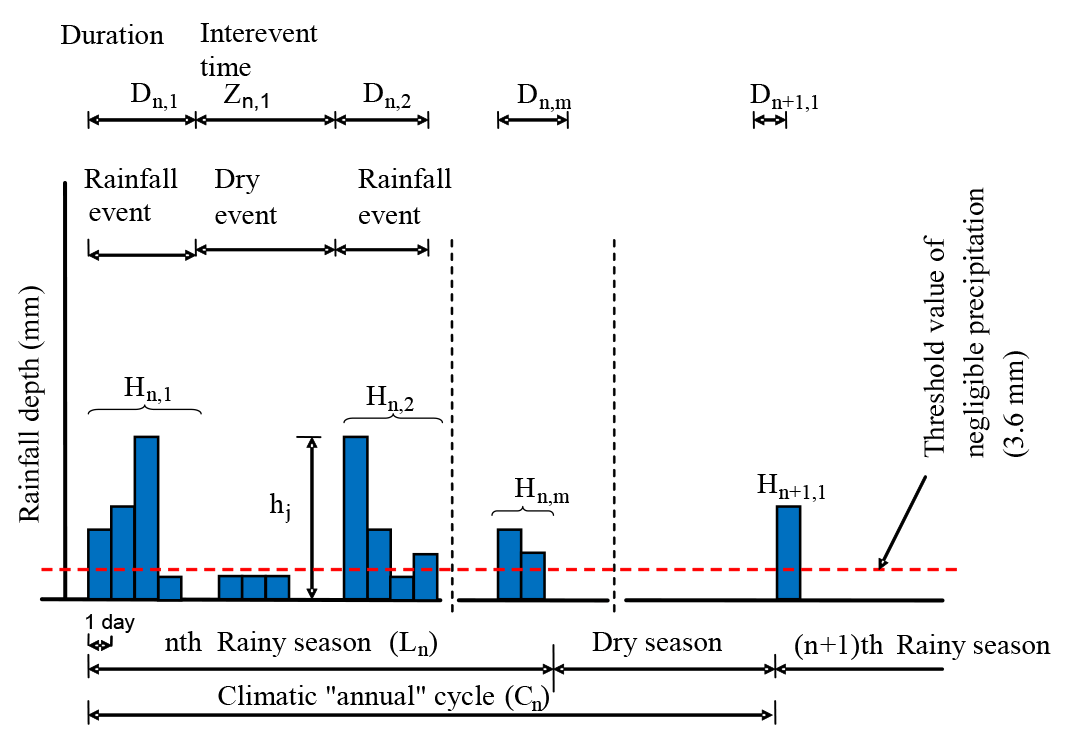
A rainfall event is an uninterrupted sequence of rainy days including at least one rainy day with rainfall greater than 3.6 mm. This rainfall threshold value (3.6 mm) equal the expected daily evapotranspiration rate, marking the lowest physical limit for considering rainfall that may produce utilizable surface water resources (Mathlouthi and Lebdi, 2020). The rainfall event m in a given rainy season n will be characterized by its duration Dn,m, the temporal position within the rainy season, the dry event Zn,m and by the cumulative rainfall amounts of Hn,m of Dn,m rainy days in mm (Fig. 2). The rainy season (of variable duration, Ln) is defined as the time spans between the start of the first and the end of the last rainfall event (Fig. 2). We extract Nn rainfall events (variable depending on the year) per rainy season n, and then the number of dry events will be Nn−1. For the set of dry spells calculated for each rainfall station, the maximum number of dry spell duration per year was used.
In this work, four models, generalized extreme value distributions (GEV), Lognormal, Pareto and Gamma distributions were fitted to the observed values − obtained.
To test if a sample of data came from a population with a specific distribution, the Anderson-Darling test (Stephens, 1974) is used, using SPC for Excel package (Buttrey, 2009). The Anderson-Darling test is defined as: H0: the data follow a specified distribution, Ha: the data do not follow the specified distribution (NIST/SEMATECH, 2013).
To verify the no systematic variations in the observed period, the nonparametric Mann–Kendall test proposed by Mann (1945) and improved by Hirsch and Slack (1984), is the most widely used.
To test the stationarity of the observed series, the unit root test was applied (Dickey and Fuller, 1981). The return period of the maximum annual dry spell duration was estimated by (Carvalho et al., 2013):
Where F(x) is the cumulative probability of occurrence of a given value of the maximum dry spell duration and denominator is the average sample frequency of the annual dry spell maximum duration.
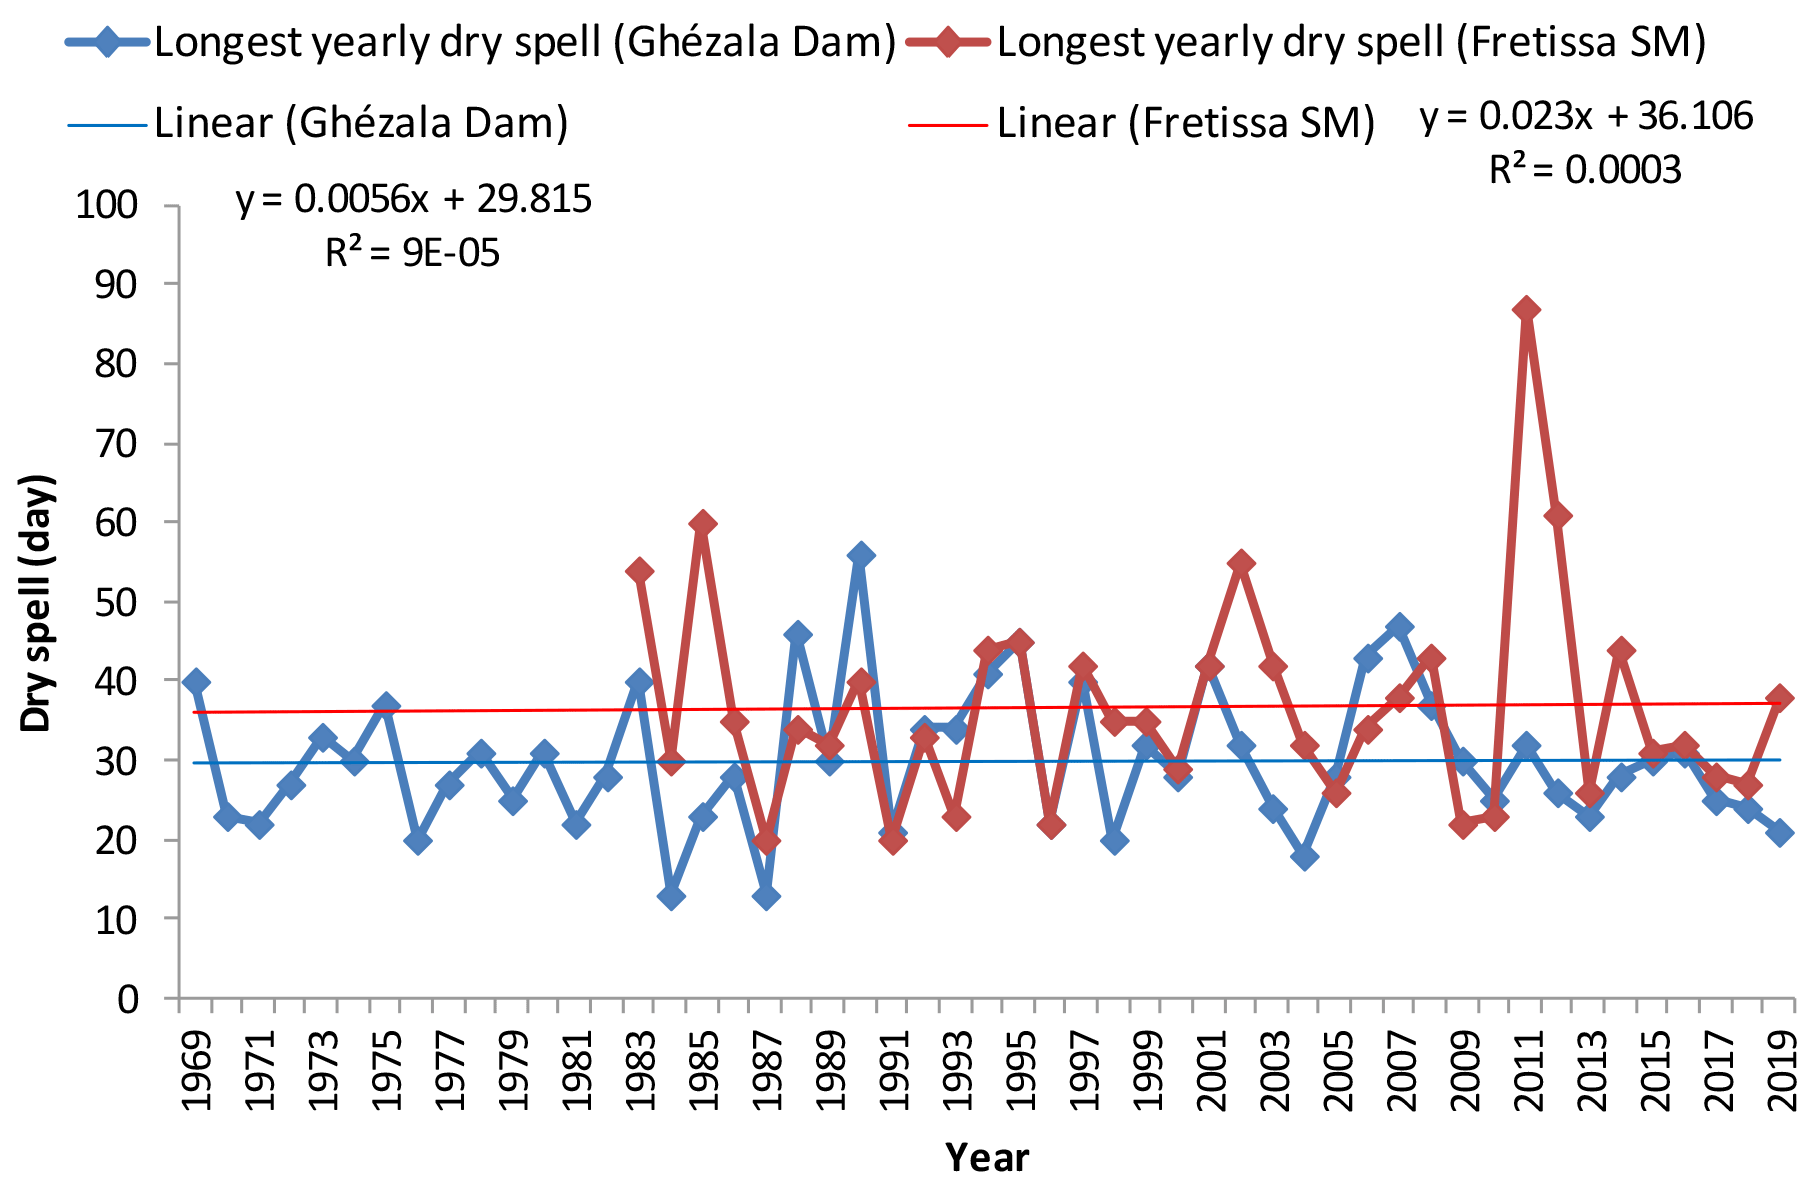
Figure 3 shows the maximum annual dry spells observed for this basin during the rainy season (growing season). There is a slightly increased trend in the annual maximum dry spell of the Ghézala dam and Fretissa SM (Meteorological Station) stations. For medium and early crop cycles, the increasing trend increases the risks for productivity losses, particularly for corn.
The statistical trend obtained can be seen in Table 1 which shows the results of applying the nonparametric Mann–Kendall test. For four stations, the calculated p-value is more than the significance level (α=0.05), the null hypothesis (H0: there is no trend in the series) should not be rejected in favour of the alternative hypothesis (HA: there is a positive trend in the series). The risk of rejecting the null hypothesis when it is true is greater than 10 %. As the calculated p-value for Sidi Abdelbasset station is less than the significance level (α=0.05), the null hypothesis H0 should be rejected in favour of the alternative hypothesis HA. The risk of rejecting the null hypothesis when it is true is 0.05 %.
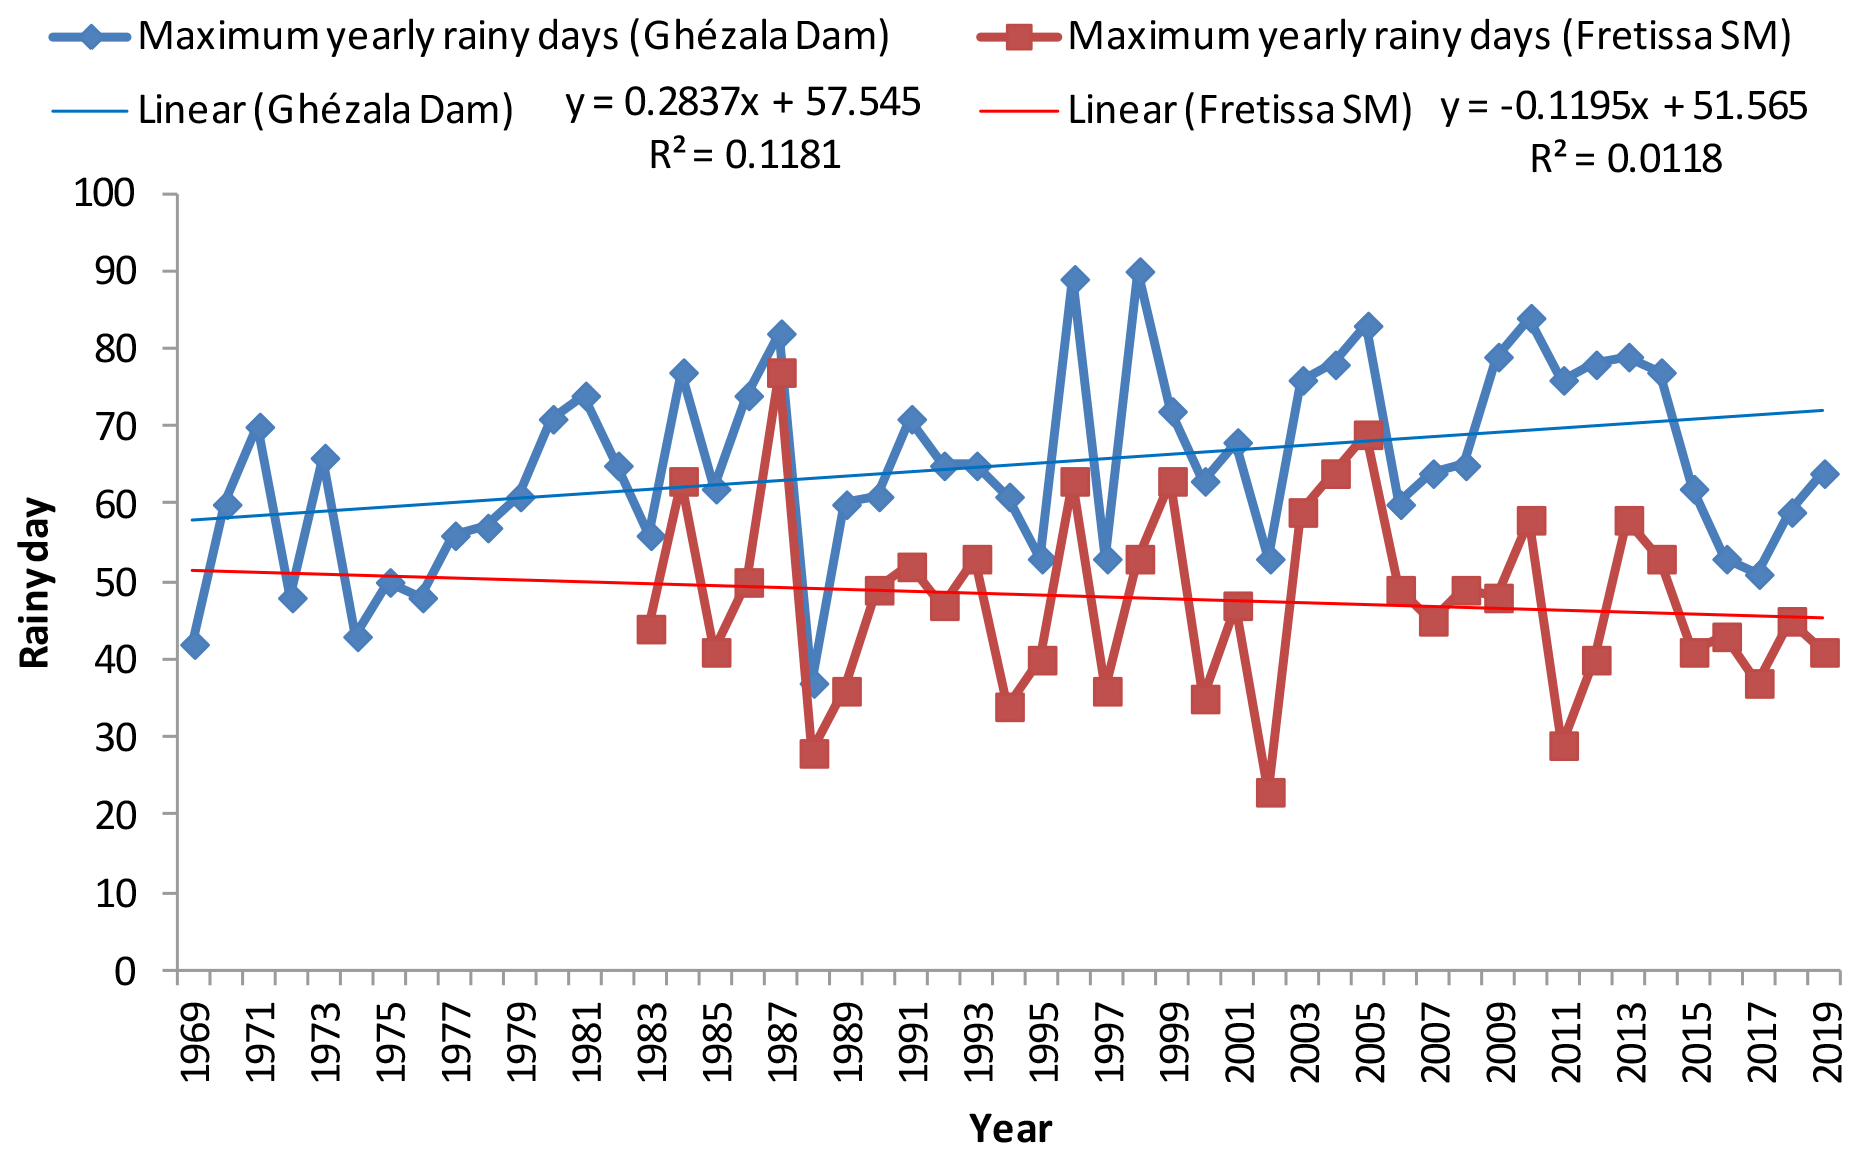
The rainfall event duration for each rain gauge was calculated and the maximum yearly non-consecutive rainy days for the growing season can be seen visually in Fig. 4. There is an increasing trend in the number of rainy days for Ghézala Dam station.
Table 2 shows the descriptive statistics for the maximum yearly rainy days for the region. The data series seen here presents similar mean values for the Fretissa SM and Sidi Abdelbasset in southern region and Wadi Joumine Antra and Sidi Salem in West and Est respectively. However the dispersion around the mean being greater for the Fretissa SM station. The average for the maximum yearly rainy days increases around 61 % for the Ghézala dam in relation to Sidi Abdelbasset. The dispersion around the mean can be considered low.
Table 2Descriptive statistics for the maximum yearly rainy days at growing time.

The statistical confirmation of the trend obtained visually in Fig. 4 can be seen in Table 3 where the results of applying the nonparametric Mann–Kendall test. As the p-value calculated for the Ghézala Dam and Sidi Salem rain gauge is less than the significance level (α=0.05), the null hypothesis (H0:) is rejected in favor of the alternative hypothesis (HA). The risk of rejecting the null hypothesis when it is true for Ghézala Dam and Sidi Salem northern region is respectively 0.05 % and 0.01 %. For the others stations (other areas), the p-value is greater than calculated, so the null hypothesis should not be rejected with a risk >10 %.
Table 3Mann–Kendall test and Sen's slope for the maximum number of rainy days at growing time.
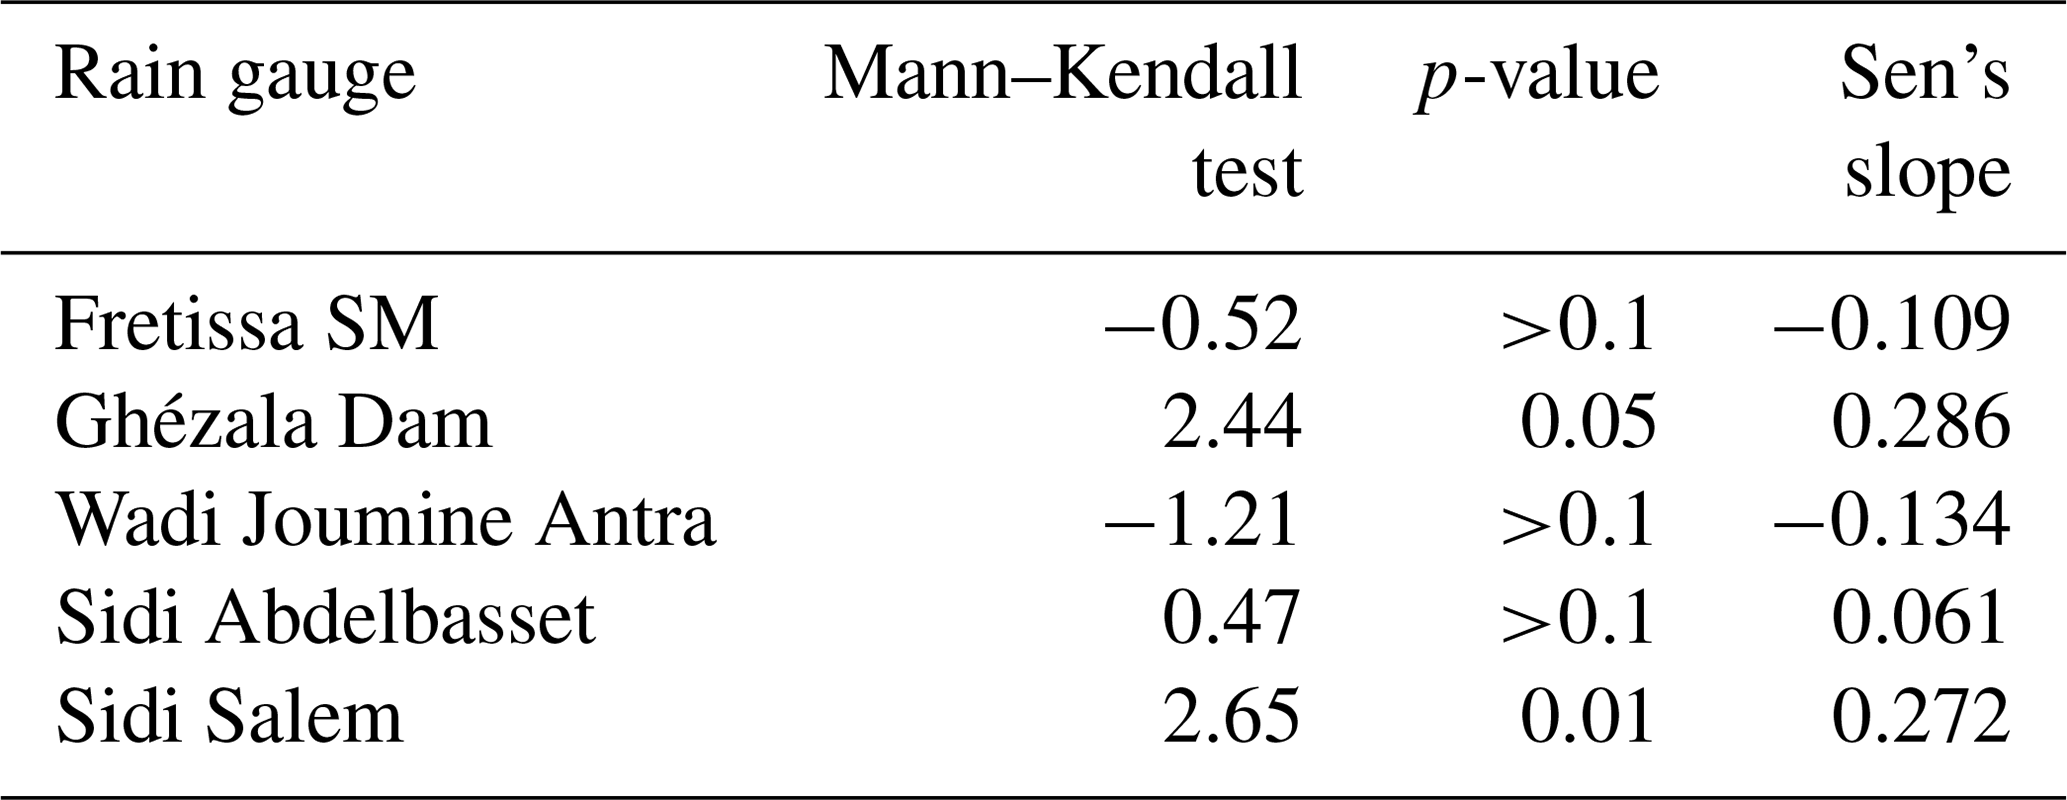
Table 4Maximum likelihood estimation of the Anderson-Darling statistic for Ichkeul lake basin.

As the value of maximum yearly rainy days for the growing period is increasing significantly in Ghézala dam and Sidi Salem rain gauges, there is no trend in the maximum yearly dry spell length in these stations. As there is no significant trend in the series of maximum yearly rainy days for Sidi Abdelbasset in southern region, the increasing maximum number of dry spell length is associated with the uneven distribution of rainfall in the growing period for this area.
Table 4 presents the result of Anderson-Darling statistic adherence test to check the degree of adjustment of the x variables series to the probability density function of the selected distributions, obtained by the maximum likelihood estimation (MLE) technique. Table 4 shows that the Generalized Extreme Value distribution that best describes the frequency of occurrence of the annual values of maximum periods of dry spell with the lowest values of AIC for α=5 %. AIC compares the relative “quality” of a model versus the other models. The distribution with the smallest AIC value is usually the preferred model (Mohammed et al., 2015).
The non-stationarity was rejected by the Dickey–Fuller test (DF) and Dickey–Fuller augmented test (ADF) (Dickey and Fuller, 1981), through the use of the autoregressive procedure of EViews 11 software (IHS Global Insight, 2017) using Unit Root Test (Table 5).
Table 5The Dickey–Fuller test and the Dickey–Fuller augmented test (ADF).

At 5 % significance level, the probabilities obtained are lower indicating therefore that the series with the maximum dry spell length values are apparently stationary, that is, the classical statistical assumptions remain valid. The results of the augmented Dickey–Fuller test reported in Table 5, show that the inclusion of parameters for the stations does not change at the 5 % significance level. The test confirms in this case there is no unit root.
The preceding analysis is a support for the use of the extreme value theory in describing the frequencies of occurrence of the maximum annual dry spells values for the studied region.
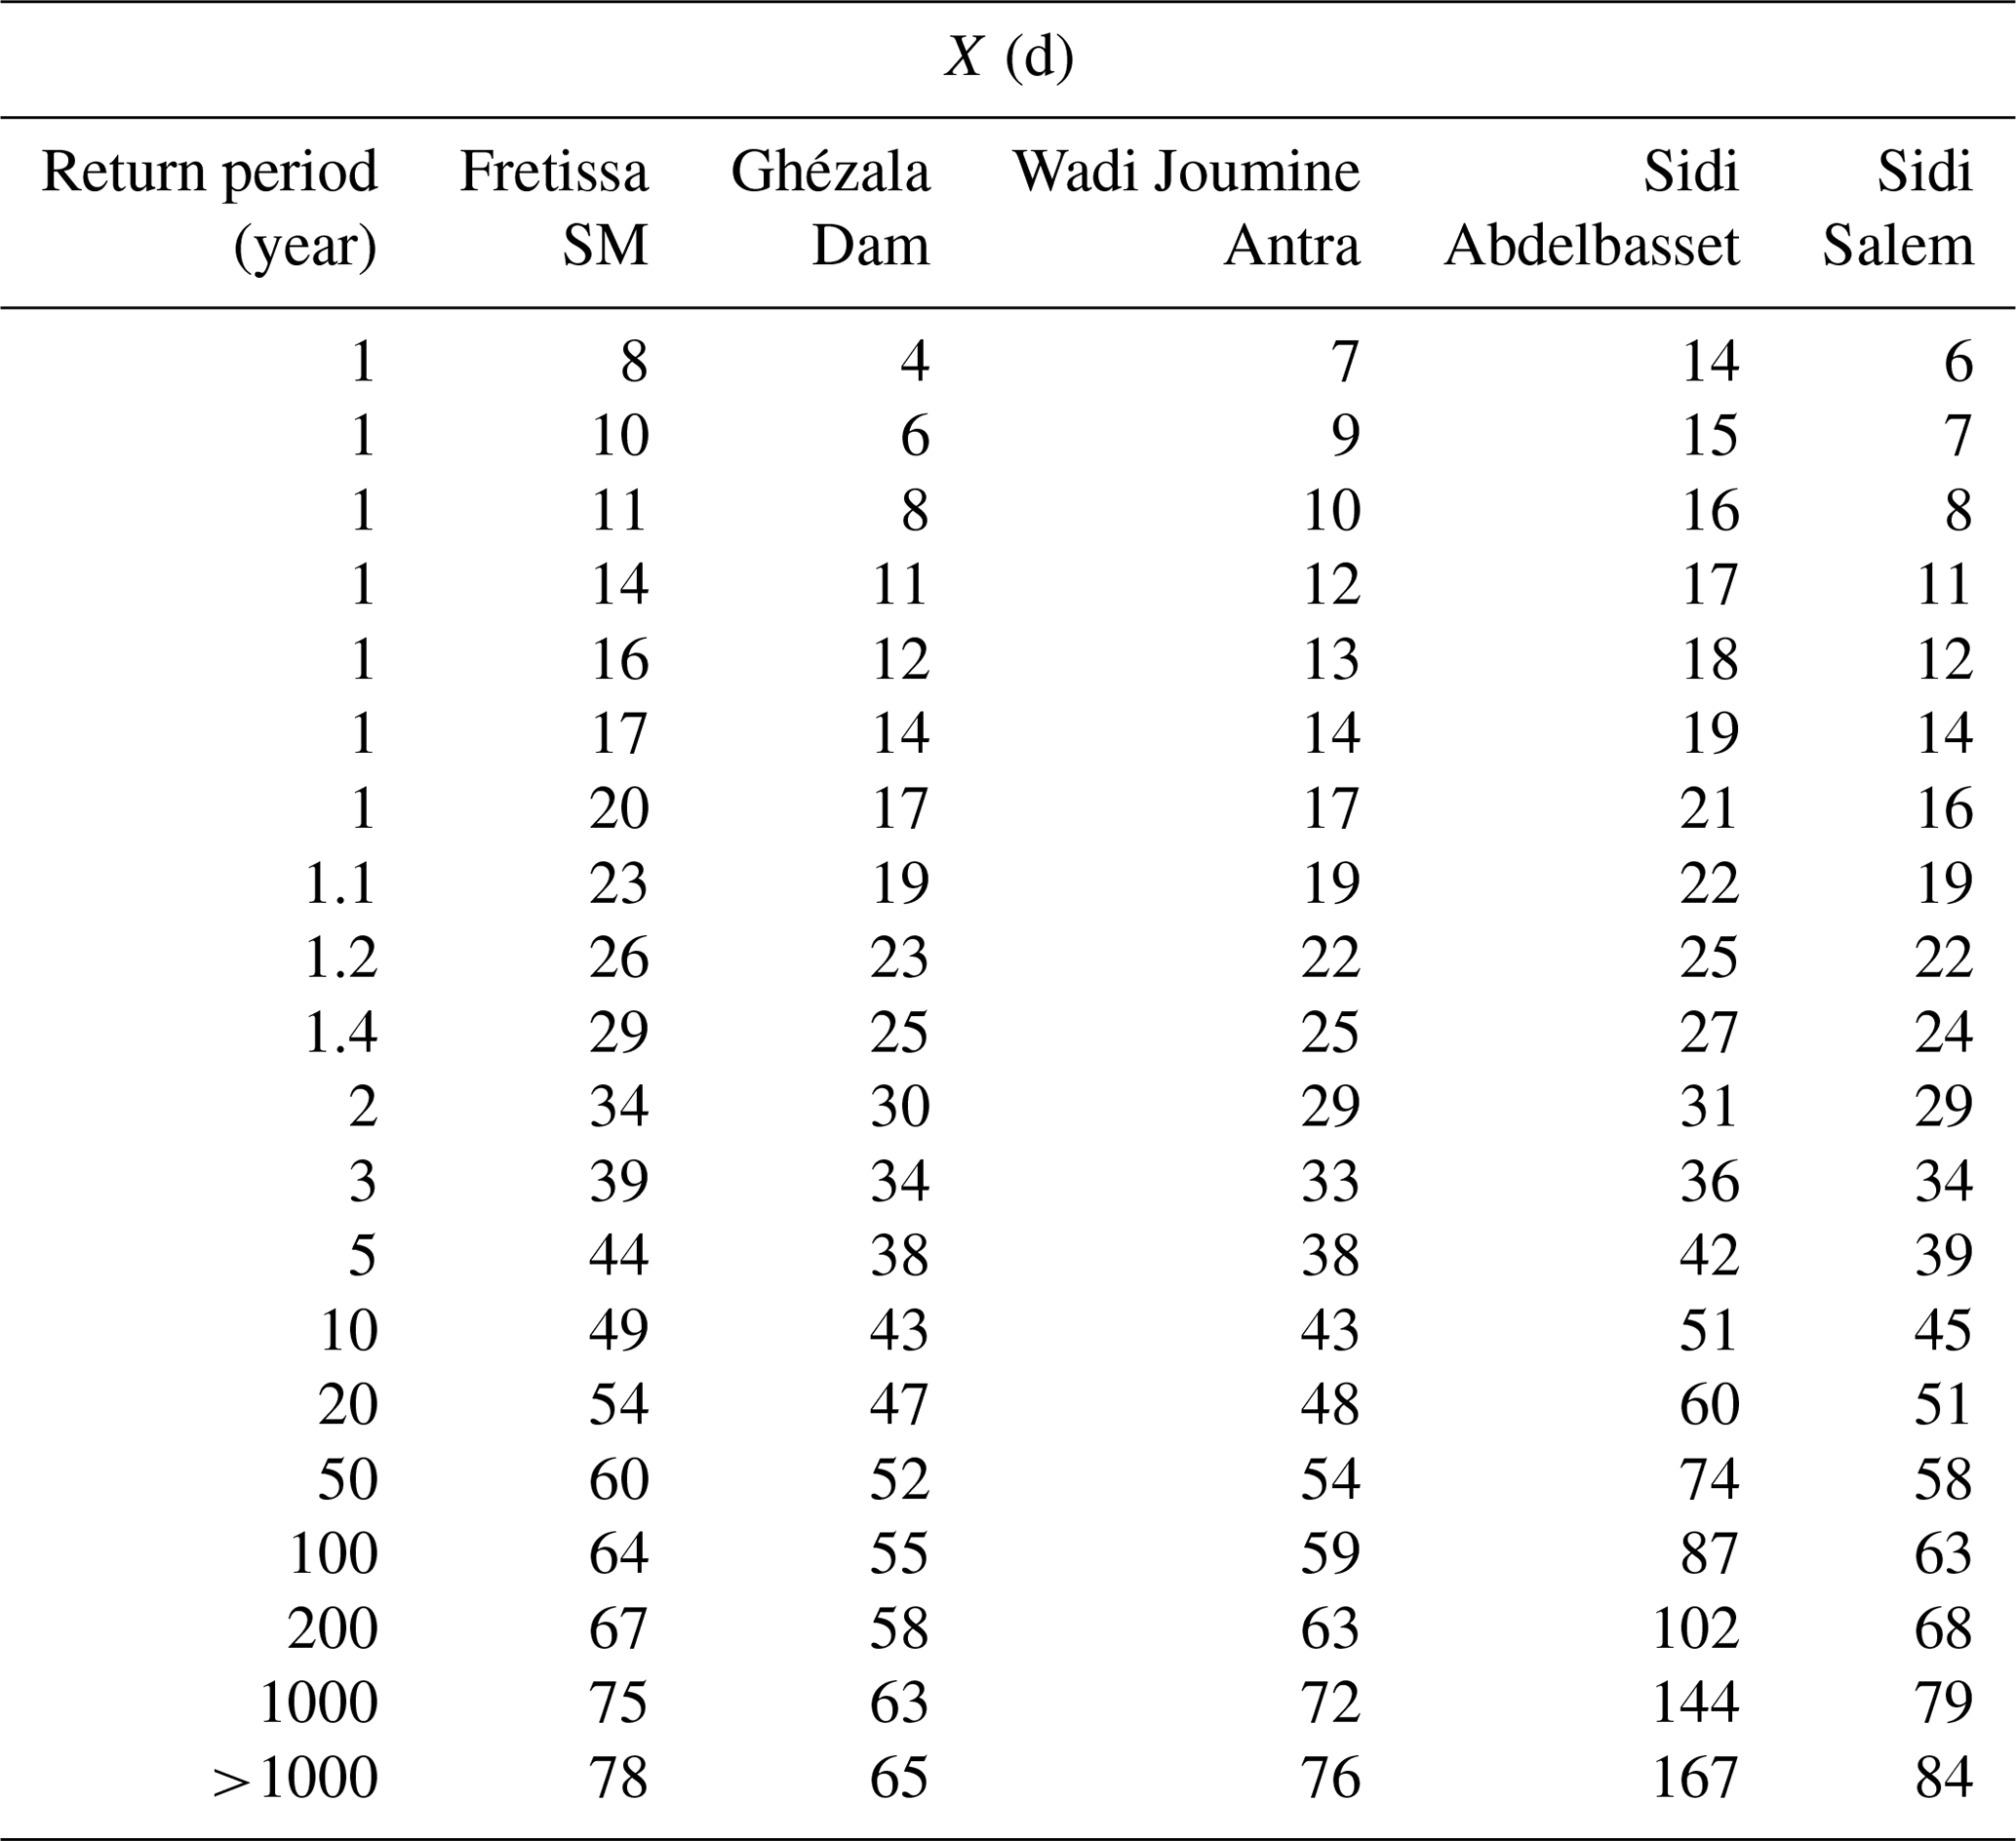
It can be seen in Table 6 that Sidi Abdelbasset station has a higher dry spells than the other stations. For a 60 d dry spell, the return periods for Sidi Abdelbasset, Fretissa SM and Sidi Salem stations at the agricultural growing season are respectively 20, 50 and 72 years. However, dry spells over as little as 21 d can cause reduced productivity, and for a return period of one year, it is possible to have an occurrence of dry spells between 14 and 27 d in Sidi Abdelbasset station. This situation, happening during grain filling season, increases the productivity losses for this region. The dry spell length for the return period of one year is higher in Sidi Abdelbasset and Fretissa SM stations respectively, both situated in southern region. Otherwise, this southern region is the most exposed to the risk of agricultural losses due to periods of drought for a return period of one year. If the dry spell duration is from 40 to 50 d, also the most vulnerable is this region. The observed maximum dry spell length for the return period of 10 years in the Southest was 49–51 d while in the Middle it was 43–45 d. So the gradient is North South.
Table 6Return period (years) for Ichkeul lake basin based on the maximum annual period of dry spell during the growing season.
The dry spell length increased in growing seasons for the Sidi Abdelbasset station and decreased in the other stations. Although the number of rainy days has increased in the growing season for the Ghézala dam and Sidi Salem stations, the distribution of rainfall in the Mideast is irregular at growing time. The result for time series with fewer years, indicate that the irregularity in the distribution of rainfall for this region has intensified in recent years. The average number of rainy days in the growing season for Ghézala Dam is 36 % to 61 % higher than for the South region.
For all distributions studied, the generalized extreme value distribution was the best fit to the data series of dry spell duration for the five stations.
It has been showed that 14–27 d dry spell durations occur in return period of one year for the series analyzed from 1968 to 2019. Previous works clearly show that 40–43 d dry spell durations were observed in return periods of 10 years (Mathlouthi and Lebdi, 2009). The dry spells duration become more frequent in recent years, throughout the region.
The data are printed in paper documents stored (archived) in office of the General Directorate of Water Resources and the Division of Dam Operation of Extreme North and Ichkeul of the Ministry of Agriculture of Tunisia, (http://www.agriculture.tn/, Ministry of Agriculture of Tunisia, 2021). These data are the property of this organization, and are available in situ.
MM collected and analyzed the data, developed the main idea, performed the calculations, discussed the results and wrote the manuscript; FL contributed results discussion and revised manuscript.
The contact author has declared that neither they nor their co-author have any competing interests.
Publisher’s note: Copernicus Publications remains neutral with regard to jurisdictional claims in published maps and institutional affiliations.
This article is part of the special issue “Hydrology of Large River Basins of Africa”. It is a result of the 4th International Conference on the ”Hydrology of the Great Rivers of Africa”, Cotonou, Benin, 13–20 November 2021.
The authors acknowledge the help of General Directorate of Water Resources and Division of Dam Operation of Extreme North and Ichkeul of the Ministry of Agriculture of Tunisia. The authors thank the reviewers for their relevant remarks that contributed to the improvement of this article.
Buttrey, S. E.: An Excel Add-In for Statistical Process Control Charts, J. Stat. Softw., 30, 1–12, https://doi.org/10.18637/jss.v030.i13, 2009.
Carvalho, J. R. P., Assad, E. D., Evangelista, S. R. M., and Pinto, H. S.: Estimation of dry spells in three Brazilian regions – Analysis of extremes, Atmos. Res., 132–133, 12–21, https://doi.org/10.1016/j.atmosres.2013.04.003, 2013.
Dan'azumi, S. and Shamsudin, S.: Modeling the distribution of inter-event dry spell for peninsular Malaysia, J. Appl. Sci. Res., 7, 333–339, https://doi.org/10.1007/s00704-010-0254-2, 2011.
Dickey, D. A. and Fuller, W. A.: Likelihood ratio statistics for autoregressive time series with a unit root, Econometrica, 49, 1057–1072, https://doi.org/10.2307/1912517, 1981.
Hirsch, R. M. and Slack, J. R.: A nonparametric trend test for seasonal data with serial dependence, Water Resour. Res., 20, 727–732, https://doi.org/10.1029/WR020i006p00727, 1984.
IHS Global Insight: The EViews 10 Demo, 2nd edn., ISBN 978-1-880411-43-8 , available at: http://www.eviews.com (last access: 20 October 2021), 2017.
Lana, X., Martínez, M. D., Burgueno, A., Serra, C., Martínez-Vide, J., and Gómez, L.: Distributions of long dry spells in the Iberian Peninsula, years 1951–1990, Int. J. Climatol. 26, 1999–2021, https://doi.org/10.1002/joc.1354, 2006.
Mahamud, N., Deni, S. M., and Jemain, A. A.: Probability models for distribution of weekly dry and wet spells in Sabah and Sarawak, J. Stat. Model. Anal., 2, 34–44, 2011.
Mann, H. B.: Nonparametric tests against trend, Econometrica, 13, 245–259, https://doi.org/10.2307/1907187, 1945.
Mathlouthi, M. and Lebdi, F.: Analyse statistique des séquences sèches dans un bassin du nord de la Tunisie, Hydrol. Sci. J., 54, 442–455, https://doi.org/10.1623/hysj.54.3.442, 2009.
Mathlouthi, M. and Lebdi, F.: Estimating extreme dry spell risk in Ichkeul Lake Basin (Northern Tunisia): a comparative analysis of annual maxima series with a Gumbel distribution, Proc. IAHS, 383, 241–248, https://doi.org/10.5194/piahs-383-241-2020, 2020.
Ministry of Agriculture of Tunisia: Homepage, available at: http://www.agriculture.tn/, last access: 20 October 2021.
Mohammed, E. A., Naugler, C., Far, B. H.: Emerging business intelligence framework for a clinical laboratory through big data analytics, in: Emerging trends in computational biology, bioinformatics, and systems biology, edited by: Tran, Q. N. and Arabnia, H., Elsevier/Morgan Kaufmann, New York, USA, 577–602, 2015.
NIST/SEMATECH: e-Handbook of Statistical Methods, https://doi.org/10.18434/M32189, 2013.
Stephens, M. A.: EDF Statistics for Goodness of Fit and Some Comparisons, J. Am. Stat. Assoc., 69, 730–737, https://doi.org/10.2307/2286009, 1974.