the Creative Commons Attribution 4.0 License.
the Creative Commons Attribution 4.0 License.
 | 16 Nov 2021
Heavy rainfall frequency analysis in the Benin section of the Niger and Volta Rivers basins: is the Gumbel's distribution a one-size-fits-all model?
Audrey Adango
Jean Hounkpè
Aymar Bossa
Yacouba Yira
Eliezer Iboukoun Biao
Julien Adounkpè
Eric Alamou
Luc Ollivier C. Sintondji
Abel Akambi Afouda
West African populations are increasingly exposed to heavy rainfall events which cause devastating floods. For the design of rainwater drainage facilities (to protect populations), practitioners systematically use the Gumbel distribution regardless of rainfall statistical behaviour. The objective of this study is twofold. The first is to update existing knowledge on heavy rainfall frequency analysis in West Africa to check whether the systematic preference for Gumbel's distribution is not misleading, and subsequently to quantify biases induced by the use of the Gumbel distribution on stations fitting other distributions. Annual maximum daily rainfall of 12 stations located in the Benin sections of the Niger and Volta Rivers' basins covering a period of 96 years (1921–2016) were used. Five statistical distributions (Gumbel, GEV, Lognormal, Pearson type III, and Log-Pearson type III) were used for the frequency analysis and the most appropriate distribution was selected based on the Akaike (AIC) and Bayesian (BIC) criteria. The study shows that the Gumbel's distribution best represents the data of of the stations studied, while the remaining of the stations fit better GEV, Lognormal, and Pearson type III distributions. The systematic application of Gumbel's distribution for the frequency analysis of extreme rainfall is therefore misleading. For stations whose data best fit the other distributions, annual daily rainfall maxima were estimated both using these distributions and the Gumbel's distribution for different return periods. Depending on the return period, results demonstrate that the use of the Gumbel distribution instead of these distributions leads to an overestimation (of up to +6.1 %) and an underestimation (of up to −45.9 %) of the annual daily rainfall maxima and therefore to an uncertain design of flood protection facilities. For better validity, the findings presented here should be tested on larger datasets.
- Article
(3356 KB) - Full-text XML
- BibTeX
- EndNote


Climate change is one of the greatest challenges of the 21st century. In West Africa, extreme hydroclimatic events such as heavy rainfall, floods and droughts severely impact populations and socio-economic development (Amoussou et al., 2014). Since the late 2000s, most West African countries are experiencing unprecedented flooding events (Badou et al., 2019). Ouagadougou, the largest city of Burkina Faso, was struck by extreme rainfall on the 1 September 2009 causing the death of nine persons, and losses estimated to be more than USD 14 million. That very year 2019, Dakar in Senegal, and Lomé in Togo recorded heavy rainfall events with comparable damages. The following year, in 2010, Benin, Cote d'Ivoire and Niger recorded extreme devastating floods. Benin, for example, was severely struck with 680 000 people affected and 46 deaths (World Bank, 2011). While the construction of rainwater drainage facilities is a common measure to control rainfall-induced floods, the design of such facilities is rainfall characteristic-dependent and requires a good knowledge of associated statistical distribution. In this perspective, frequency analysis of heavy rainfall must guide the selection of the best statistical distribution (e.g. Agué and Afouda, 2015; Goubanova and Li, 2007; Habibi et al., 2013; Hamzaoui, 2016; Ousmane, 1992; St-hilaire, 2007). Notwithstanding, based on expert elicitation, most civil engineers in West Africa systematically use the Gumbel distribution to design rainwater drainage systems regardless of rainfall statistical behaviour. Previous works on frequency analysis of heavy rainfall in West Africa have demonstrated the “suitability” of the Gumbel distribution for regions of high rainfall regime (Goula Bi Tie et al., 2007) and the majority of investigated stations (Agué and Afouda, 2015) seem to have supported that practice of civil engineers. However, given the high spatial and temporal rainfall variability of the West African region, are these previous findings still valid? For example, the analysis of Goula Bi Tie et al. (2007) covered the period 1947–1995 and that of Agué and Afouda (2015) the period 1921–2001; both periods not including the decades the 2000s and 2010s characterised by the increase in the frequency and magnitude of heavy rainfall (Hounkpè et al., 2016). Recent heavy rainfall frequency analyses in the Ouémé River Basin (Kodja, 2018) and the Oti River Basin (Koungbanane et al., 2020) considered the 2000s and 2010s but were limited to the GEV distribution in the case of the Oti River Basin and Gumbel, GEV, and Pearson type III distribution in the case of the Ouémé River Basin. To guide the design of drainage water facilities and provide an alternative to civil engineers who systematically use Gumbel distribution, this study takes stock from the previous ones to: (i) update existing knowledge on heavy rainfall frequency analysis in West Africa, (ii) quantify biases induced by the systematic use of the Gumbel distribution. Northern Benin, a region of transition between the Guinean and Sahelian rainfall regimes is chosen as a case study.
2.1 Research area
The study area is located in the northern part of Benin between latitudes 10∘ and 12∘30′ N and longitudes 1∘ and 3∘40′ E. With a total area of 57 093 km2, it consists of the Beninese portion of the Niger River Basin (39 726 km2) and that of the Volta River Basin (17 367 km2) (Fig. 1). The rainfall regime is uni-modal of the Sudanian type with a single rainy season from April to October. Average annual rainfall varies between 700 and 1100 mm (Badou et al., 2015). On a seasonal scale, rainfall variability is characterized by a high concentration of rainfall in August sometimes causing devastating flooding (MEHU, 2011). The latest census in Benin amounted the population of the study area to about 2 031 534 (INSAE, 2016) whose mainly rely on rainfed agriculture and ruminant breeding for their livelihoods.
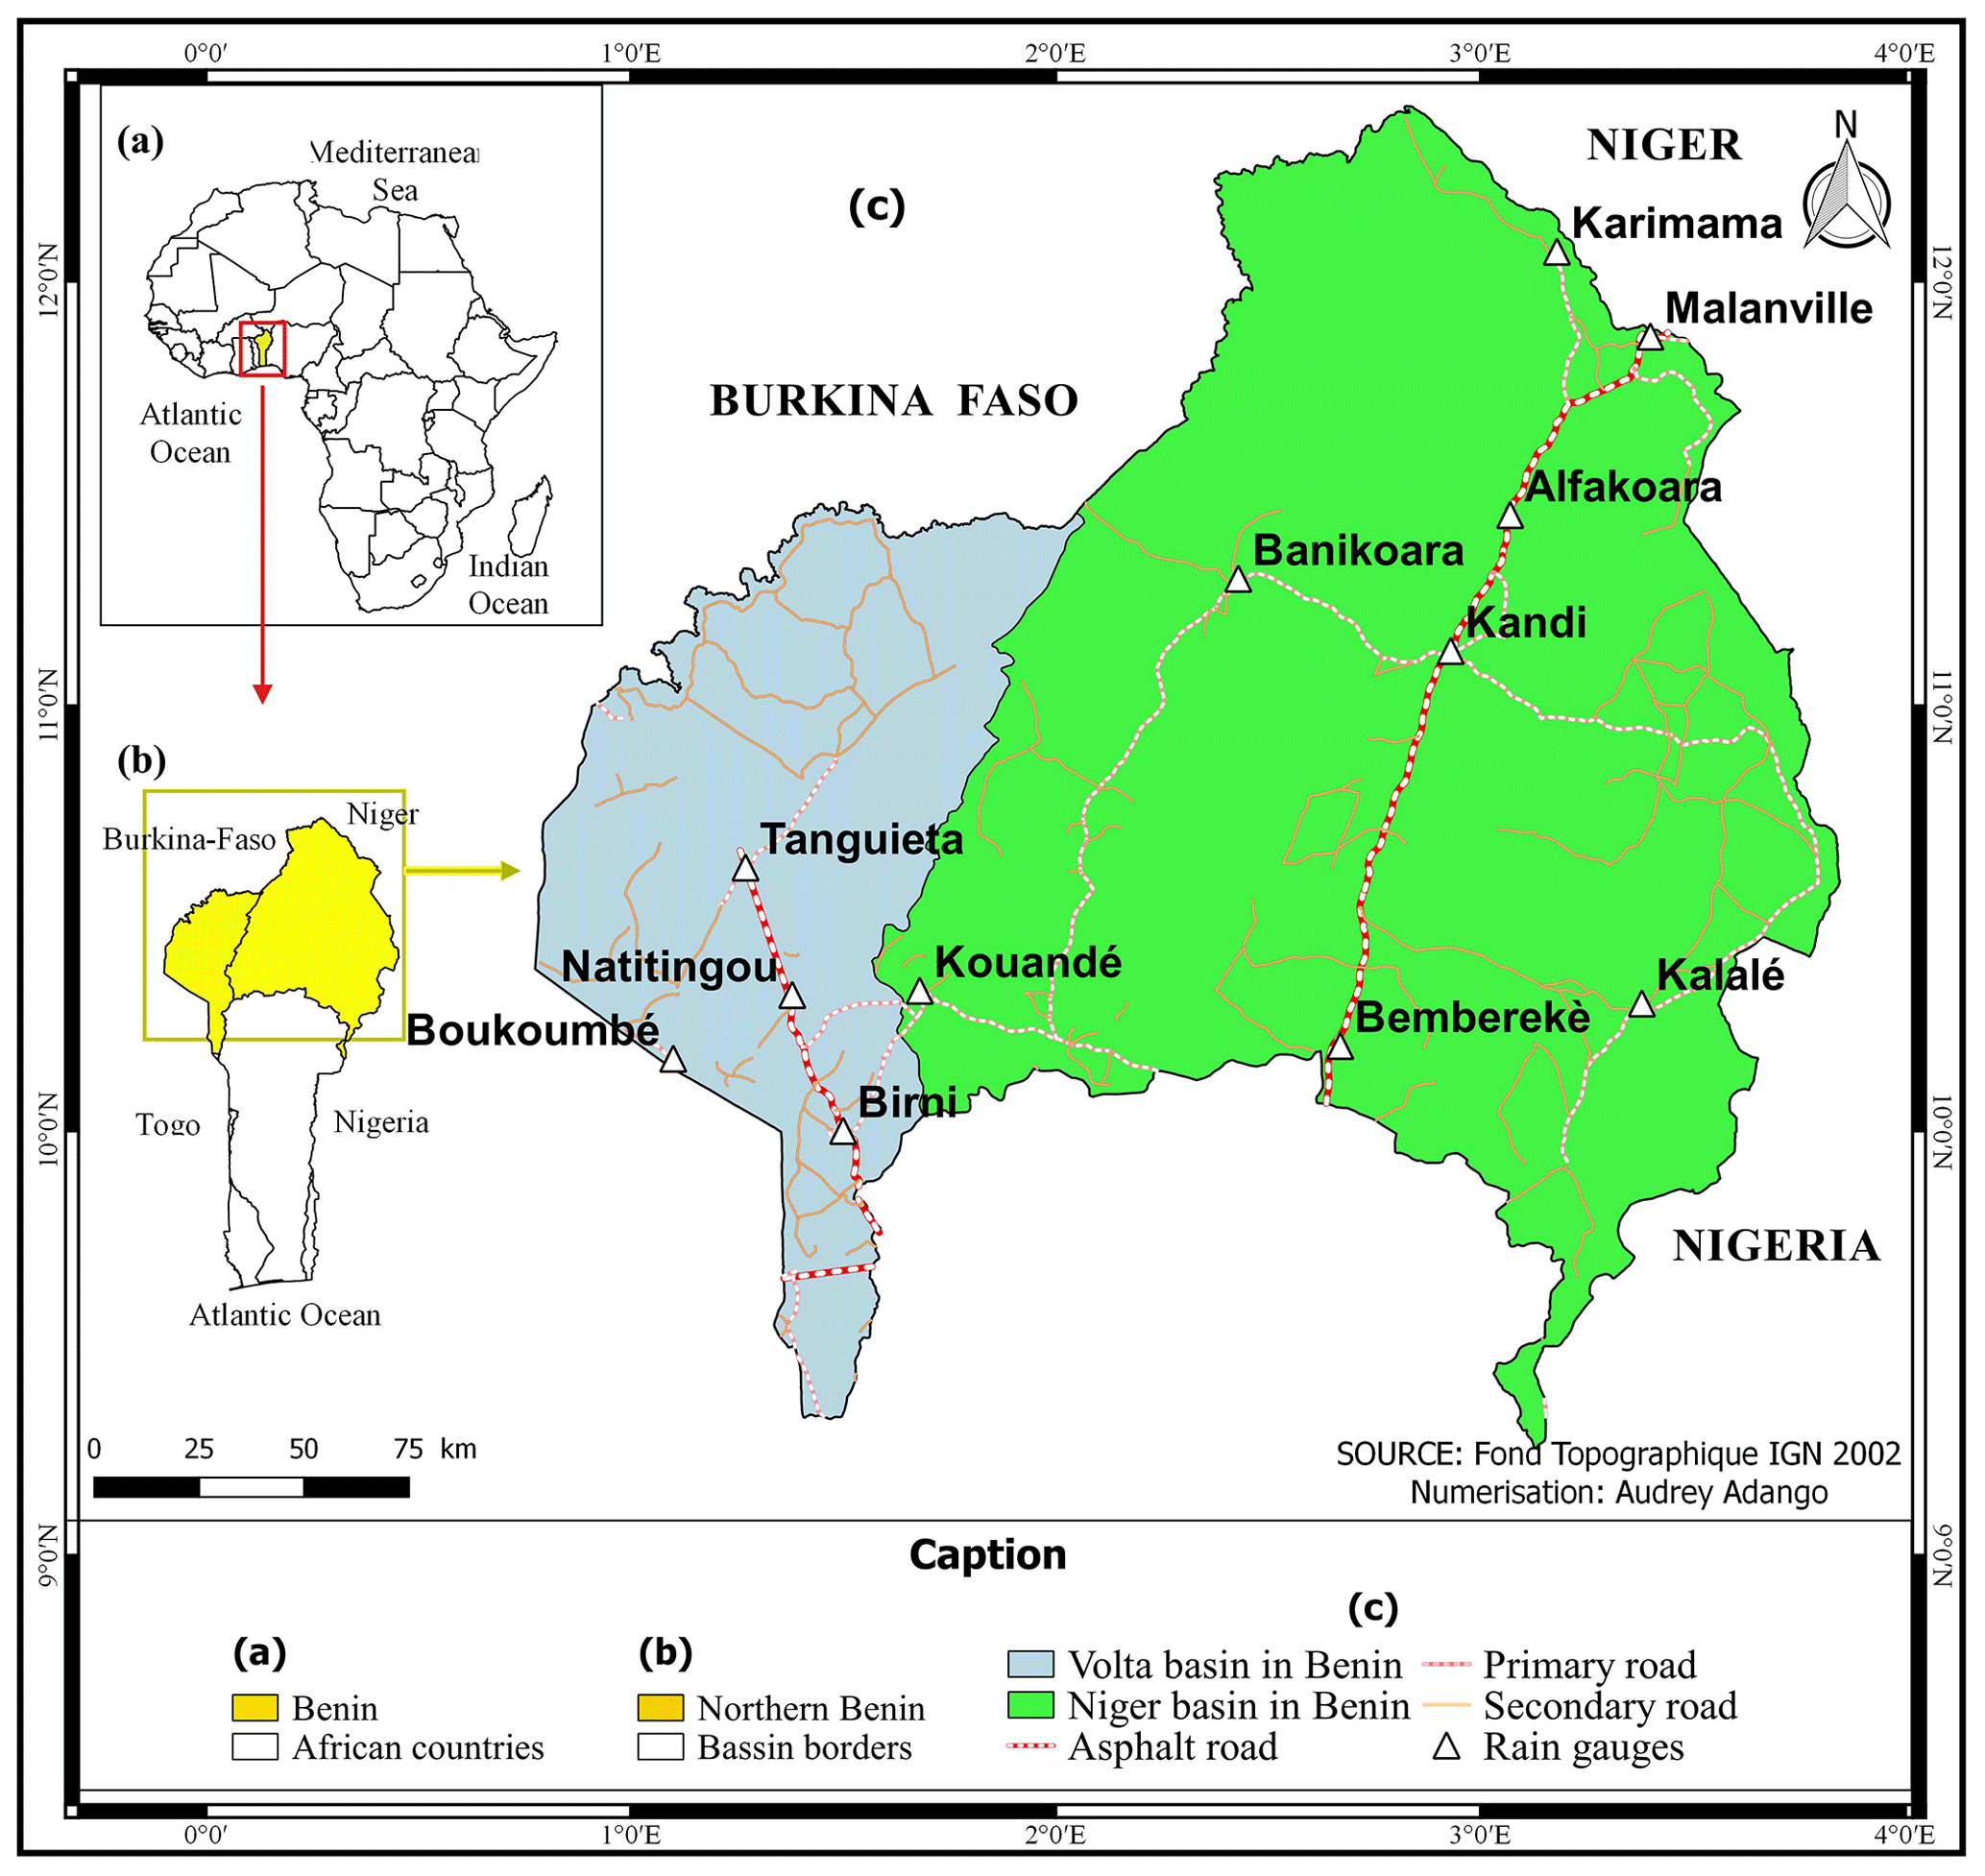
Figure 1Location of the research area displaying the rain gauges used in this study represented by triangles.
2.2 Data
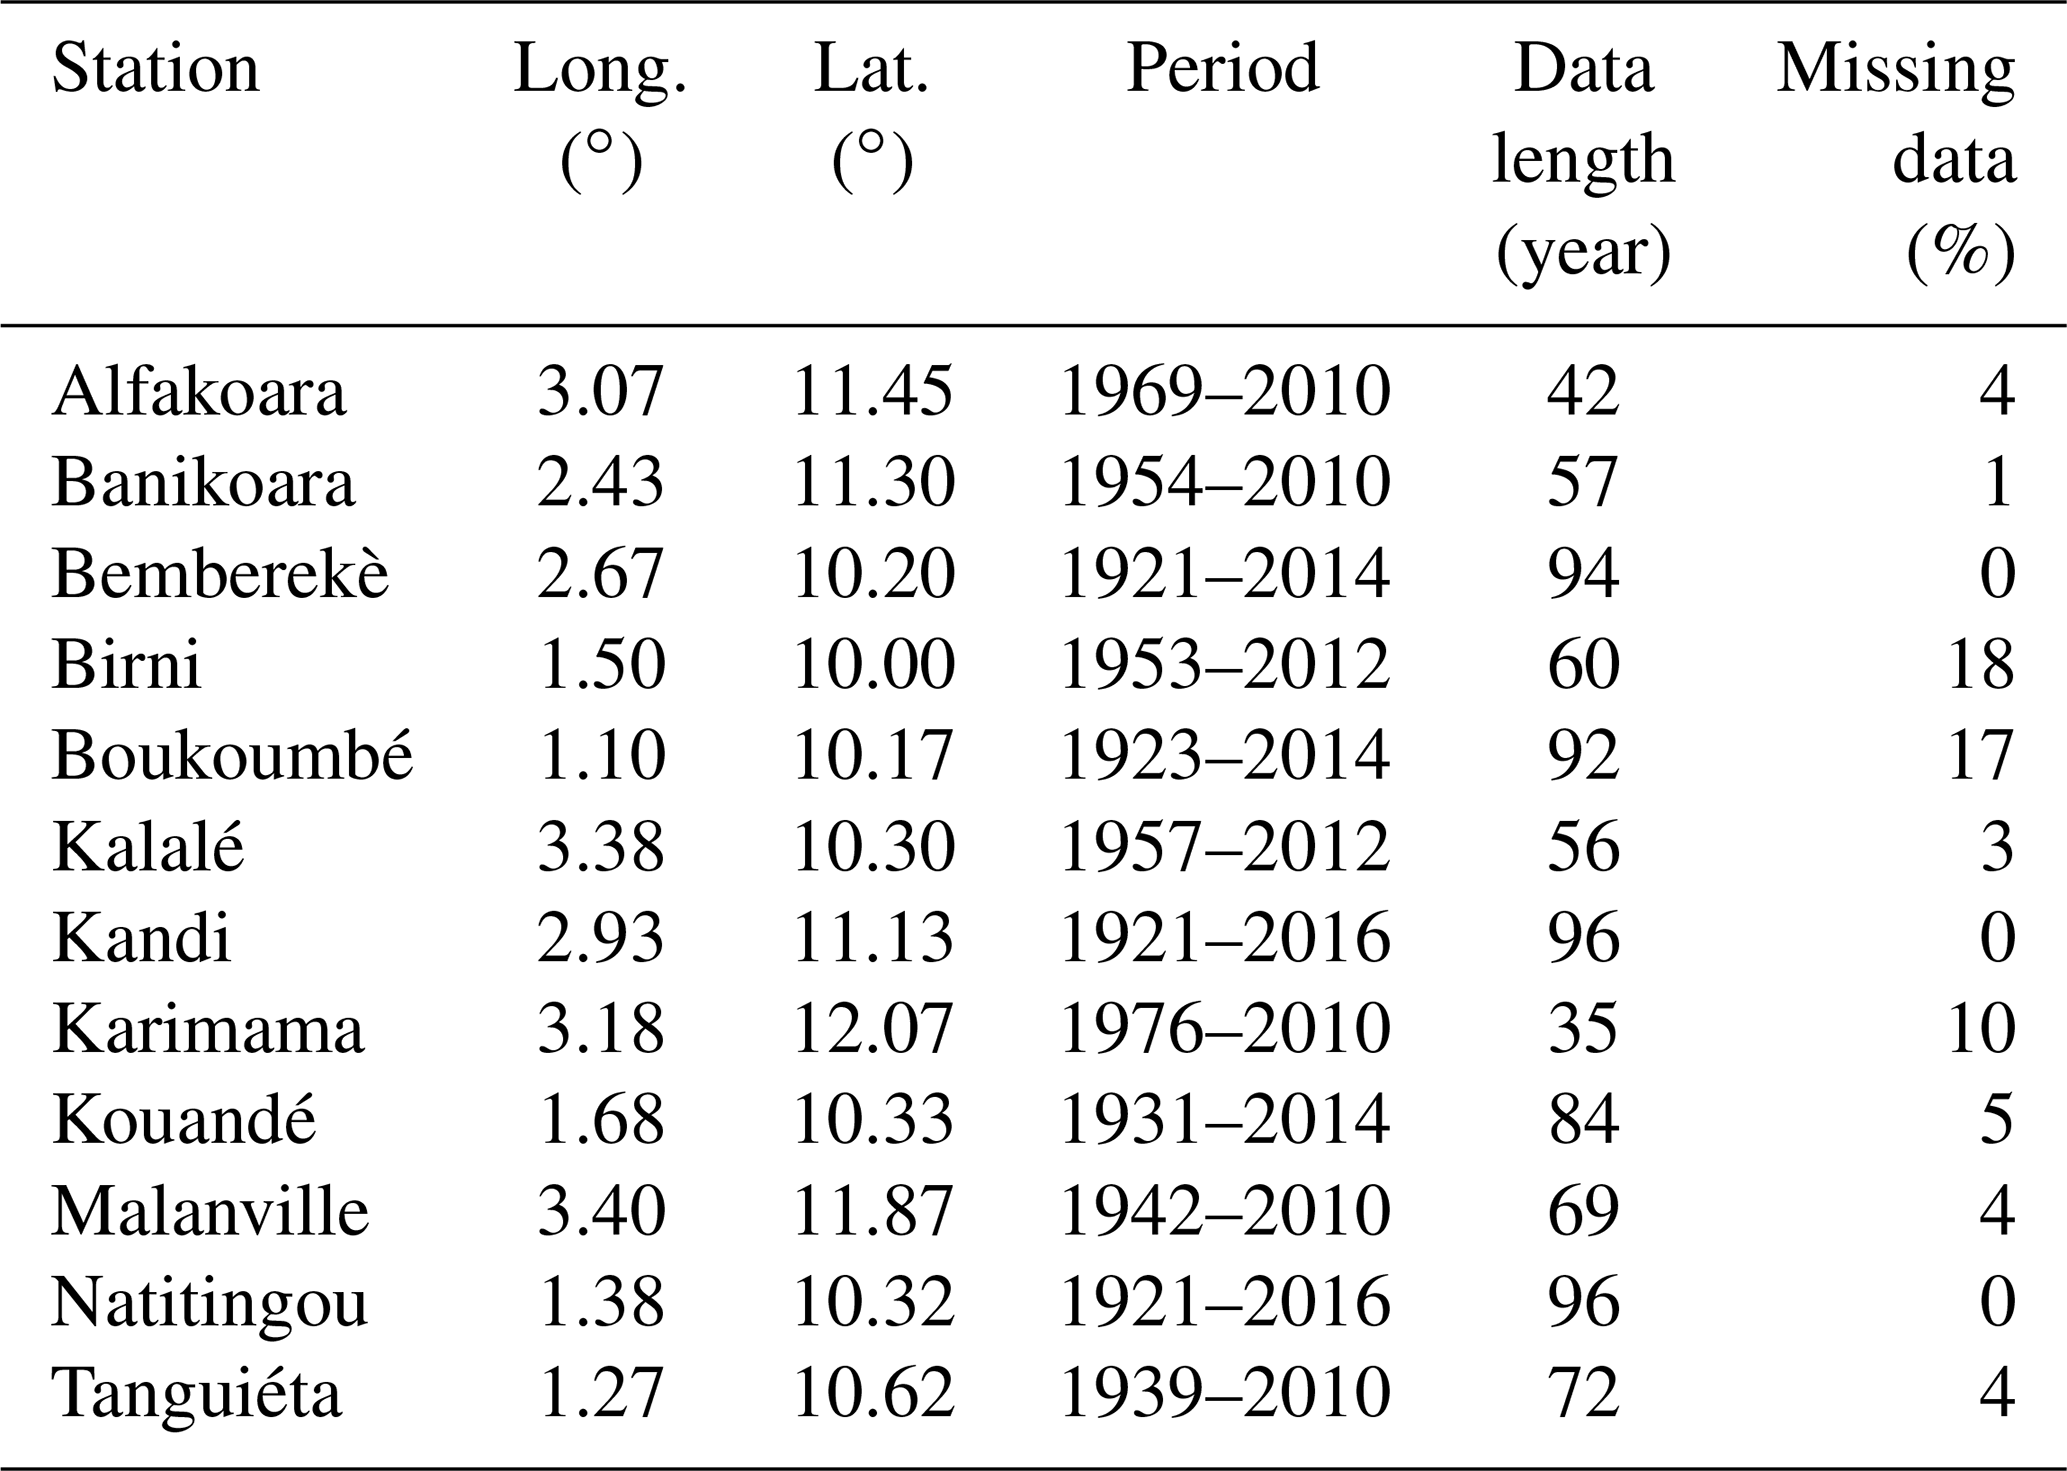
The daily rainfall time series used in this study are from Benin Meteorological Agency. For the choice of rain gauges to consider, priority was given to those located in the most affected municipalities by rainfall-induced floods such as Banikoara and Kandi. Other stations located in the vicinity of the first ones and those with data available were also considered. Subsequently, the percentage of missing data was determined for each station (Table 1). In line with Sect. 2.1, the search for missing data was limited to the rainy season which starts in April and is mainly from June to October. Thus, for each station and each year, the ratio of the number of missing data within June to October to the total number of rainy days was computed, and the mean percentage of missing data (for all years and for each rainfall station). Stations with more than 25 % missing data were discarded in order not to bias the results. For stations with less than 25 % missing data, gaps were filled using the inverse distance method. Thereupon, for each gauge and each year, daily rainfall maxima were extracted. The time series used in this study consist of the annual daily rainfall maxima of 12 rainfall gauges listed in Table 1.
2.3 Methods
In this study, frequency analysis was applied to extreme rainfall time series. The statistical adjustment is performed using of the HYFRAN (HYdrological FRequency ANalysis) software with the prior objective of testing whether the Gumbel distribution is a one-size-fits-all model. The steps of the statistical adjustment fitting are briefly presented below.
2.3.1 Identification of the “best” statistical distributions fitting rainfall extremes
This section deals with the determination of the statistical distribution which best fits the data. Before the statistical fitting, hypotheses testing were carried to check the stationary, independence and homogeneity of the data using the tests of Kendall, Wald-Wolfowitz and Wilcoxon as in El Adlouni et Bobée (2014). The five distributions (Gumbel, Lognormal, GEV, Pearson type III, and Log-Pearson type III) embedded in HYFRAN software were considered.
The Akaike Information Criterion (AIC) and the Bayesian Information Criterion (BIC) were used to compare the five statistical distributions with the best score given to the distribution associated with the lowest values of AIC and BIC (Avahounlin et al., 2013).
2.3.2 Estimating the parameters of selected statistical distributions and rainfall quantiles
The estimation of the parameters of the selected statistical distributions was based on two methods. The maximum likelihood method for Gumbel, Lognormal, GEV and the Pearson type III distributions and the L-moments method for the log Pearson type III distribution. The method of moments consists in equaling the theoretical moments of the distribution (which are a function of the parameters) and their estimates obtained from the sample. Solving the resulting system of equations makes it possible to obtain the parameters of the distribution. The maximum likelihood method involves a likelihood function L defined by Eq. (1( as in Avahounlin et al. (2013).
This latter method consists in finding the parameters θ which maximize the likelihood function, i.e. the probability of observing the sample (xi, … … xN) which represents the best information available on the population.
Afterwards, the so-determined parameters were used to estimate rainfall quantiles for different return periods. According to Perreault et al. (1994), for the estimation of a quantile XT of return period T referring to a random variable X from a sample which follows a given probability distribution F having k parameter, the formula below is used:
where F−1 is the inverse function of the distribution function F and is the probability of exceeding this event.
Furthermore, spatial interpolation of the estimated quantiles was carried out using the kriging method embedded in the Surfer 11 software.
2.3.3 Quantifying biases induced by the systematic use of the Gumbel distribution
To quantify biases induced by the systematic use of the Gumbel distribution on stations fitting other distributions, quantiles estimated using these distributions were compared to quantiles estimated using the Gumbel distribution.
3.1 Best statistical distributions fitting rainfall extremes
The hypotheses testing shows time series are stationary, homogeneous and independent except the time series of Boukoumbé (non-stationary and not independent) and Natitingou (non-stationary). The 5 distributions were fitted to the 12 times series (including Boukoumbé and Natitingou added for consistency and comparison purposes) then compared using the AIC and BIC criteria. Figure 2 displays the spatial distribution of stations according to the statistical distributions which best represent their time series. The statistical distributions which best represent the series vary from one station to the other indicating that the time series within the same basin (or climatic zone) is not necessarily fitted with the same statistical distribution. This applies especially to the Beninese section of the Volta Basin where “best” statistical distributions are systematically distinct.
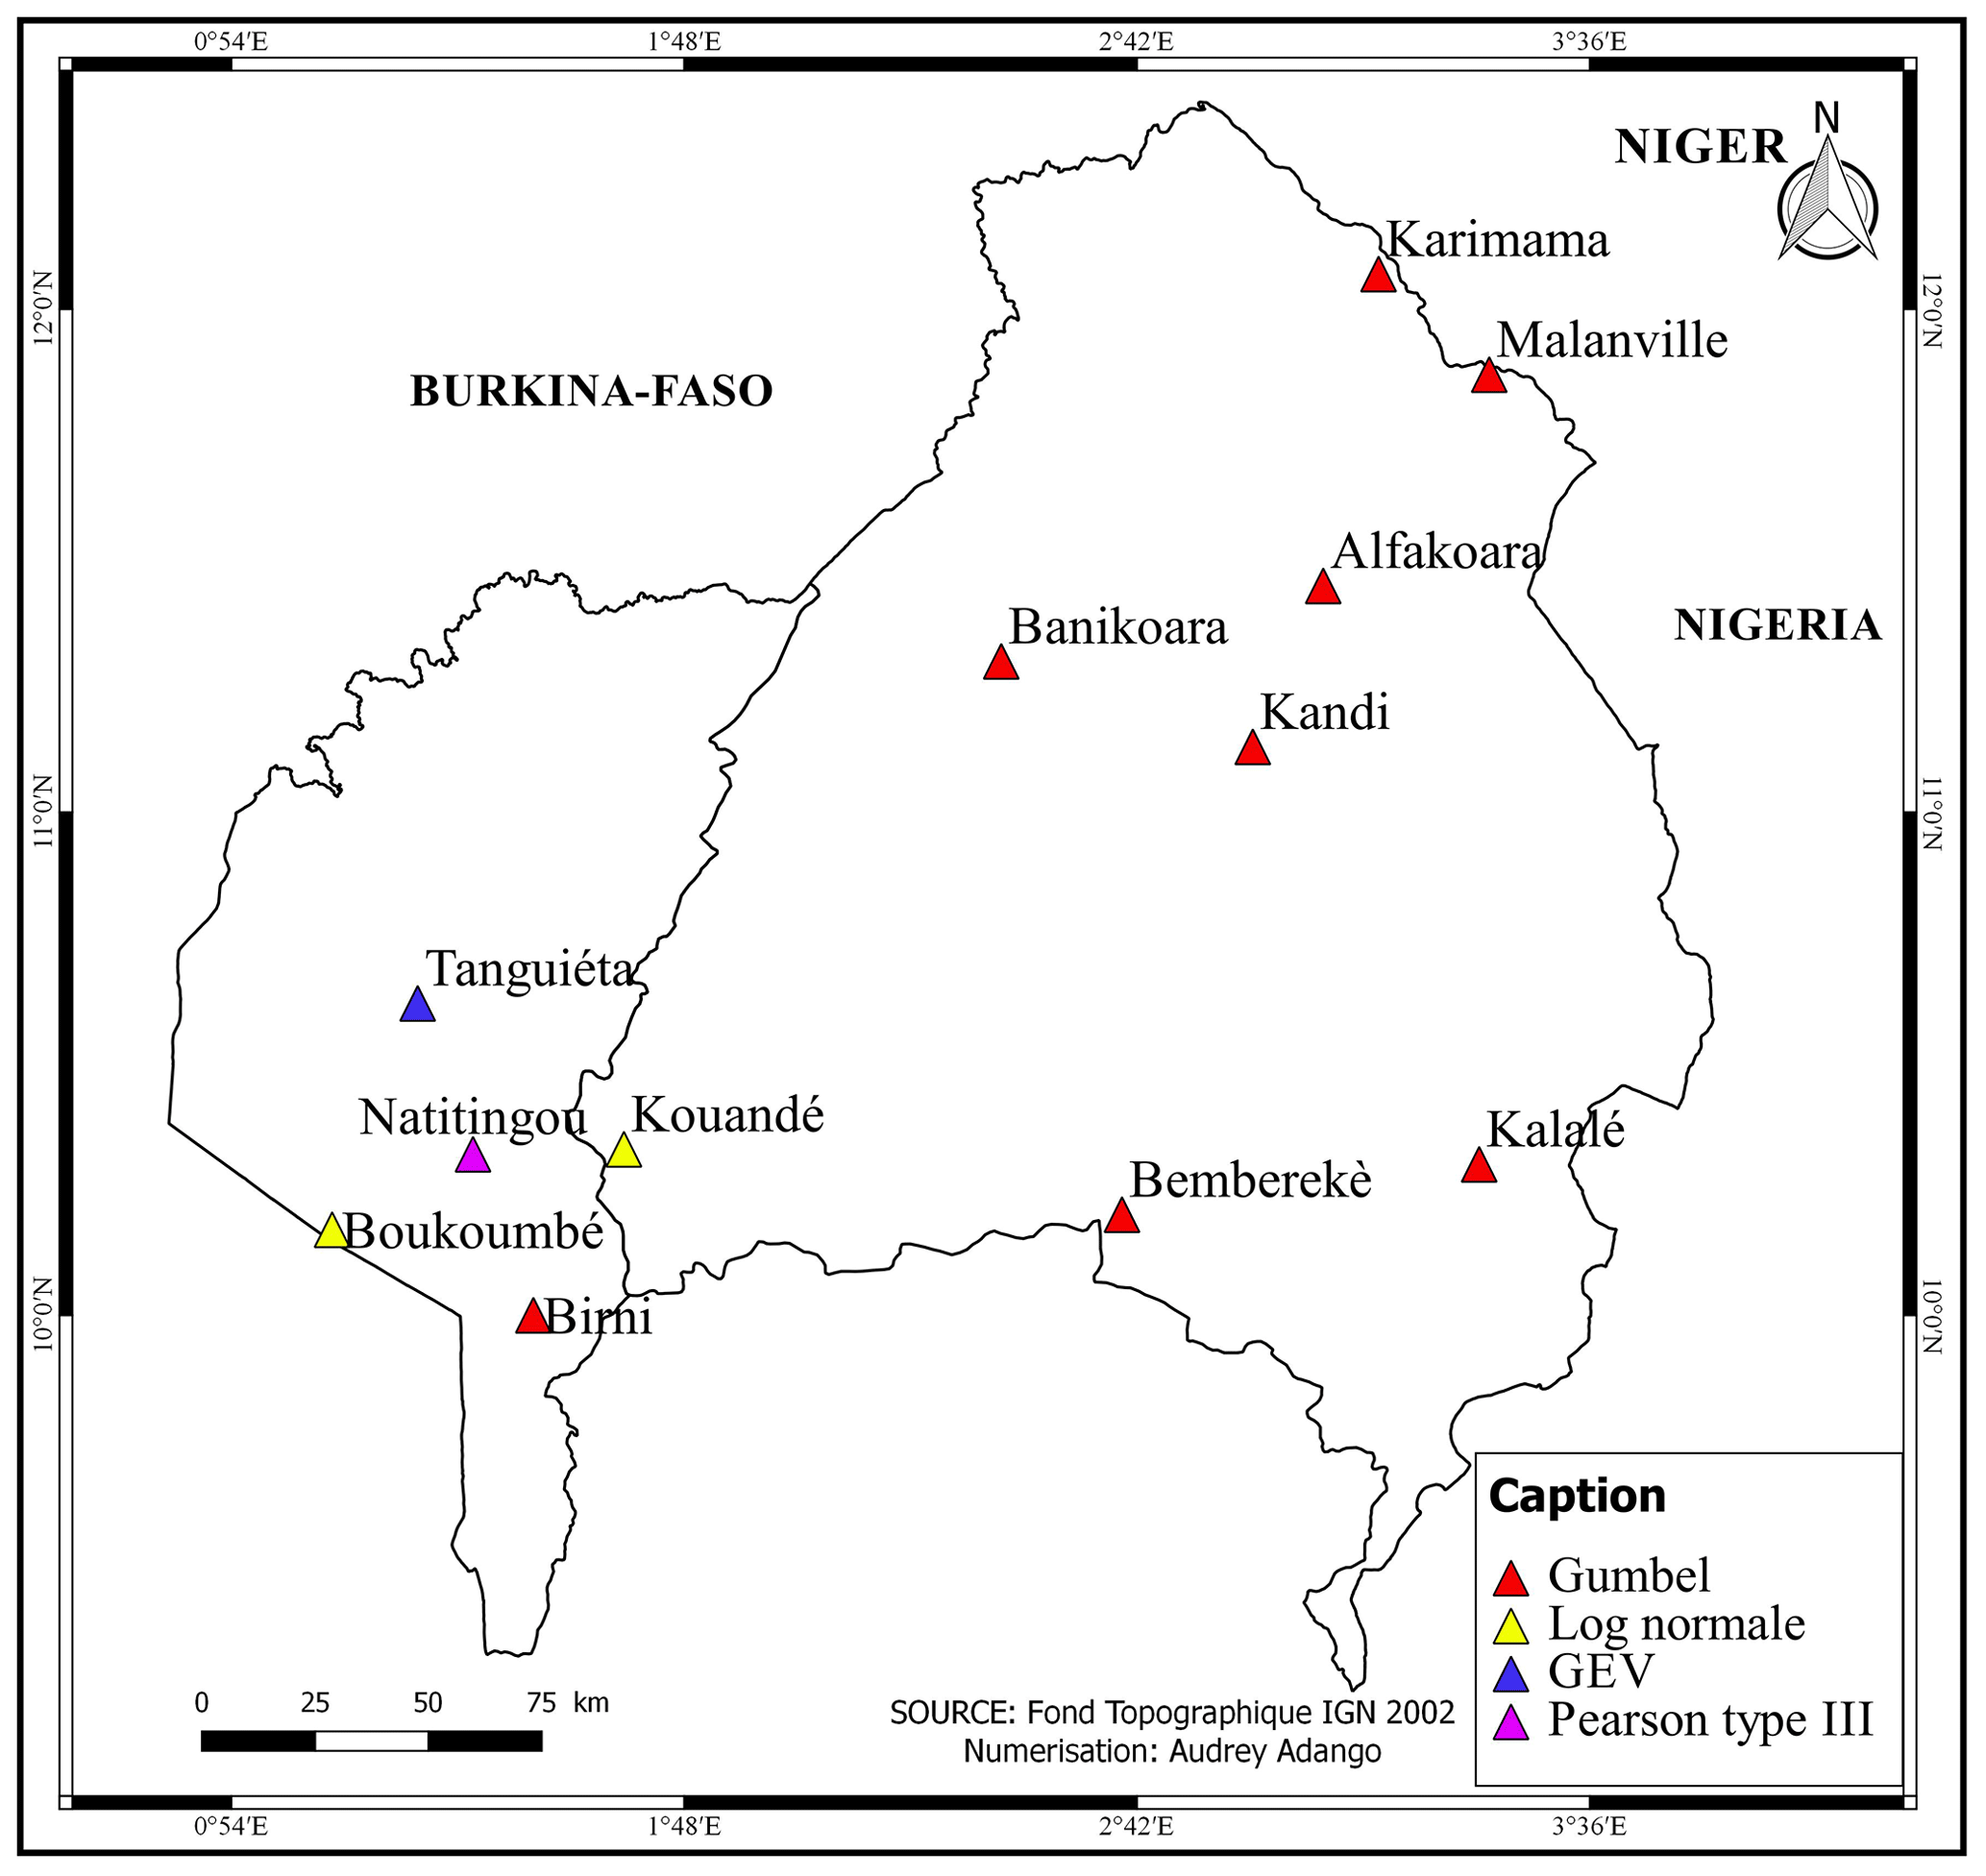
Figure 2Spatial distribution of selected statistical distributions.
'
This result is consistent with that of Agué and Afouda (2015) who demonstrated that the probability distributions of annual maximum daily rainfall are not rainfall regime-dependent. However, for some specific stations, our results are slightly different from those of Agué and Afouda (2015) who found that for the station at Bemberekè the Pearson type III instead of the Gumbel distribution fit better extreme rainfall data and for the station at Boukoumbé the Gumbel is the best statistical distribution fitting the data instead of the Lognormal distribution. The difference might stem from the length of the time series as the time series considered in this study ranges from 1921–2016 (and includes the wet decade of 2001–2010) against the period of 1921–2001 for the study of Agué and Afouda (2015) confirming the influence of data length and the need for updates of heavy rainfall frequency analysis is suggested here.
Also, Fig. 2 shows the predominance of the Gumbel distribution which fits the data of of stations contradicting the results of Goula Bi Tie et al. (2007) who compared the Gumbel and Lognormal distributions for 34 stations located in Côte d'Ivoire found instead the predominance of the Lognormal distribution (56 % of stations) over the Gumbel distribution (44 % of stations). The divergence of both results further shows that there is no rationale for taking the Gumbel distribution as one-size-fits-all-models.

Figure 3Extreme rainfall quantiles for 2 years (a), 5 years (b), 10 years (c), 50 years (d) and 100 years (e) return periods.
3.2 Parameters of selected statistical distributions and rainfall quantiles
Applying the maximum likelihood and L-moments methods, the parameters of the selected statistical distributions were determined then used to estimate the quantiles of maximum daily rainfall for five return periods (Table 2).
Table 2Quantiles in mm for different return periods T=2, 5, 10, 50, and 100 years; in brackets are the 95 % confidence intervals.

For short return periods (2, 5 and 10 years), minimums are observed at the station at Karimama but maximums at Bembereké and Kalalé. For longer return periods (50 and 100 years), the highest quantiles are recorded at Tanguiéta then Boukoumbé and Kalalé. Minimums are observed at the stations at Banikoara and Karimama.
Spatial interpolation of the quantiles is displayed in Fig. 3. The highest daily rainfall quantiles are generally recorded in the southern part of the research area (Boukoumbé and Kalalé). Isohyets decrease northward. For longer return periods (50 and 100 years), the maxima are observed at the Tanguiéta station and its surroundings. Besides, it is observed in the mountainous area of Atacora (between latitudes 10∘ and 11∘30′), a very high rainfall variability characterized by the parallelism and the approximation of isohyets testifying to the important role of orography in local precipitation (Agué and Afouda, 2015; Goula Bi Tie et al., 2007).
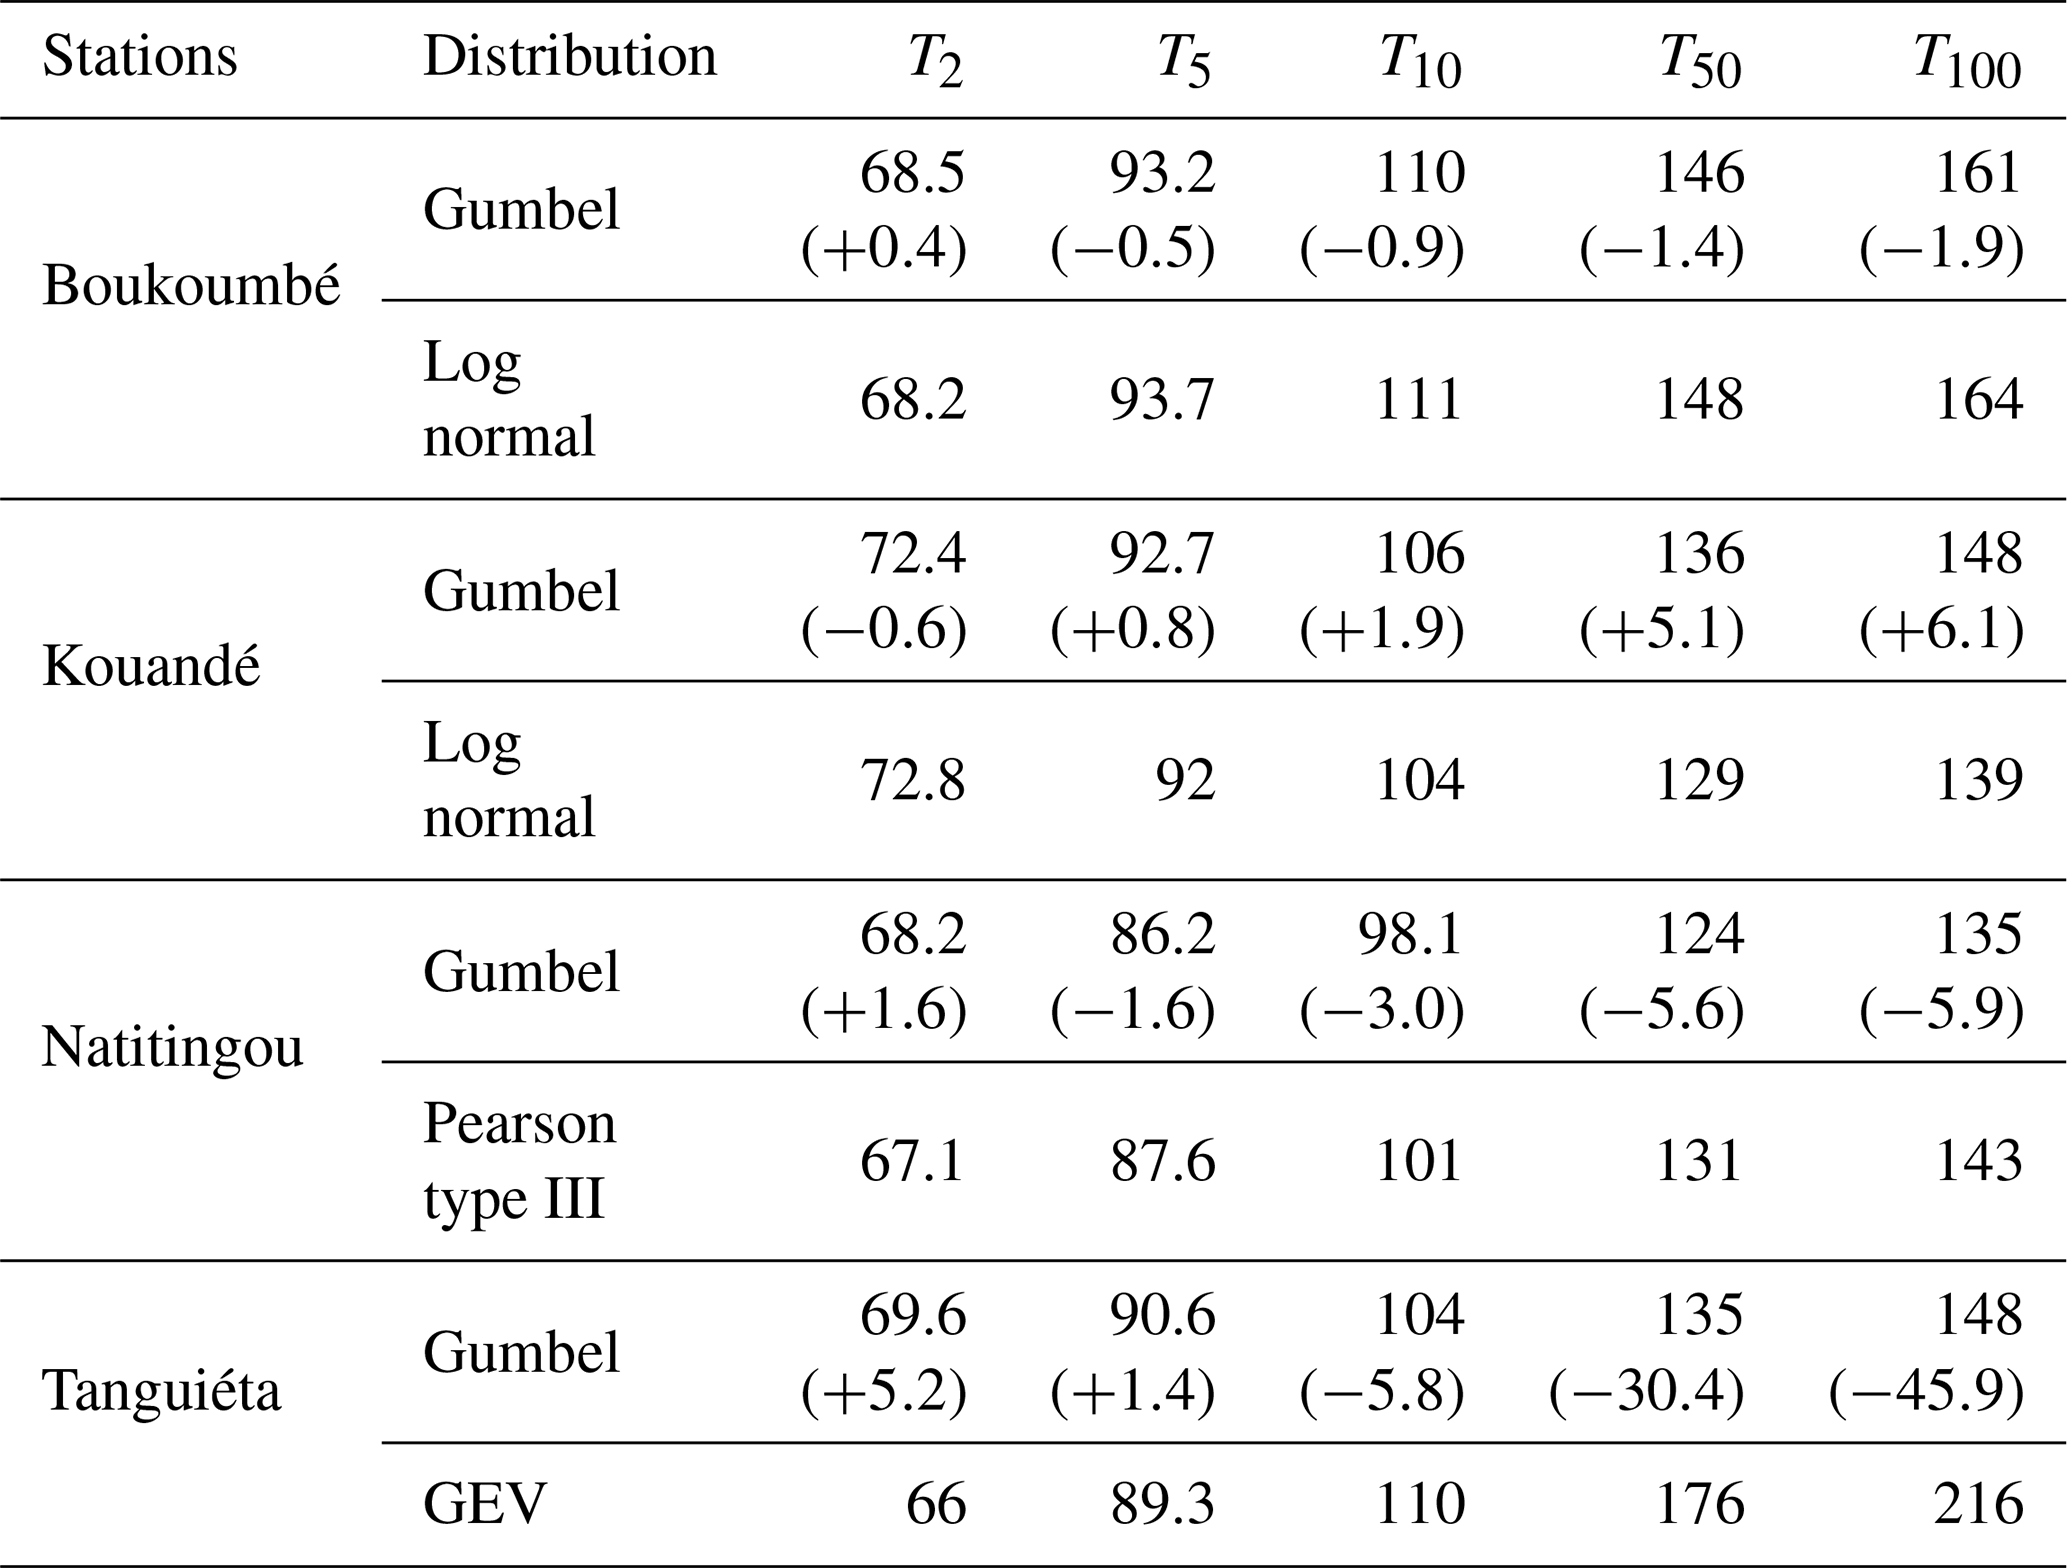
Table 3Comparison of rainfall quantiles estimated with both Gumbel distribution and selected distributions; in bracket are the per cent of bias. A sign signifies an overestimation (underestimation) of rainfall quantiles. Values are in mm.
3.3 Biases induced by the systematic use of the Gumbel distribution
For the stations at Boukoumbé, Natitingou and Tanguiéta, the Gumbel distribution slightly overestimates rainfall quantiles of 2 years return periods (Table 3). This also applies to Kouandé stations for the return periods for 5, 10, 50 and 100 years return periods. On the contrary for the other stations, the longer the return period the greater the underestimation of quantiles estimated using the Gumbel distribution. This is particularly true for the GEV distribution which best fits Tanguieta's data. Apart from the station at Kouandé, for the other stations, the per cent of underestimation (up to −45.9 %) is by far greater than that of overestimation (up to +6.1 %). This underestimation of rainfall quantiles was reported by Koutsoyiannis (2004) who studied 169 stations (of more than 100 years of data length) located in the US, UK and southern France and found that the Gumbel distribution underestimates quantiles particularly for return periods ranging from 50 to 100 years.
In this study, the statistical distributions that best describe the statistical behaviour of heavy rainfall in the Benin section of the Niger and Volta Rivers basins were determined and daily rainfall quantiles associated with different return periods were estimated. This was done with the primary objective of testing whether the widely applied Gumbel distribution is a one size fit all model for the research area. Therefore, a frequency analysis of the rainfall extremes of 12 stations was carried out on time series ranging from 35 to 96 years in length. The HYFRAN (HYdrological FRequency ANalysis) software was used for the assignment. Before the frequency analysis, hypothesis testing was performed to check the stationarity, independence and homogeneity of the data. The investigations indicate that the time series of annual daily maxima rainfall are stationary, homogeneous and independent except the time series of Boukoumbé (which are non-stationary and not independent) and of Natitingou (which are non-stationary) and therefore verifying the hypotheses for applying the frequency analysis. However, for comparison purposes, the time series of Boukoumbé and Natitingou were also considered for the frequency analysis.
The results reveal that though predominant and fitting the best two-third of the time-series, Gumbel distribution is not a one-size-fits-all-time series. Three of the four other statistical distributions (GEV, Lognormal, and Pearson type III) fits the best at least one time series with the Lognormal distribution fitting the best two times series, and the GEV and Pearson type III one time series. Corresponding quantiles computed using selected statistical distributions vary between 67 and 216 mm respectively for the return periods of 2 and 100 years with the highest rainfall values obtained in mountainous areas (between latitudes 10∘ and 11∘30′) testifying to the important role of orography in local rainfall. This work provides useful science-based evidence of the systematic mistake done when civil engineers apply Gumbel distribution as a one-size-fits-all-time series for the design of rainwater drainage systems for flood control. It is expected that it will guide the design of flood control infrastructures in the future to protect the livelihood of millions of people exposed to extreme rainfall-induced damages.
Daily rainfall data is not publicly available due to the policies of Benin Meteorological Agency (http://meteobenin.bj/services/demande-de-donnees/, last access: 15 October 2021) (METEO BENIN, 2021).
AAA and DFB conceived the presented research. AA and JH collected the data and performed the computations. AB, YY and EA encouraged AA to quantify the biases induced by the use of the Gumbel distribution instead of appropriate distributions. EIB, JA, and LOCS reviewed the very first draft of the manuscript. All authors discussed the results and contributed to the final manuscript.
The contact author has declared that neither they nor their co-authors have any competing interests.
Publisher's note: Copernicus Publications remains neutral with regard to jurisdictional claims in published maps and institutional affiliations.
This article is part of the special issue “Hydrology of Large River Basins of Africa”. It is a result of the 4th International Conference on the “Hydrology of the Great Rivers of Africa”, Cotonou, Benin, 13–20 November 2021.
The authors are grateful to the two anonymous reviewers whose comments helped in improving the initial manuscript.
Agué, A. I. and Afouda, A.: Analyse fréquentielle et nouvelle cartographie des maxima annuels de pluies journalières au Bénin, Int. J. Biol. Chem. Sci, 9, 121–133, https://doi.org/10.4314/ijbcs.v9i1.12, 2015.
Amoussou, E., Camberlin, P., Tramblay, Y., and Mahe, G.: Évolution des précipitations extrêmes dans le bassin versant du Mono (Bénin- Togo) en contexte de variabilité/changement climatique, in: XXVIIe Colloque de l'Association Internationale de Climatologie, Dijon, France, 2014.
Avahounlin, F. R., Lawin, A. E., Alamou, E., Chabi, A., and Afouda, A.: Analyse Fréquentielle des Séries de Pluies et Débits Maximaux de L'ouémé et Estimation des Débits de Pointe, Eur. J. Sci. Res., 107, 355–369, 2013.
Badou, D. F., Afouda, A. A., Diekkrüger, B. and Kapangaziwiri, E.: Investigation on the 1970s and 1980s droughts in four tributaries of the Niger River basin (West Africa), in: E-proceedings of the 36th IAHR World Congress 28, the Hague, 1–5, 2015.
Badou, D. F., Hounkpè, J., Yira, Y., Ibrahim, M., and Bossa, A. Y.: Increasing Devastating Flood Events in West Africa: Who is to Blame?, in: Regional Climate Change Series, WASCAL Publishing, Ouagadougou, Burkina Faso, 84–90, 2019.
El Adlouni, S. and Bobée, B.: Analyse Fréquentielle Hydrologique: Logiciel HYFRAN-PLUS (Version-V2.1), available at: https://www.wrpllc.com/books/HyfranPlus/hyfranplusdescrip.html (last access: 17 June 2021), 2014.
Goubanova, K. and Li, L.: Extremes in temperature and precipitation around the Mediterranean basin in an ensemble of future climate scenario simulations, Global Planet. Change, 57, 27–42, https://doi.org/10.1016/j.gloplacha.2006.11.012, 2007.
Goula Bi Tie, A., Konan, B., Brou, Y. T., Issiaka, S., Fadika, V., and Srohourou, B.: Estimation des pluies exceptionnelles journalières en zone tropicale: cas de la Côte d'Ivoire par comparaison des lois Lognormale et de Gumbel, Hydrolog. Sci. J., 52, 49–67, https://doi.org/10.1623/hysj.52.1.49, 2007.
Habibi, B., Meddi, M., and Boucefiane, A.: Analyse fréquentielle des pluies journalières maximales Cas du Bassin Chott-Chergui, Nat. Technol., 8, 41–48, 2013.
Hamzaoui, S.: Modélisation des courbes IDF à travers des stations pluviométriques de la région de l'Ouest du pays, Mémoire de Master, Ecole Nornale Supérieur d'Hydraulique, Blida, Algérie, available at: https://library.ensh.dz/images/site_lamine/pdf/these_master/2016/6-0030-16.pdf (last access: 16 July 2020), 2016.
Hounkpè, J., Diekkrüger, B., Badou, D. F., and Afouda, A.: Change in Heavy Rainfall Characteristics over the Ouémé River Basin, Benin Republic, West Africa, Climate, 4, 1–23, https://doi.org/10.3390/cli4010015, 2016.
INSAE: Effectifs de la population des villages et quartiers de ville du Bénin (RGPH-4, 2013), Cotonou, Bénin, available at: https://insae.bj/images/docs/insae-statistiques/demographiques/population/Effectifsde la population des villages et quartiers de ville du benin/Cahier VillageRGPH4 2013.pdf (last access: 5 June 2020), 2016.
Kodja, D. J.: Indicateurs des évènements hydroclimatiques extrêmes dans le bassin versant de l'Ouémé à l'exutoire de Bonou en Afrique de l'Ouest. Thèse de doctorat, Université Montpellier, Université d'Abomey-Calavi, Bénin, available at: https://tel.archives-ouvertes.fr/tel-01869842/document (last access: 15 June 2021), 2018.
Koungbanane, D., Zahiri, P. E., Sourou, H., Totin Vodounon, H. S., Amoussou, E., Lare, L. Y., and Koubodana, H. D.: Analyse fréquentielle et détermination des seuils pluvio-hydrologiques de risques d'inondation dans le bassin-versant de l'Oti au Togo, Afrique Sci., 17, 73–88, 2020.
Koutsoyiannis, D.: Statistics of extremes and estimation of extreme rainfall: II. Empirical investigation of long rainfall records, Hydrolog. Sci. J., 49, 591–610, https://doi.org/10.1623/hysj.49.4.591.54424, 2004.
MEHU: Deuxieme communication nationale de la République du Bénin sur les changements climatiques, Cotonou, Benin, available at: https://unfccc.int/resource/docs/natc/bennc2f.pdf (last access: 5 June 2020), 2011.
METEO BENIN: Demande de données, available at: http://meteobenin.bj/services/demande-de-donnees/, last access: 15 October 2021.
Ousmane, D.: Ajustement statistique à des échantillons de pluies et débits: Application aux données du bassin versant de la Faleme, Mémoire de DEA, Université Cheikh Anta Di, Dakar, Sénégal, Dakar, Hann., 1992.
Perreault, L., Bobée, B., and Perron, H.: Ajuste II: hydrological frequency analysis software. PART 1: theoretical aspects, Trans. Ecol. Environ., 8, 243–250, https://doi.org/10.2495/HY940292, 1994.
St-hilaire, A.: Analyse fréquentielle des précipitations de la station Assomption, Rapport de recherche, Québec, Canada, available at: http://espace.inrs.ca/id/eprint/1277/1/R000937.pdf (last access: 5 June 2020), 2007.
World Bank: Inondation au Benin: Rapport d'evaluation des Besoins Post Catastrophe, Cotonou, Benin, p. 84, 2011.