the Creative Commons Attribution 4.0 License.
the Creative Commons Attribution 4.0 License.
 | 16 Sep 2020
Analysis of Event-based Hydrological Processes at the Hydrohill Catchment Using Hydrochemical and Isotopic Methods
Na Yang
Jianyun Zhang
Jiufu Liu
Guodong Liu
Aimin Liao
Hydrochemical and isotopic techniques have been widely applied in hydrological sciences because isotopic tracers can identify water sources and hydrochemical tracers can discern runoff flow paths. To better understand the hydrological process, we combined hydrochemical and isotopic techniques under controlled experimental conditions to investigate hydrological process from rainfall to runoff in the Hydrohill experiment catchment, a typical artificial catchment in Chuzhou, China. Hydrochemical and isotopic data, i.e., pH, electric conductivity (EC), total dissolved solids (TDS), anions (Cl−, , and ), cations (K+, Na+, Ca2+ and Mg2+) and dissolved Si, 18O and D in water samples were collected during a rainfall event in 2016, and used to determine the hydrochemical and isotopic characteristics of rainfall and runoff components. We applied EC, TDS, , Ca2+, Mg2+, 18O and D as tracers to investigate rainfall-runoff processes in the experimental catchment. Runoff flow paths could be well identified by the relationship between 18O and EC, TDS, , Ca2+ and Mg2+. The quantity of flow flux and mass fluxes of main hydrochemical and isotopic tracers gauged at the catchment outlet shows applicable tracers (Ca2+, Mg2+, , and 18O) are mainly from deep groundwater runoff (from soil layer of 60–100 cm beneath ground surface). Contributions of the event water and pre-event water to the total runoff during the rainfall-runoff process are different. The quantitative results were very encouraging as a basis to develop hydrological models for further study.
- Article
(4054 KB) - Full-text XML
- BibTeX
- EndNote


Runoff sources and their pathways play a significant part in runoff generation and flow concentration, and thus have been widely studied during the past decades (Zhao, 1989; Gu et al., 2018). Variations of temporal and spatial dynamics inside the catchment indicate different flow paths and water sources contributing to the total runoff outlet. Hydrochemical and isotopic processes of total runoff outlet are mainly affected by the solutes sources, hydrological pathways and the flow components contributions (Yang et al., 2012). Hydrochemical tracers (Uhlenbrook et al., 2002; Tardy et al., 2004) and stable isotopes (Carey et al., 2004) widely applied in hydrological science have enhanced our understanding of runoff generation processes. Environmental tracers are commonly used on a catchment scale because it is possible to determine the source areas of runoff, flow pathways, residence times and the hydraulic characteristics of flow systems. Hydrochemical indexes such as pH, electrical conductivity (EC), total dissolved solids (TDS) or the concentration of dissolved silicon and various anions and cations (including K+, Na+, Ca2+, Mg2+, Cl−, and ) have been used to separate and quantify runoff components, so that the contributions of different runoff components can be determined and the hydrological pathways and the solutes sources can be investigated (Pilla et al., 2006; Mul et al., 2008).
Several methods, such as chemical/isotope (tracer) hydrograph separation, rainfall-runoff models and base flow filters, have often been applied to quantify runoff components (Gonzales et al., 2009; Cartwright et al., 2014). Hydrograph separation combining hydrochemical and isotopic tracers is a method commonly used to identify the origin and pathways of surface and subsurface runoff and thus reveal the mechanisms of runoff generation (Hooper et al., 1986; Klaus et al., 2013). For example, quick flow, which contributes to the total outlet immediately after the rainfall event, can include water from different sources (Hrachowitz et al., 2011; Cartwright et al., 2014). More studies have used two-component mixing models, three-component mixing models and multi-component mixing models to distinguish pre-event water with event water (Huth et al., 2004; Hugenschmidt et al., 2014) and identify water sources and flow paths, in which isotope tracers (18O and 2H) are applied in conjunction with geochemical tracers (Vincent et al., 2001; Brian et al., 2010; Stadler et al., 2012). Mixing models can enhance the accuracy of research about hydrological processes. The results obtained by separation techniques based on the mass balance approach suggest a significant contribution of pre-event water to catchment runoff, as documented in the majority of studies performed worldwide (Klaus et al., 2013). For example, streamflow components were determined by analyzing 18O, 2H, , , Cl−, Na+, K+, Ca2+, Mg2+, EC and other parameters mainly focusing on the temporal and spatial variations of the sources which come from precipitation, stream waters, soil solution and spring water. 18O and Si were finally used to evaluate contributing sources by using mass balance equations and end-member mixing diagrams (Ladouche et al., 2001). Based on hydrochemical tracers, a three-component hydrograph separation was carried out in a steep, remote and monsoon-dominated study site (7 km2) in northern Thailand (Hugenschmidt et al., 2014). In the study, silica and EC, K+ and Ca2+ were used as indicators for fractions of runoff components, surface runoff dynamics, and to give a better understanding into groundwater behavior. In the study, groundwater accounted for the largest contribution to stormflow (62 %–80 %) throughout all events, followed by shallow subsurface flow (17 %–36 %) and surface runoff (2 %–13 %). Thus, calculating the contributions of different runoff components to the total runoff is quite important for accurate predictions of water supply from mountain watersheds (Zhang et al., 2018).
Water delivery to the catchment outlet can be affected by variations of flow paths connecting the residence time variations of water inside the catchment (Hrachowitz et al., 2016). Surface water and subsurface water contributions to the whole catchment and the inherent flow paths indicate the details of hydrological processes. Hydrochemical data and stable water isotopes can be used in mass balance to gain an understanding of source water and flow paths in complex terrain (Robinson et al., 2009; Williams et al., 2011). End-Member Mixing Analysis (EMMA) is a hydrological mixing model that can be used to conceptualize runoff generation processes and has been successfully applied to many catchments around the world (Maurya et al., 2011; Baraer et al., 2015). For example, Zhang et al. (2018) utilized hydrochemical tracers from 2009 to 2011 to statistically model streamflow sources within a mesoscale (264 km2) watershed. Snowmelt and rainwater from the subalpine zone and groundwater sampled from the upper montane zone contributed 54 %, 22 %, and 24 % of the annual streamflow, respectively, which contribute to a better understanding of streamflow source waters in complex mountain terrain.
More controlled experiments are needed to seek new fundamental understanding through new mechanistic experimentations of how watershed systems work. Field hydrological experiments at the Hydrohill experimental catchment at the Chuzhou hydrological experiment base have improved the basic theory of hydrology. For example, it has been confirmed that the runoff components include surface runoff, interflow in the unsaturated zone and groundwater runoff in the saturated zone and their runoff generation mechanisms (Liu et al., 2018a, b). However, a further study examining the contributions and water residence time of different runoff components to the total outlet of the catchment is still required. Moreover, understanding of characteristics of tracers in rainfall-runoff processes is also quite necessary and important. Kendall et al. (2001) investigated the relations between Cl−, Si, and δ18O of subsurface waters and rainfall at Hydrohill to identify event water and pre-event water contributions to the outlet of the catchment, and found the Cl− and Si in quick-flow runoff originated from event water were not regarded as suitable conservative tracers for either water sources or flow-paths in this catchment. However, due to the advanced instruments in this research for testing more tracers, such as conventional indexes, cations and anions, we have more choices.
Using data from a rainstorm in October 2016 at the Hydrohill experimentation area in Eastern China, the paper aims to use the tracer analysis approach to investigate the hydrological processes and their relationship with both hydro-chemical and isotopic processes to get a better understanding of the interaction mechanism between different fluxes in the critical zone. The main objectives of this work are (i) to analyse the characteristics of tracers and select the applicable ones that could be more effective in describing hydrological processes, (ii) to test the effectiveness of combining isotopic and hydrochemical indicators in identifying runoff pathways, (iii) to investigate the mass fluxes of selected tracers in different runoff components to the total outlet.
2.1 Study site
The study was performed in the 512 m2 Hydrohill artificial experimental catchment, located in Chuzhou, southeastern China. The bottom consists of two intersecting slopes that are inclined at 10∘ and have an overall downslope gradient of 14∘ (Fig. 1c). Impermeable concrete walls were set up on this aquiclude with the final objective to enclose the catchment to prevent any lateral exchanges of underground flow. The silt-loam soil removed before excavation was put back to a depth of approximately 1 m. The surface of the basin was covered by grass and a central drainage trench was constructed at the intersection of the two slopes after three years of soil subsidence and a water-sampling instrument was installed (Gu and Freer, 1995). The rainfall is unevenly distributed during the year, with June, July and August accounting for 49 % of the annual rainfall. The mean annual precipitation is 1060 mm (period 1952–2016), and the average annual temperature is 14.9∘.
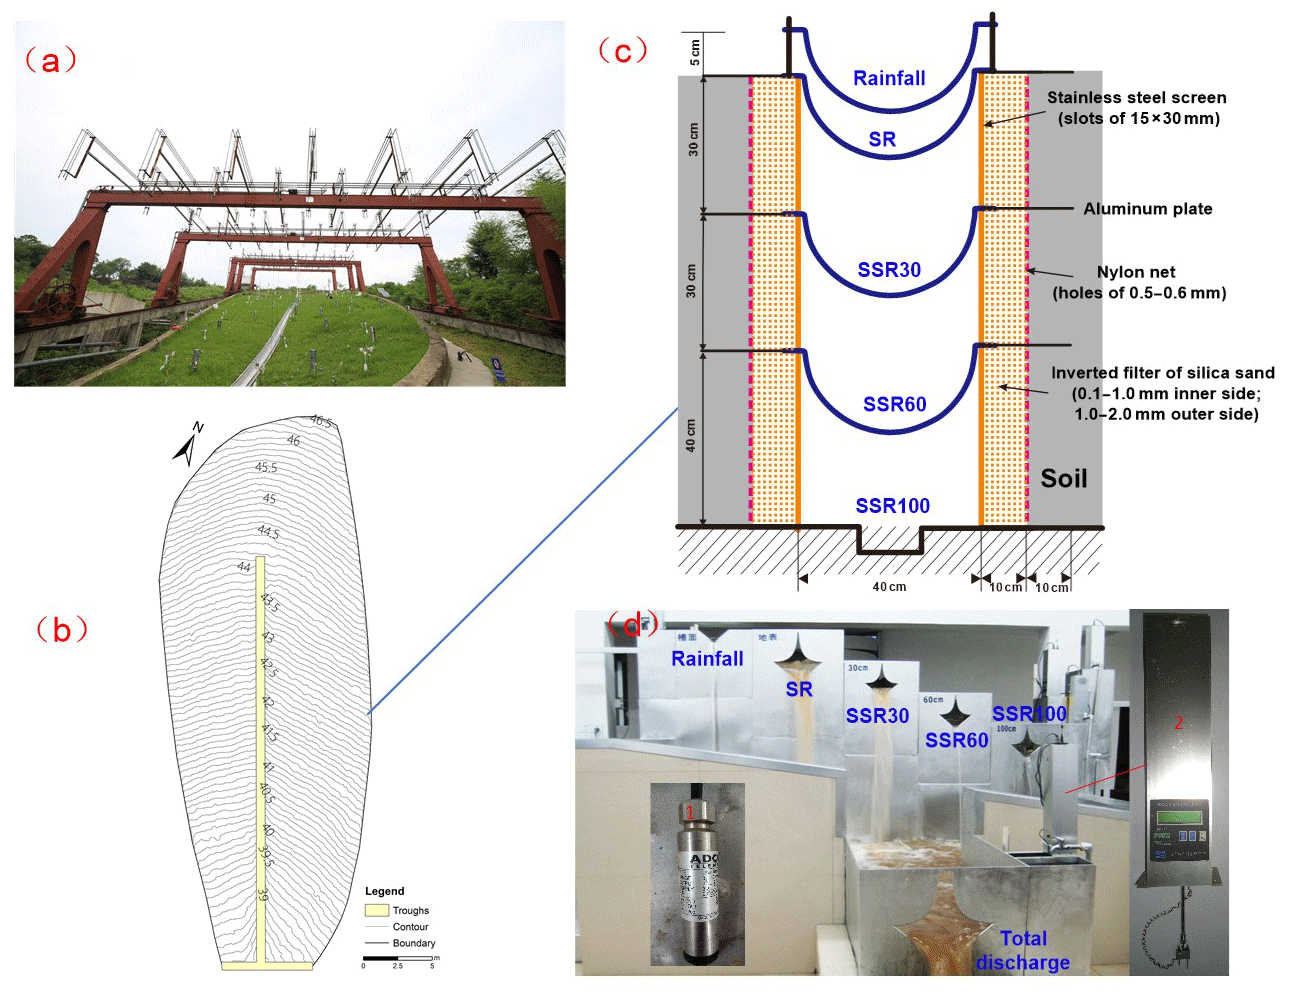
Figure 1Aerial view of the Hydrohill experimental catchment and measurements of runoff components, (a) aerial view of the Hydrohill catchment with observation devices, (b) contour line on the Hydrohill catchment, (c) and (d), runoff components measuring system at the outlet of the Hydrohill catchment. SR: surface runoff; SSR30, SSR60, and SSR100: subsurface runoff from soil layers of 0–30, 30–60, and 60–100 cm in depth.
This experimental catchment is equipped with a separate runoff observation system, which can monitor surface runoff and subsurface runoff from soil layers with depths of 0–30, 30–60, 60–100 cm (inferred as SSR30, SSR60, and SSR100) (Fig. 1b). Each trough has a 20 cm aluminum lip that extends horizontally into the soil layer to prevent leakage between layers. Hydrological cycling factors observation devices including tipping bucket-type micro pluviometers, rain cylinders, standard water collectors, soil moisture sensors, pressure water level gauges were installed at the Hydrohill catchment (Fig. 1).
2.2 Data collection
Rainfall data was measured by the four rain gauges located in the lower and upper parts of the catchment. The runoff data for surface water (SR), SSR30, SSR60, and SSR100 and the total runoff (TR) can be measured by the five 90∘ sharp crested V-notch weirs and logarithmic weirs at the outlet of Hydrohill (Fig. 1d). Continuous measurements were taken by using pressure-type stage recorders.
2.3 Sample collection and analysis
During 25–29 October 2016, 125 samples were collected at the catchment. These included rainwater, surface water and subsurface water. Rainfall samples were collected through a rainfall water collector with a diameter of 40 cm located on the observation room roof. The rain immediately arrived at the observation room through a pipeline. Rainfall samples were collected every hour during the rainfall event. Section negative pressure sampling was used to collect surface runoff and subsurface runoff samples. When there were typical points like peak points and valley points on the hydrograph, we started to collect water samples. Samples were stored in 50 mL high-density polyethylene (HDPE) bottles. HDPE bottles were washed by deionized water and rinsed with sample water three times at the time of collection. All samples were filtered through a 0.45 µm filter and then sealed before laboratory analysis. All the samples were transported to the laboratory in Nanjing and preserved at 4∘ until analysis.
All samples were analyzed for general parameters (pH, EC), major ions (K+, Na+, Ca2+, Mg2+, Si, Cl−, , and ), and stable isotopes (18O and 2H). pH and EC were measured in the field using a portable EC digital analyzer (HQ14d, Hach, USA) and a multi-parameter digital analyzer (HQ40d, Hach, USA). The hydrochemistry of all water samples was analyzed within two weeks of collection. Cations (K+, Na+, Ca2+ and Mg2+) and dissolved Si were analyzed by Inductively Coupled Plasma Optical Emission Spectrometry (ICP-OEC), and the anions (Cl−, and ) were analyzed by Dionex ICS-2100 Ion Chromatography. All samples were filtered through a 0.45 µm filter before laboratory analysis. The concentration of was determined by a titration assay on-site. 18O and 2H analyses were carried out by the 4th generation Los Gatos Research Liquid Water Isotope Analyser and expressed according to the Vienna Standard Mean Ocean Water (VSMOW).
3.1 Hydrological response in rainfall events
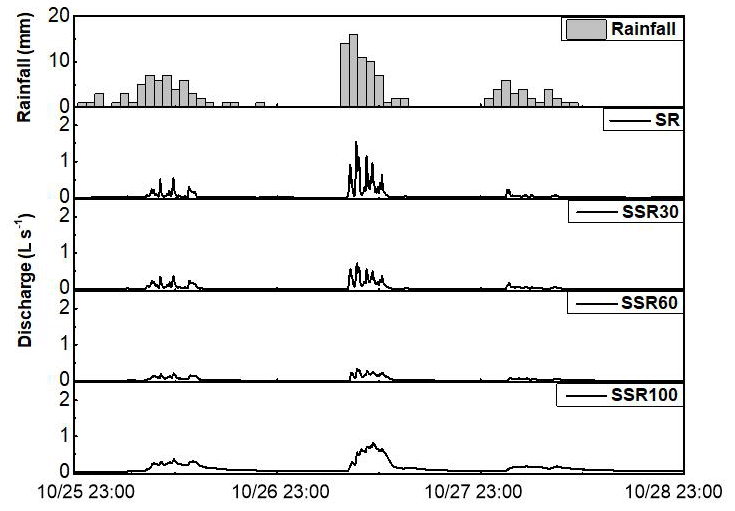
This rainfall event happened from 23:00 on 25 October to 12:00 on 28 October and can be divided into three major rainfall periods (Fig. 2). Because the whole depth of Hydrohill is 1m and the groundwater level is higher than 40 cm during this rainfall, SSR100 is regarded as groundwater runoff. This event was one of the biggest storms following a low-intensity rainfall event. The general hydrological characteristics of these floods, including rain volume, the maximum intensity in 1 h, mean intensity and peak discharge in separate runoff and total runoff, are concluded in Table 1.
Table 1Principal hydrological characteristics of the flood event in 2016.
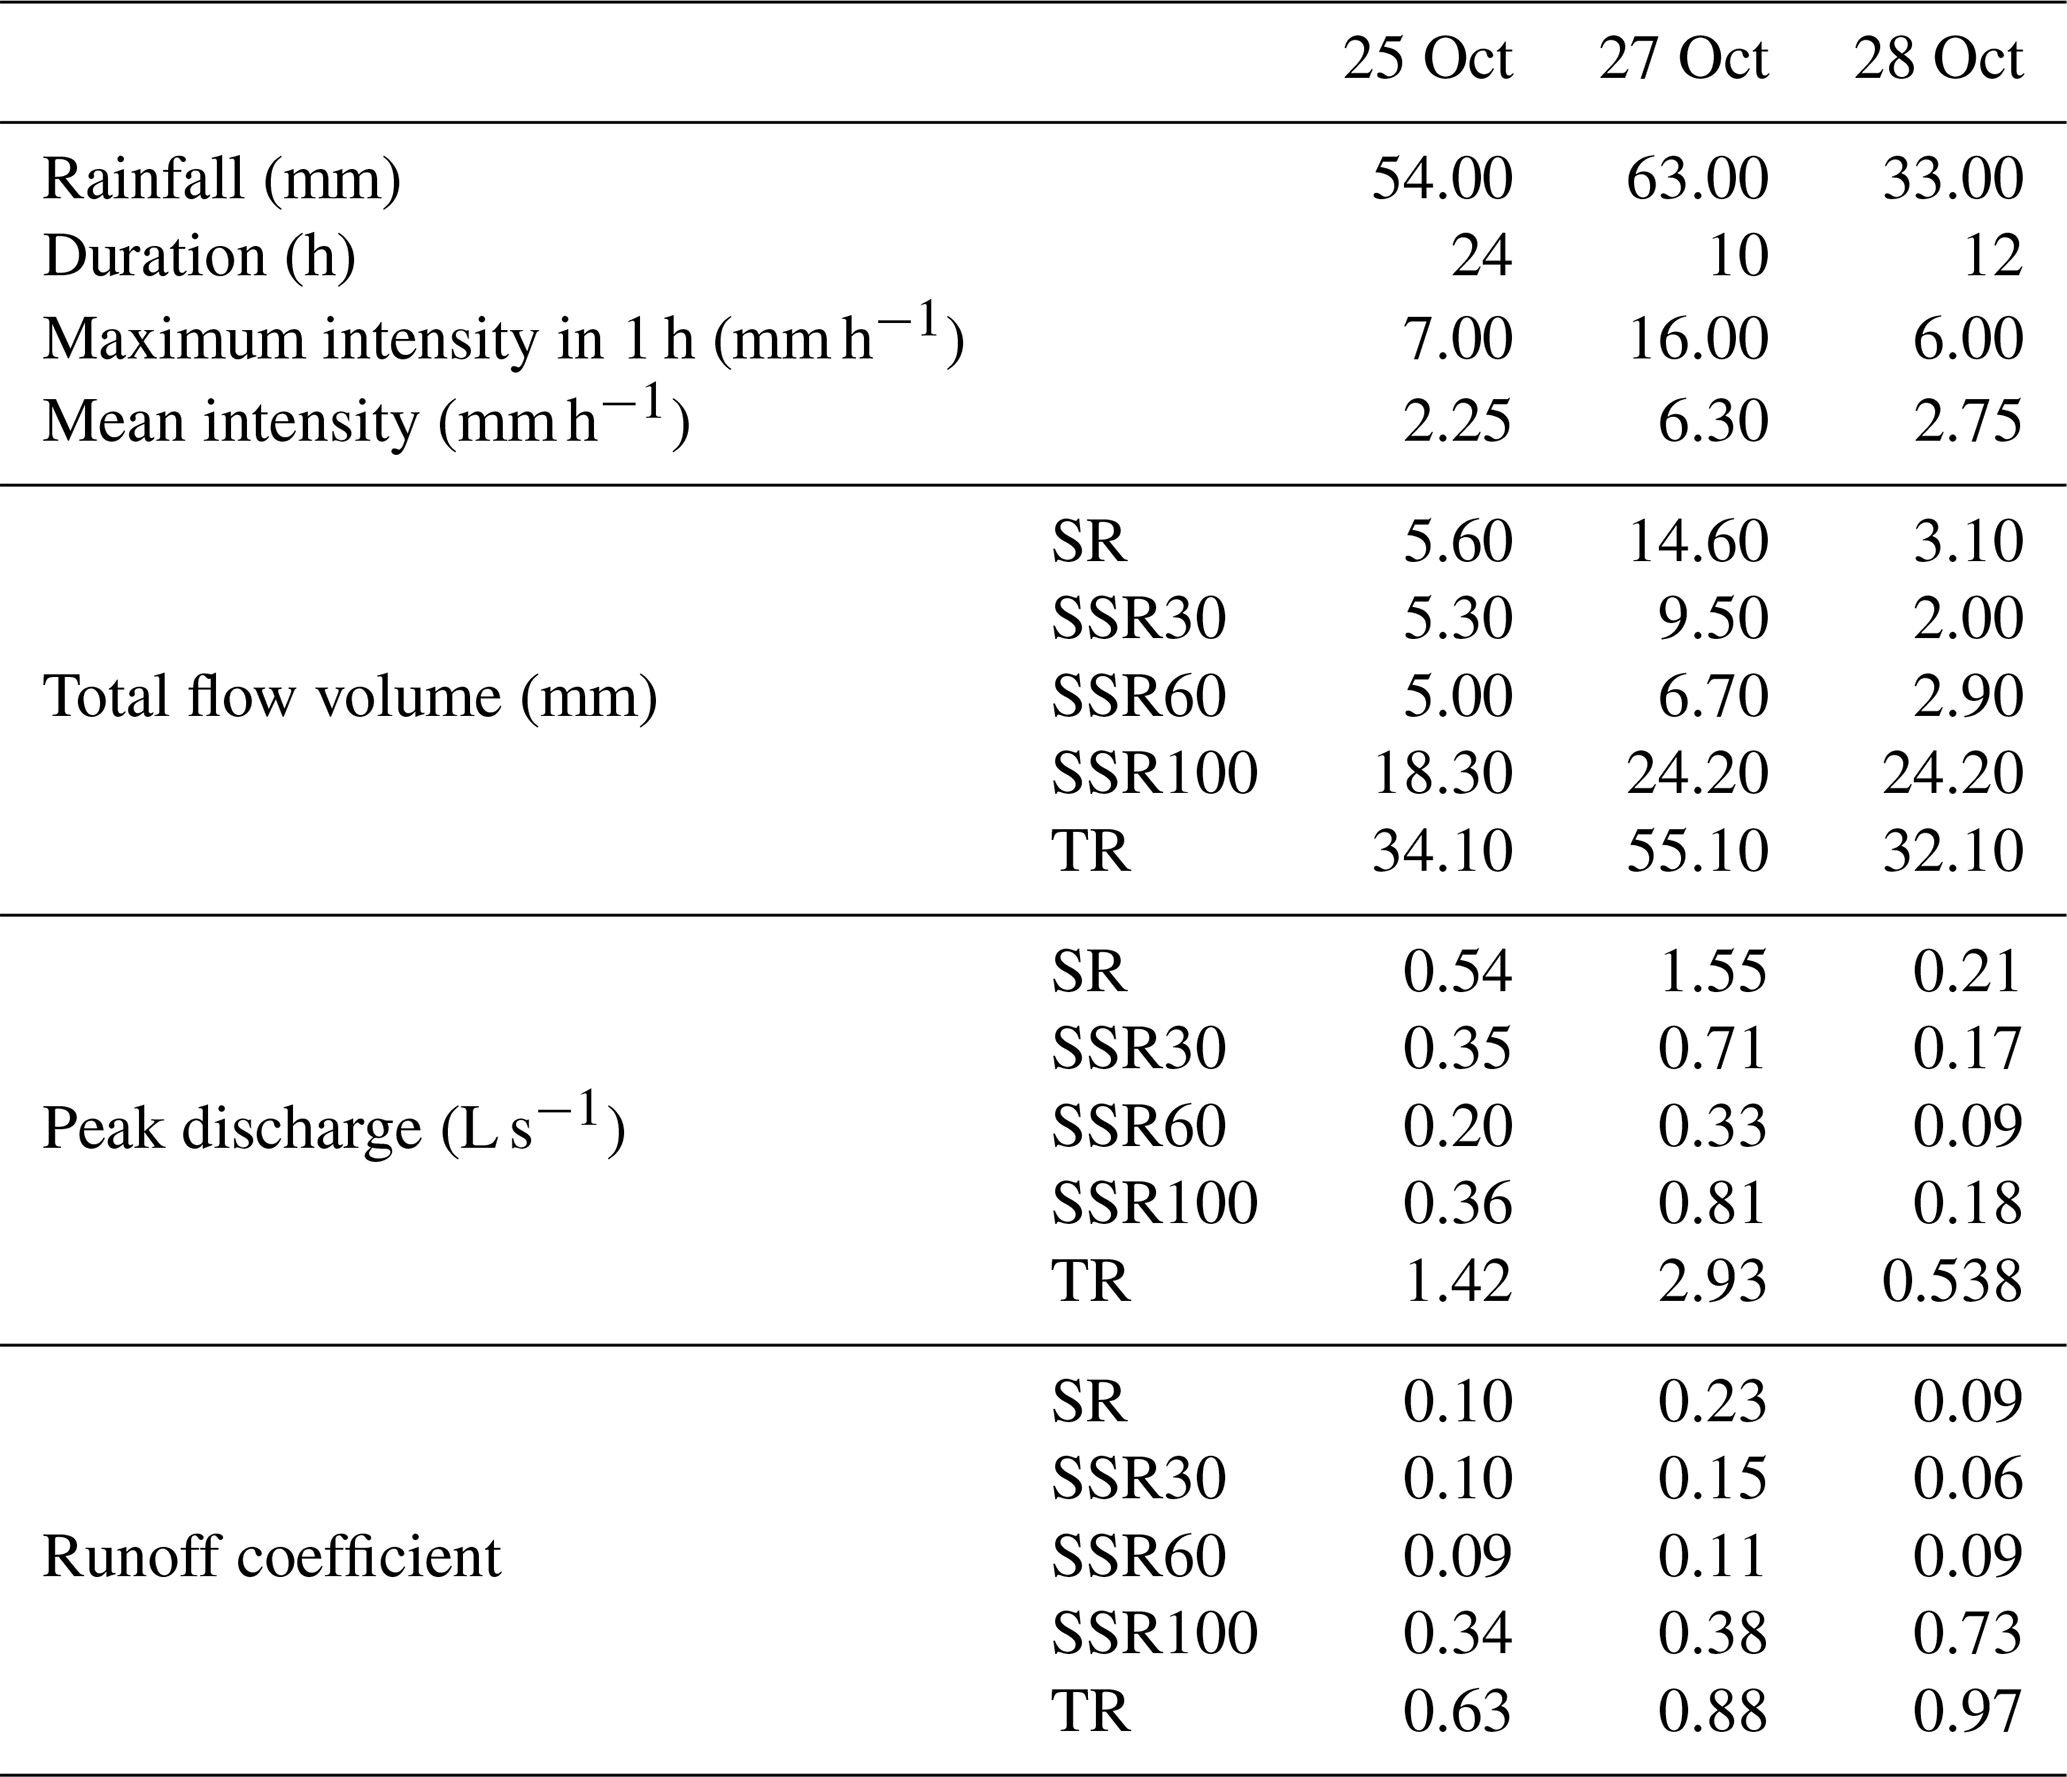
The first rainfall period occurred from 23:00 on 25 October to 23:00 on 26 October and the daily rainfall was 54 mm. Because there had been no recent storms, and the soil before the event was dry, there was a minor flow response. The discharge of the surface flow was nearly the same as the discharge of SSR30 and SSR60, all of which were smaller than SSR100. This indicates that the rainfall water infiltrated quickly and there was probably 25 % existing pre-event water. The second period was the largest and was a complex process among the three periods which occurred between 07:00 and 17:00 on 27 October . The runoff response was so quick due to the high rain volume. SR shows the quickest response and the volume of SSR100 was also the highest in all runoff components, with a little longer residence time than others. The third period which occurred during the whole day of October 28 was the shortest period. Though its process was also complex, the runoff response was slow and the SSR100 remaining was the largest runoff volume. The total runoff efficient (V∕R ratio) in Table1 showed that more than 60 % of the rainfall had infiltrated the soil reaching the total outlet of the catchment and the V∕R ratio of total runoff in the third period was the biggest (nearly 1.0) in all three rainfall periods, indicating that soil had almost been saturated. In the three successive periods, the V∕R ratio of SR, SSR30 and SSR60 in the second period was bigger than that in the other two periods. However, the V∕R ratio of SSR100 in the three periods was higher than that of SR, SSR30 and SSR60, indicating that other than the infiltrated water, existing water before this rainfall also contributed to the total runoff.
3.2 Hydrochemical Process
In this research, we analysed many more chemical parameters than previous studies to find more suitable tracers. The statistical results, including maximum values, minimum values and mean values of all indicators in this rainfall event, are shown in Table 2.
Table 2Results of the hydrological and isotopic analysis for various samples.
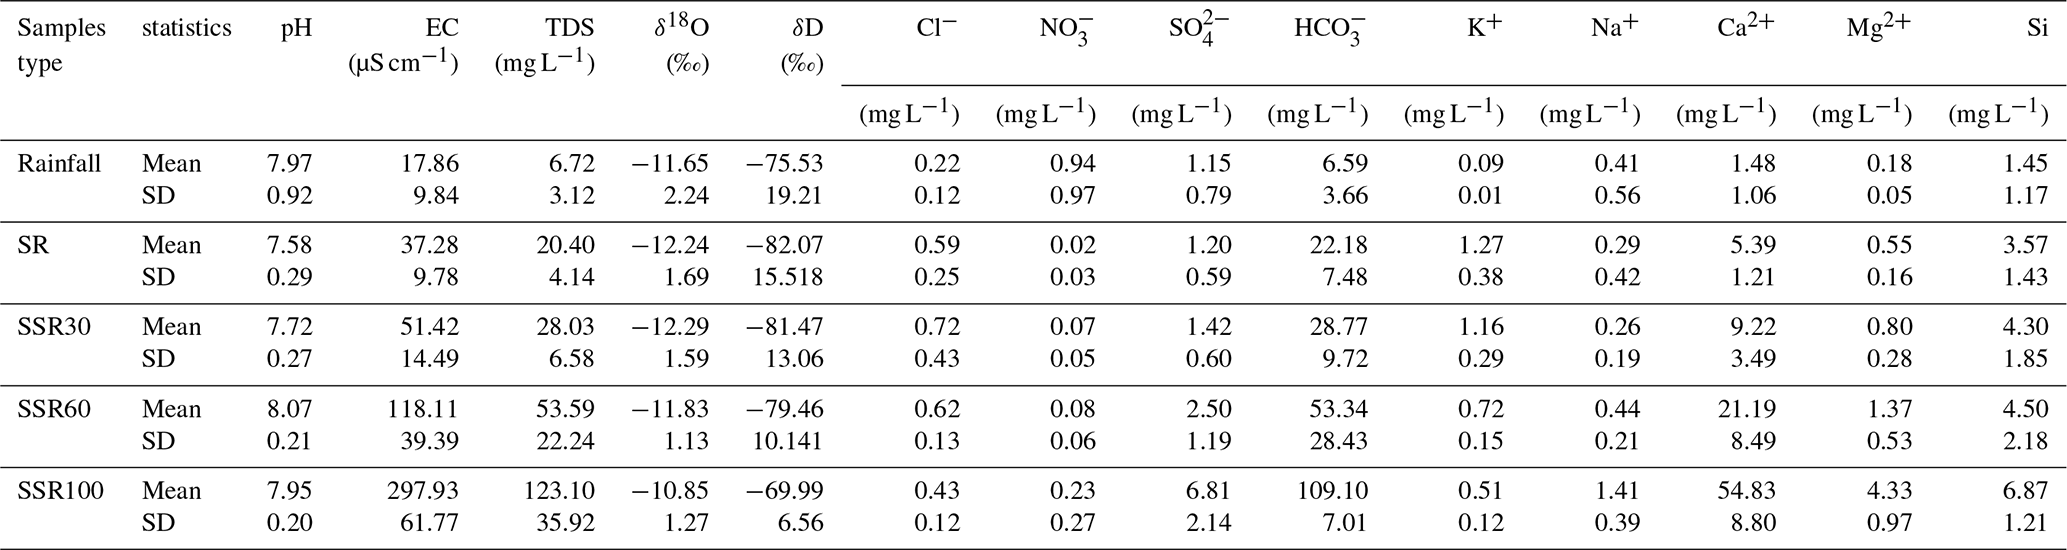
All three rainfall periods in this study showed vertical features of chemical components. The pH values of most samples ranged from 7.06 to 8.92, with an average value of 7.82, indicating an alkaline nature. The average pH values were 8.44 in rainfall, 7.58 in surface runoff, 7.72 in SSR30, 8.07 in SSR60, 7.95 in SSR100. The values of EC in water samples ranged from 9.81 to 394.00 µS cm−1 in this rainfall. Average EC values were 17.86 µS cm−1 in rainfall, 37.28, 51.42, 118.11 µS cm−1 in SSR30, SSR60 and SSR100, respectively. TDS is often calculated by adding together all the major cations: , and major anions: in mg L−1 (Walton, 1989). The lowest TDS value was recorded in the rainfall and the highest ranged between 76.65 and 197.77 mg L−1 found in SSR100. The TDS was 13.63–28.64 mg L−1 for surface water, 19.72–41.22 mg L−1 for SSR30 and 27.22–117.51 mg L−1 for SSR60. Average TDS values were 6.72 mg L−1 in rainfall, 20.40 mg L−1 in surface runoff, 28.03, 53.59 and 123.10 mg L−1 in SSR30, SSR60 and SSR100, respectively. So we can find that when the flow path is longer, both the TDS and EC values will show an increasing trend from rainfall to SSR100.
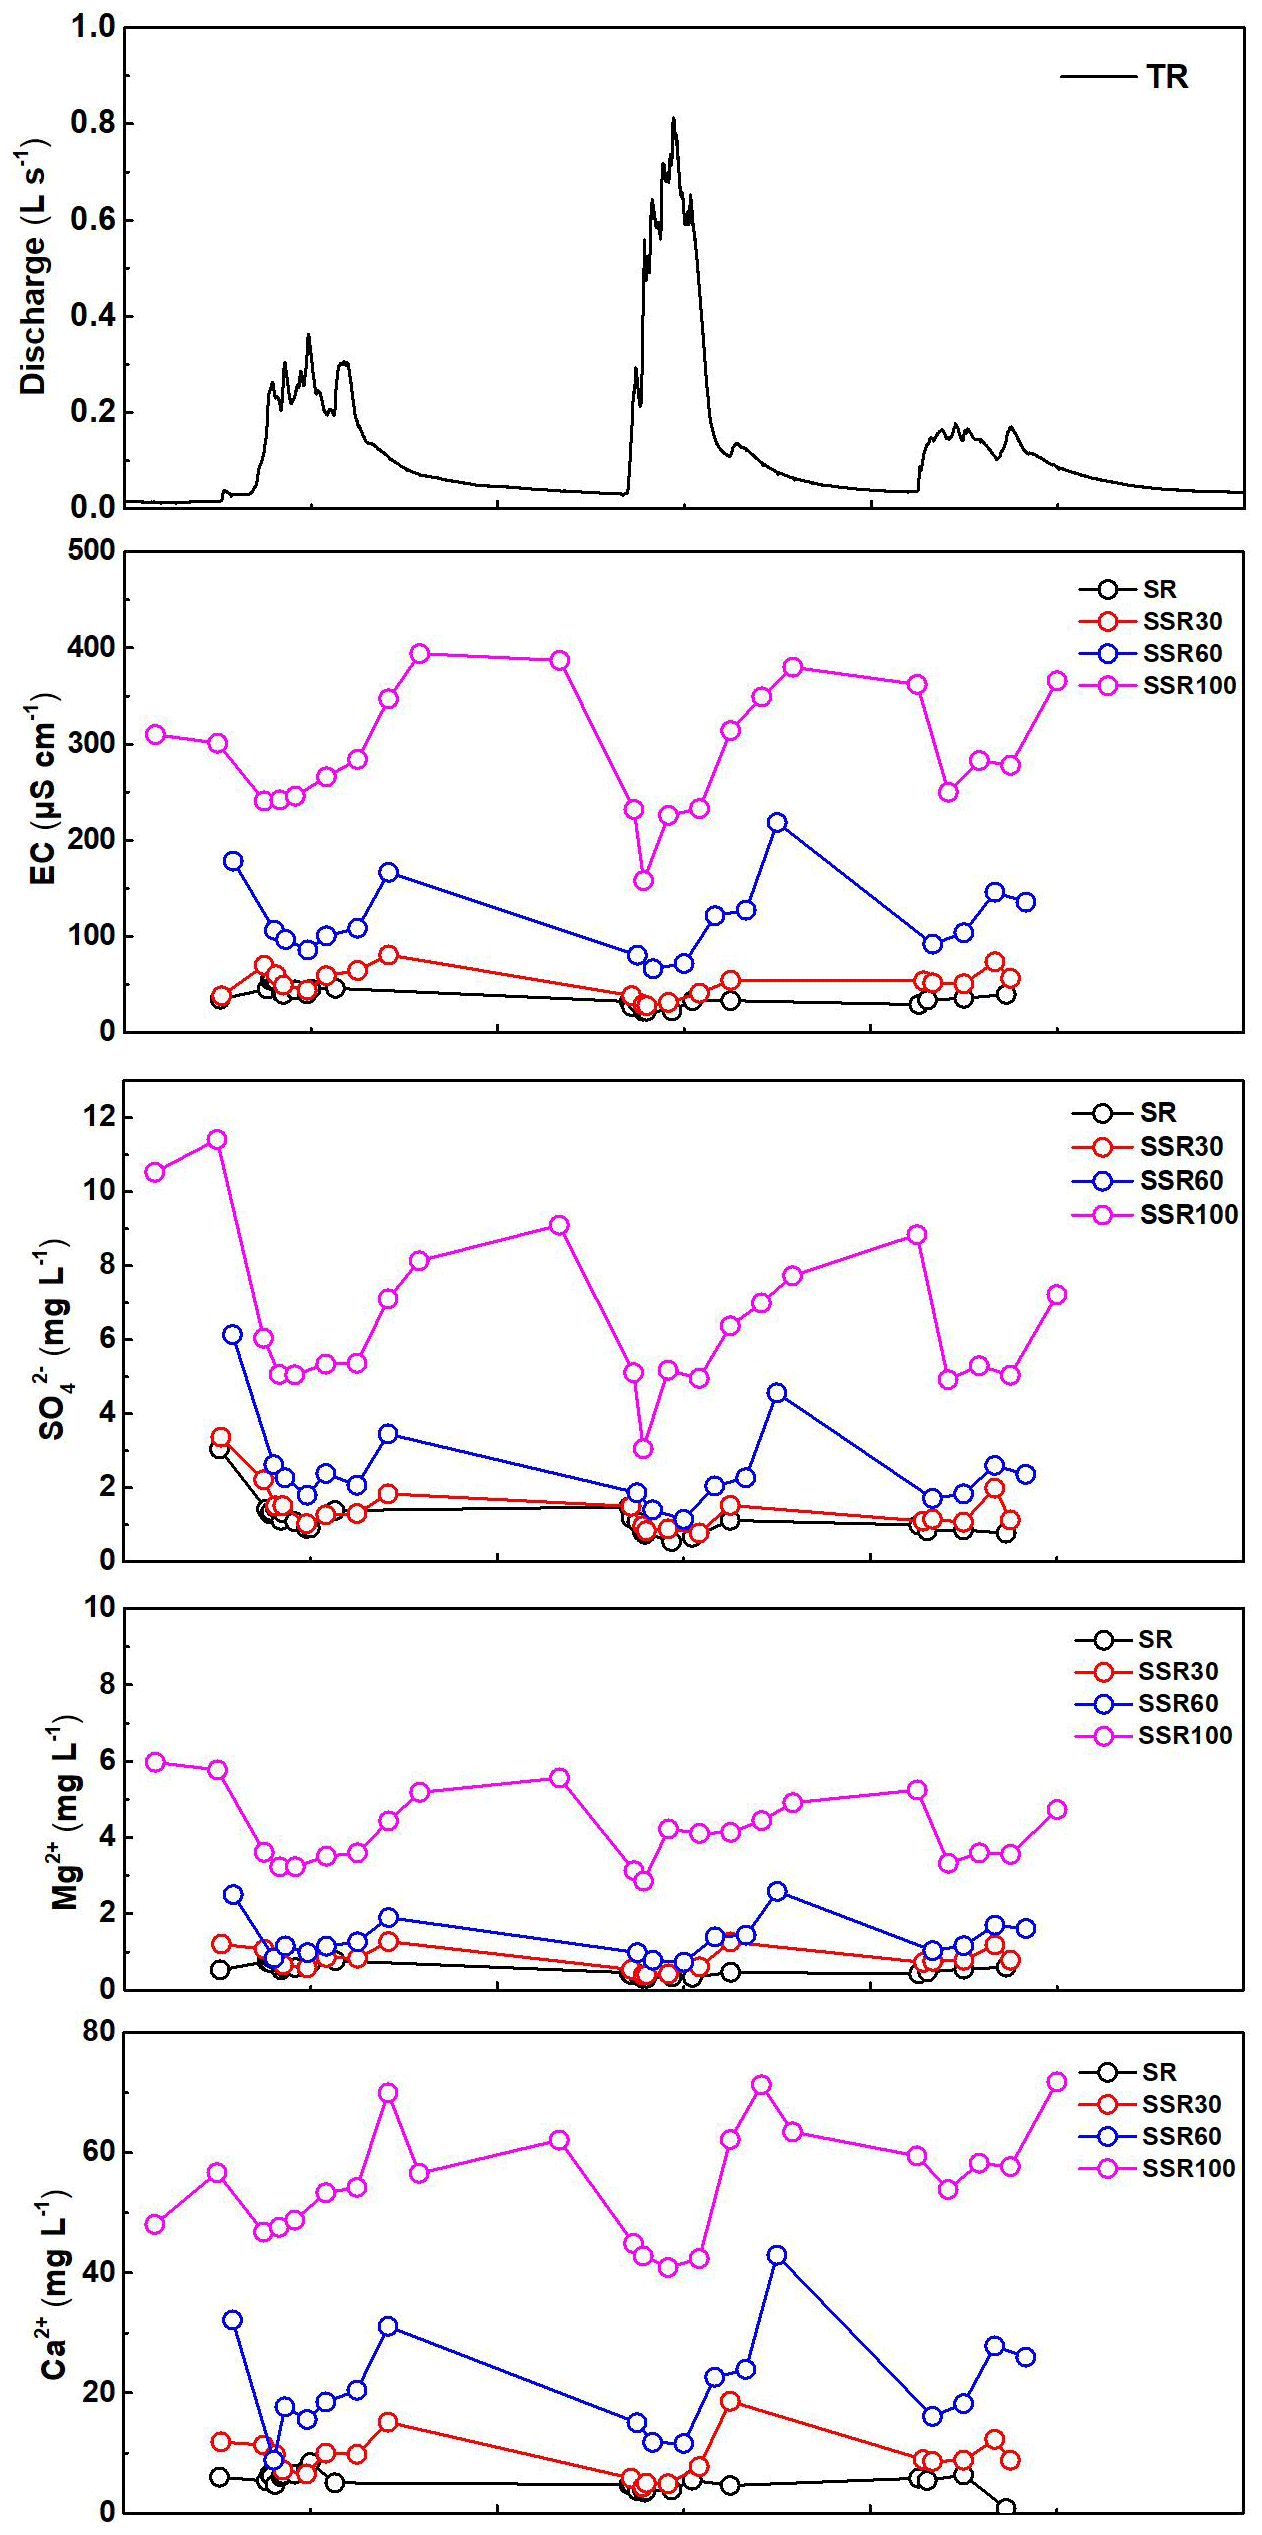
During the observation periods, the main conventional physical and chemical indicators (EC, TDS), and main ions (Mg2+, Ca2+ and ) showed similar characteristic patterns, i.e., with the depth of the water flow path increasing, hydrochemical tracers increased gradually (Fig. 3). Even though there are similar characteristics with Mg2+, Ca2+ and at some stage, it is still not certain whether K+, Na+, Cl−, and are applicable to hydrological process research. These indicators should be studied further. In addition, there are no apparent rules in values of pH, and dissolved Si, which cannot be regarded as applicable tracers. According to the characteristics of all the chemical tracers, three groups of the chemical behavior of the catchment discharge can be identified at the catchment outlet:
-
Group I: EC, TDS, Ca2+, Mg2+ and , which can be used as good tracers to identify runoff paths;
-
Group II: K+, Na+, Cl−, and , which are less applicable as tracers;
-
Group III: pH, , and dissolved Si, which are not suitable as tracers.
The patterns of concentrations in all the runoff components reflect the variable contributions of flow components to the catchment outlet according to the main origin of the chemical elements. The measurement of conductivity reflects the ion concentration in water (Hendrickx et al., 2002). In reverse, the increase of conductivity in each separate runoff explained the process of runoff components. During the migration process, the TDS of four runoff components originating from gas precipitation, dissolved solid precipitation, dissolved salts and ion exchange gradually rose (Gibbs, 1970).
originates essentially from the atmosphere but is concentrated within the catchment by evaporation processes and storage in soils (Liu, 1970). Ca2+ and Mg2+ are more affected by atmospheric sources and mineral weathering within the soil (Mcdonnell et al., 1990). Cl− would not form an insoluble salt with the main cations, so it is a stable component and is suitable to be a tracer (Shen, 2010). During the runoff process, Cl− will accumulate gradually with the growth of runoff path (Ladouche et al., 2001); however, in this study, Cl− didn't reflect the same pattern as other studies, and the change of Cl− is a complex mixing process. This finding is consistent with early work at the site by Kendall et al. (2001). The time-process changes of Ca2+, Mg2+ and were consistent, indicating that the controls on hydrochemical ions were uniform. Gu et al. (2007) previously found that the time-process changes of hydrochemical ions in runoff were similar to that in rainfall. This led to the conclusion that rainfall plays a leading role in this change; however, it is not the only source because the ion concentration gradually increases, which can also be affected by pre-event water. In addition, hydrochemical ions can be the result of biological processes and water-rock interaction in the soil, contributing to the increase of hydrochemical ions. So, it is possible that there is a mixture of pre-event water and event water in this rainfall, and a mixture of upper layer runoff infiltration and lower layer runoff in space.
3.3 Isotopic compositions of waters
In this study area, there was a lack of hydrogen and oxygen data in multi-year rainfall, but the data for Nanjing was adequate, allowing the local meteoric water line in Nanjing to be used in this area. Rainfall, SR, SSR30, SSR60 and SSR100 of this storm samples are distributed along the local meteoric water line (Fig. 4) in a δ18O-δD relation diagram (Tan et al., 2009):
which means that interflow water and groundwater are not influenced by the evaporation process (McDonnell et al., 1990). The rain seeps through the soil and the unsaturated zone and mixes with non-evaporated water from pre-event water (Ladouche et al., 2001).
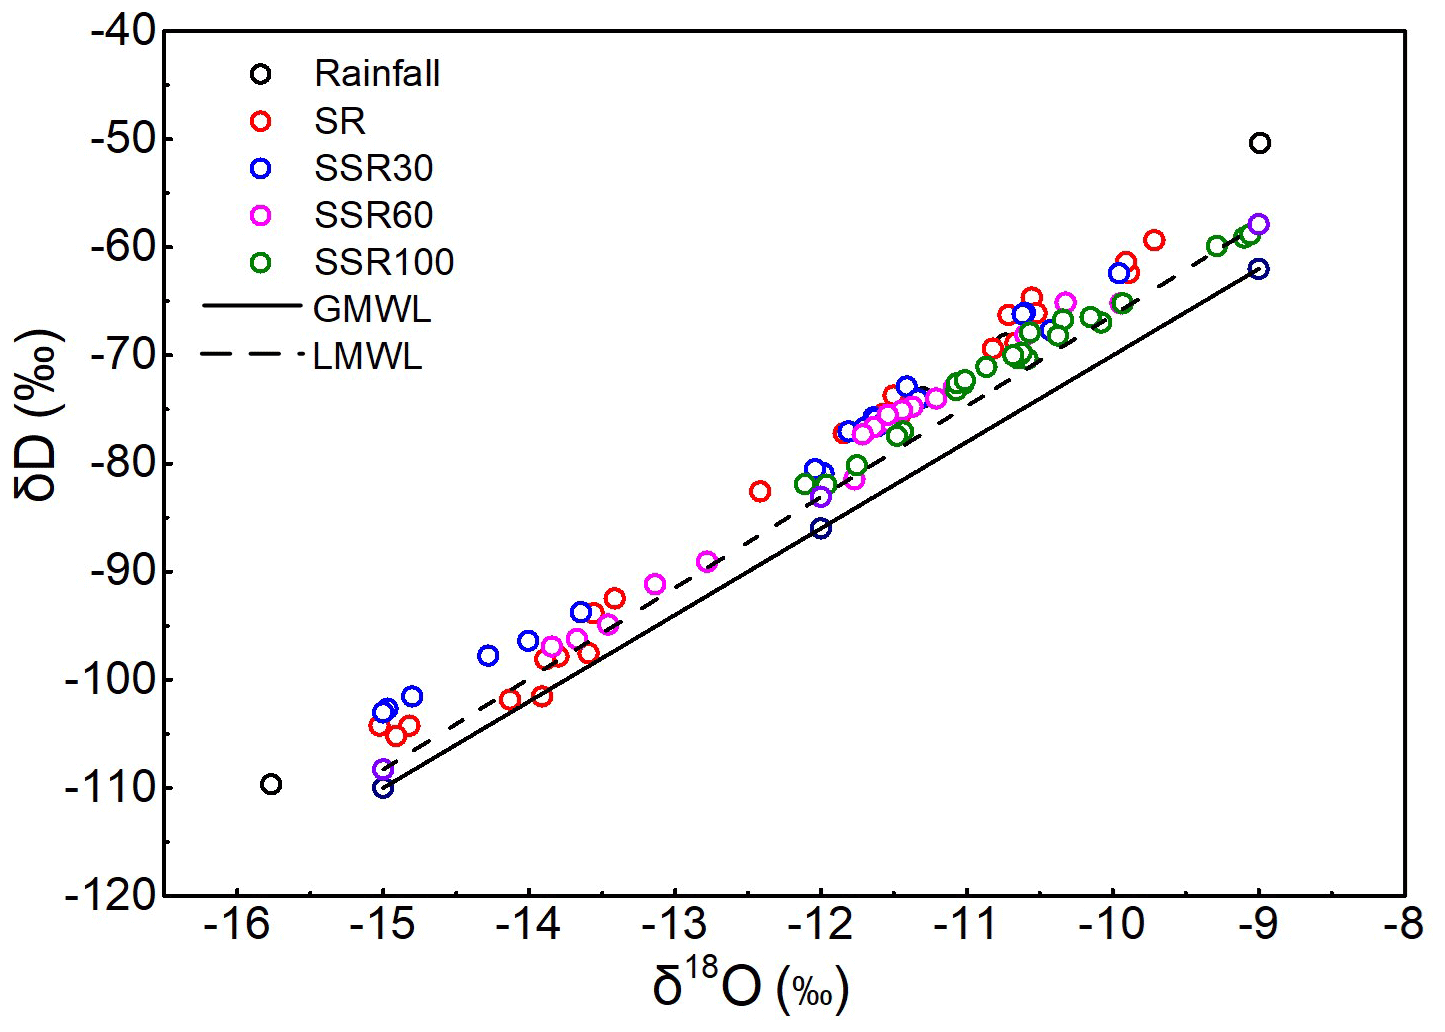
Figure 4Relationship between δ18O and δD in rainfall, SR, SSR30, SSR60 and SSR100. GMWL: Global Meteoric Water Line (Craig, 1961); LMWL: Local Meteoric Water Line (Tan et al., 2009).
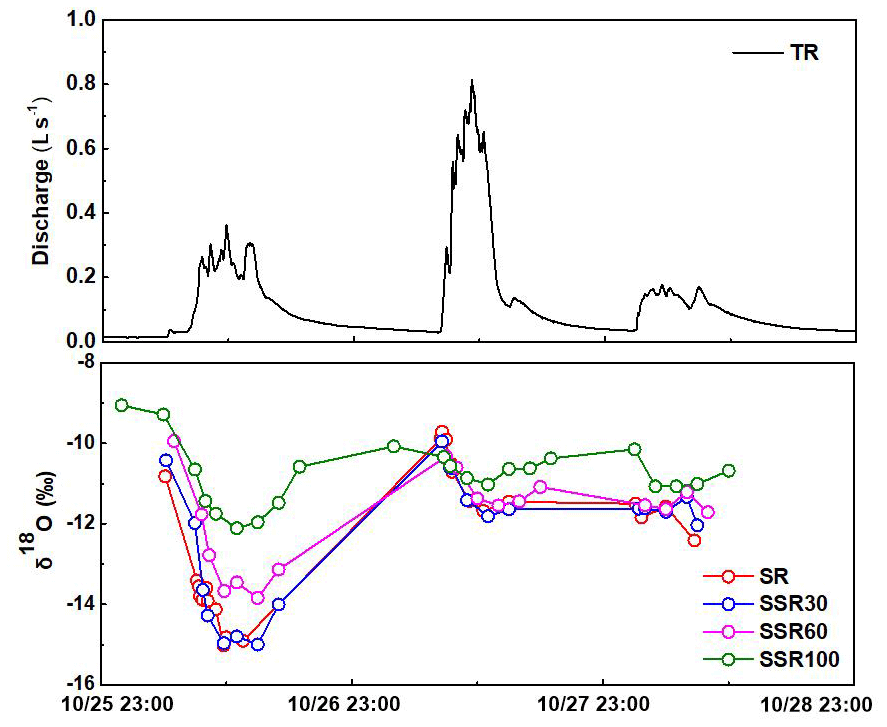
During the above three rainfall periods, the sampling of SR, SSR30, SSR60 and groundwater runoff showed a common isotopic characteristic (Fig. 5): a negative correlation between discharge and δ18O. The temporal isotopic content of δ18O in all the runoff components had tended to return to the initial value during the first recession stage, during which the δ18O sampling of groundwater was the richest and that of SR and SSR30 the most depleted, indicating that SR, SSR30, SSR60 may have been partially updated and diluted by the event water while there was still a large part of the pre-event water in the groundwater runoff. At the start of the rainfall, there was infiltration of depleted rainfall into the soil layer with enriched 18O, and rainfall and soil water mixed. However, due to the combination of event water and the water in the soil, the values of δ18O in SR, SSR30 and SSR60 became similar, which was apparent in the third period. As a result, the proportion of pre-event water became smaller as event water infiltrated. From Fig. 5, we can find that even though the rainfall volume of the second period was the largest, the difference between all the runoff components was smaller than that in the first stage, which indicated that the combination of rainfall and the soil water was almost over. The contributions of event water (rainfall) and pre-event water (soil water) during the rainfall event will continue to be studied in the following research. In this study, due to the linear relationship between δ18O and δD, δD shows consistent feature with δ18O.
3.4 Identification of rainfall-runoff flow paths
From the relationship between δ18O and different hydrochemical indexes (Fig. 6), we can find a linear relationship between δ18O and EC, TDS, , Ca2+ in different runoff and can identify the runoff path, including surface runoff and subsurface runoff. In detail, δ18O and EC, TDS, , Ca2+ had a negative relationship in surface runoff and SSR30 and showed a positive correlation in SSR60 and SSR100, and the values of hydrochemical indicators increased at depth.

In previous studies, Gu (1992), Gu and Freer (1995), and Gu et al. (2018) concluded that there are three runoff components including surface runoff, interflow in the unsaturated zone and groundwater runoff in the saturated zone at the Hydrohill catchment and obtained runoff production methods combined with hydrochemistry and isotope tracing. The processes of hydrochemitry and 18O in rainfall and different runoff components are related to its cause, flow paths, rainfall volume and intensity, etc. Hydrochemical ions and isotopes can enter the catchment with precipitation and flow through surface runoff and subsurface runoff to the total outlet. During this process, biological interaction and water-rock interaction take place. The bottom of Hydrohill is closed, and the final water source for runoff generation is rainfall. Though rainfall plays a leading role in the generation of runoff, it does not play a dominant role in hydro-geochemical components (Gu et al., 2007). The composition of hydrochemical and isotopic tracers in Hydrohill can vary due to the interaction between water and soil. Thus, tracers can be effective tools to identify flow pathways in rainfall-runoff processes.
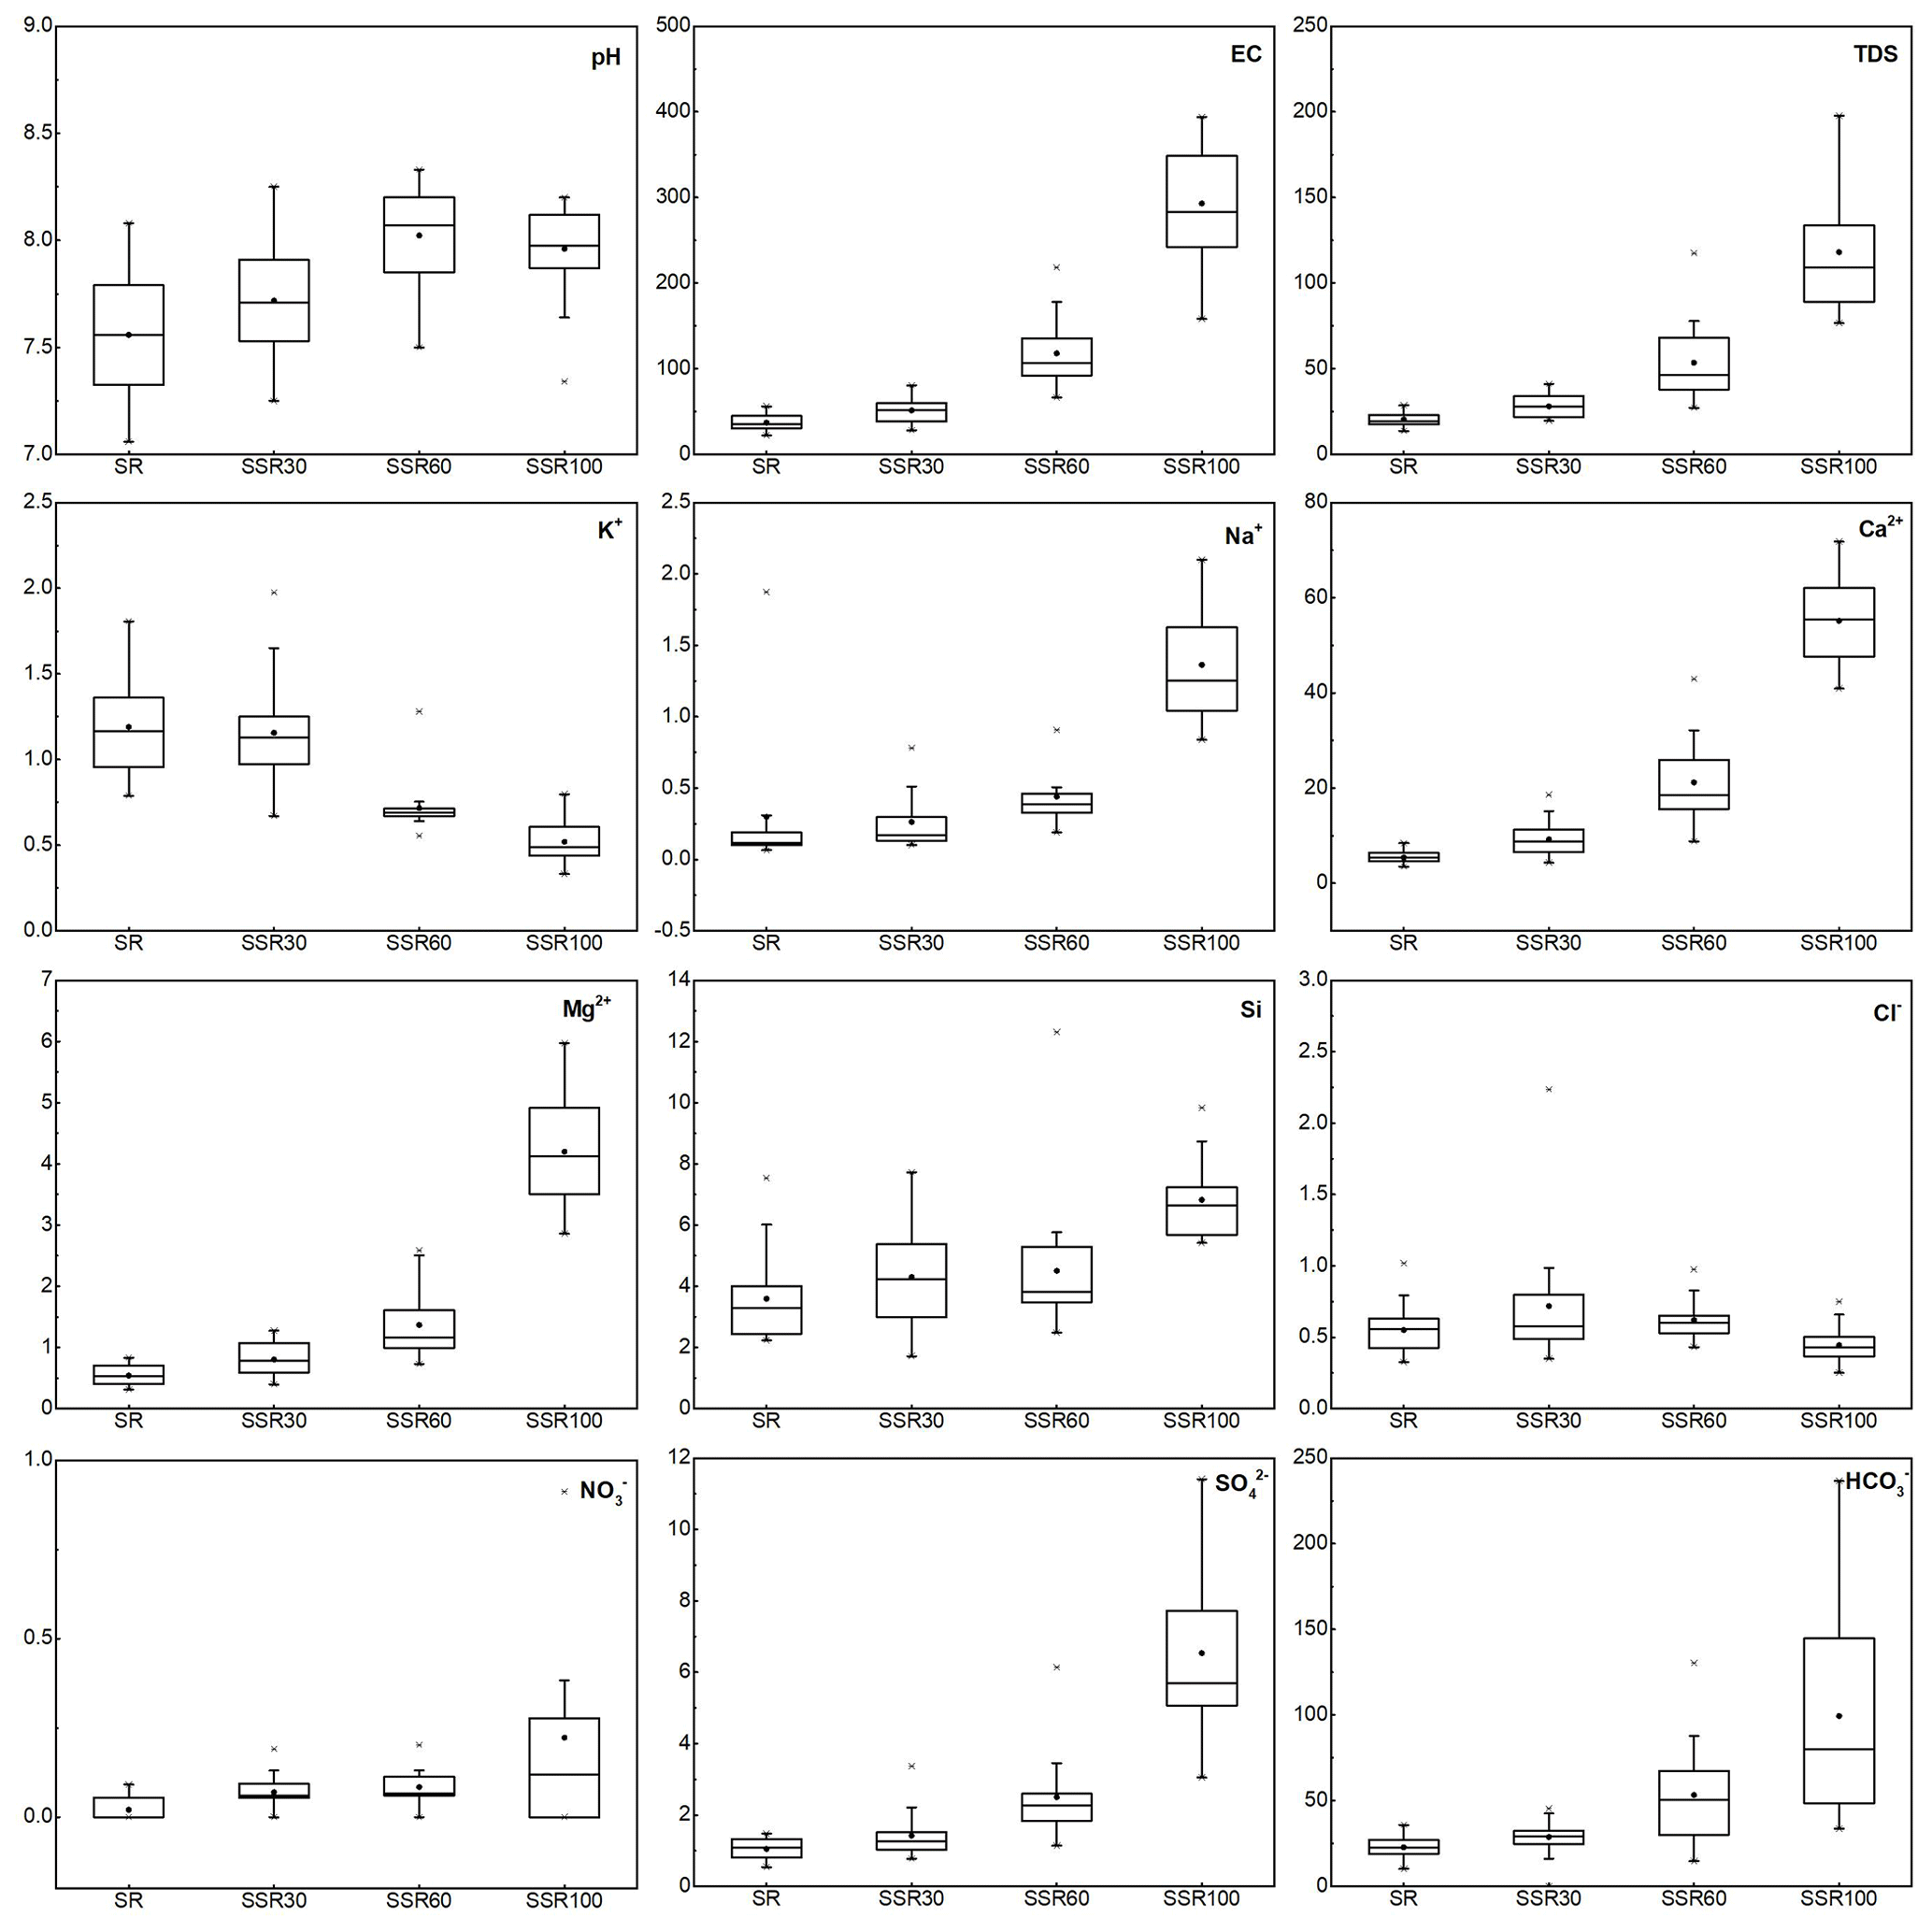
Figure 7Concentrations of K+, Na+, Cl−, in different runoff components for the rainfall-runoff events (The asterisk represents an outlier).
3.5 Hydrological and isotopic flux
During the three consecutive rainfall periods, surface runoff and subsurface runoff meet at the total outlet section. Meanwhile, the hydrochemical and isotopic indicators in the surface runoff and subsurface runoff make separate contributions to the total outlet output. Thus, the quantity of flow flux and mass fluxes of hydrochemical and isotopic indicators outputted from surface runoff, SSR30, SSR60, SSR100 and total runoff can be calculated by Eqs. (2) and (3),
where R is the quantity of flow flux from runoff components and M is the mass fluxes of hydrochemical and isotopic indicators outputted in the runoff; t1 and t2 represent two moments, respectively, Q is the quantity of flow at one sampling moment; c is the concentration of the solutes. The results of their contribution ratios for the total runoff in different runoff components in three rainfall events are shown in Table 3.
Table 3The contribution rate of the selected indexes during the hydrological periods.

In this rainfall event, runoff can mainly generate from SSR100 (groundwater runoff), contributing much more than SR, SSR30 and SSR60. Meanwhile, the mass fluxes of Ca2+, Mg2+, , and δ18O indicated that subsurface runoff contributed more to the total outlet, especially from groundwater runoff. As a result, the quantity of flow flux and mass fluxes of hydrochemical and isotopic indicators in groundwater runoff showed a positive relationship. The SR, SSR30 and SSR60 also showed a positive relationship, except that Ca2+ in SSR30 was smaller than SSR60, having an opposite relationship with the quantity of flow flux in SSR30 and SSR60. Even though different flow pathways existed in different rainfall events, in recent years, the hydrological community has come to a consensus that subsurface flow is generally dominated by the preferential flow of various kinds (Jones, 2010; Lin, 2010; Uhlenbrook, 2010). Subsurface preferential flow can route water through the subsurface, rather vertically and laterally. In addition, the contributions of Ca2+, Mg2+, and δ18O from SR, SSR30, SSR60 and SSR100 to the outlet in the three events indicated that runoff components originate from the mixing of event water and pre-event water, which is consistent with results of Kendall's study (Kendall et al., 2001). During the rainfall-runoff processes, different proportions of pre-event water have been updated by a different percentage of event water, but the detailed percentage of updated water was not calculated in this research.
In this study, the characteristics of hydrochemical and isotopic factors in one typical rainfall event were analyzed. Through the analysis, flow pathways and main water sources reaching the total outlet could be identified. In Fig. 7, there was an outlier among the values of almost all the indicators, and the outlier of K+ in SSR60, Na+ in SR, dissolved Si in SSR60 and Cl− in SSR30 exceeded much more than the upper limit. The uncertainty of the values may be mainly due to a measurement error or sampling error. Thus it is a little difficult to identify whether they can be good tracers to analyze the hydrological processes and they are classified in the second group and the third group. There is a need to collect more water samples from different rainfall events to determine this.
Studying hydrological processes enables us to know more about the flow paths, residence time distribution, and spatial distribution patterns of soil (Keith et al., 2010; Spence et al., 2010). This also means that hydrological processes are closely related to soil properties. For example, soil pores can influence flow pathways and soil moisture can affect hydrological processes, including solute transport and land-atmosphere interactions, as well as a range of geographic and pedogenic processes (Western et al., 2004). However, due to the lack of soil water data in this study, such as the soil water content and the hydrochemical and isotopic data of soil water, some further issues cannot be analyzed. Also, hydrograph separation for the event water and pre-event water and residence time distribution of runoff components in the Hydrohill catchment need to be studied.
Hydrochemical and isotopic methods are effective in tracing water movement from rainfall to runoff components at outlets of an artificial experimental catchment with separate runoff processes. EC, TDS, , Ca2+, Mg2+, 18O and D are more applicable to investigating rainfall and runoff processes at the Hydrohill experimental catchment. δ18O and EC, TDS, , Ca2+, Mg2+ had a linear relationship and their correlations can be used to identify runoff flow paths including surface runoff, interflow and groundwater runoff.
Flow flux and mass fluxes of main hydrochemical and isotopic tracers gauged at the Hydrohill catchment outlet, Ca2+, Mg2+, , and 18O in the total runoff are mainly from groundwater runoff (SSR100). However, the quantitative results were very encouraging as a basis to develop hydrological models for further study, including examination of hydrograph separation for event water and pre-event water and residence time of different runoff components.
Data is available based on request to the corresponding authors.
NY contributed results analysis and drafting the manuscript, JZ and GW structured the manuscript and contributed results discussion, JL contributed methodology of the work, GL contributed analysis on results reasonability, and AL contributed data collection and water sampling analysis.
The authors declare that they have no conflict of interest.
This article is part of the special issue “Hydrological processes and water security in a changing world”. It is a result of the 8th Global FRIEND–Water Conference: Hydrological Processes and Water Security in a Changing World, Beijing, China, 6–9 November 2018.
We appreciate Weizu Gu for his valuable comments and suggestions, Hao Zheng, Niu Wang for their assistance of data collection and laboratory analysis and Chaoyu Zheng, Tongping Liu for their water sampling.
This research has been supported by the National Natural Science Foundation of China (grant nos. 41830863, 51879162, 51609145, and 91647203), the Second Qinghai-Tibet Plateau Comprehensive Scientific Research Project (grant no. 2019QZKK0203), and the National Key Research and Development Programs of China (grant no. 2016YFA0601501).
Brian, A. P., Wilfred, M. W., Feng, X. H., and Charles, J. V.: The application of electrical conductivity as a tracer for hydrograph separation in urban catchments, Hydrol. Process., 22, 1810–1818, https://doi.org/10.1002/hyp.6786, 2010.
Baraer, M., McKenzie, J., Mark, B. G., Gordon, R., Bury, J., Condom, T., Gomez, J., Knox, S., and Fortner, S. K.: Contribution of groundwater to the outflow from ungauged glacierized catchments: A multi‐site study in the tropical Cordillera Blanca, Peru, Hydrol. Process., 29, 2561–2581, https://doi.org/10.1002/hyp.10386, 2015.
Carey, G. and Feng, X. H.: A stable isotope study of soil water: evidence for mixing and preferential flow paths, Geoderma, 119, 97–111, https://doi.org/10.1016/S0016-7061(03)00243-X, 2004.
Cartwright, I., Gilfedder, B., and Hofmann, H.: Contrasts between estimates of baseflow help discern multiple sources of water contributing to rivers, Hydrol. Earth Syst. Sci., 18, 15–30, https://doi.org/10.5194/hess-18-15-2014, 2014.
Craig, H.: Isotopic variations in meteoric waters, Science, 133, 1702–1703, https://doi.org/10.1029/93wr01684, 1961.
Gibbs, R. J.: Mechanisms controlling world water chemistry, Science, 170, 1088–1090, https://doi.org/10.1126/science.172.3985.870, 1970.
Gonzales, A. L., Nonner, J., Heijkers, J., and Uhlenbrook, S.: Comparison of different base flow separation methods in a lowland catchment, Hydrol. Earth Syst. Sci., 13, 2055–2068, https://doi.org/10.5194/hess-13-2055-2009, 2009.
Gu, W. Z.: Experimental Research on Catchment Runoff Responses Traced by Environmental Isotopes, Advances in Water Science, 3, 246–254, 1992 (in Chinese).
Gu, W. Z. and Freer, J.: Patterns of surface and subsurface runoff generation, in: Tracer Technologies for Hydrological Systems, Proceedings of Symposium Boulder, 229, 265–273, 1995.
Gu, W. Z., Lu, J. J., Zhao, X., and Norman, E. P.: Responses of hydrochemical inorganic ions in the rainfall-runoff processes of the experimental catchments and its significance for tracing, Adv. Water Res., 18, 1–7, 2007 (in Chinese).
Gu, W. Z., Liu J. F., Lin, H., Lin, J., Liu, H. W., Liao, A. M., Wang, N., Wang, W. Z., Ma, T., Yang, N., Li, X. G., Zhuo, P., and Cai, Z.: Why Hydrological Maze: The Hydropedological Trigger? Review of Experiments at Chuzhou Hydrology Laboratory. Frontiers in Hydropedology: Interdisciplinary Research from Soil Architecture to the Critical Zone, Vadose Zone J., 17, 1–27, https://doi.org/10.2136/vzj2017.09.0174, 2018.
Hendrickx, J. M. H., Das, B., Corwin, D. L., Wraith, J. M., and Kachanoski, R. G.: Relationship between soil water solute concentration and apparent soil electrical conductivity, Anal. Methods, 4, 1275–1282, 2002.
Hooper, R. P. and Shoemaker, C. A.: A comparison of chemical and isotopic hydrograph separation, Water Resour. Res., 22, 1444–1454, https://doi.org/10.1029/WR022i010p01444, 1986.
Hrachowitz, M., Bohte, R., Mul, M. L., Bogaard, T. A., Savenije, H. H. G., and Uhlenbrook, S.: On the value of combined event runoff and tracer analysis to improve understanding of catchment functioning in a data-scarce semi-arid area, Hydrol. Earth Syst. Sci., 15, 2007–2024, https://doi.org/10.5194/hess-15-2007-2011, 2011.
Hrachowitz, M., Benettin, P., Van Breukelen, B. M., Fovet, O., Howden, N. J., Ruiz, L., and Wade, A. J.: Transit times-the link between hydrology and water quality at the catchment scale, Wiley Interdisciplinary Reviews, Water, 3, 629–657, https://doi.org/10.1002/wat2.1155, 2016.
Hugenschmidt, C., Ingwersen, J., Sangchan, W., Sukvanachaikul, Y., Duffner, A., Uhlenbrook, S., and Streck, T.: A three-component hydrograph separation based on geochemical tracers in a tropical mountainous headwater catchment in northern Thailand, Hydrol. Earth Syst. Sci., 18, 525–537, https://doi.org/10.5194/hess-18-525-2014, 2014.
Huth, A. K., Leydecker, A., and Sickman, J. O.: A two-component hydrograph separation for three high-elevation catchments in the Sierra Nevada, California, Hydrol. Process., 18, 1721–1733, https://doi.org/10.1002/hyp.1414, 2004.
Jones, J. A.: Soil piping and catchment response, Hydrol. Process., 24, 1548–1566, https://doi.org/10.1002/hyp.7634, 2010.
Keith, D. M., Johnson, E. A., and Valeo, C.: A hillslope forest floor (duff) water budget and the transition to local control, Hydrol. Process., 24, 2738–2751, https://doi.org/10.1002/hyp.7697, 2010.
Kendall, C., McDonnell, J. J., and Gu, W. Z.: A look inside “black box” hydrograph separation models: a study at the hydrohill catchment, Hydrol. Process., 15, 1877–1902, https://doi.org/10.1002/hyp.245, 2001.
Klaus, J. and Mcdonnell, J. J.: Hydrograph separation using stable isotopes: review and evaluation, J. Hydrol., 505, 47–64, https://doi.org/10.1016/j.jhydrol.2013.09.006, 2013.
Ladouche, B., Probst, A., Viville, D., Idir, S., Baqué, D., Loubet, M., Probst, J. L., and Bariac, T.: Hydrograph separation using isotopic, chemical and hydrological approaches (Strengbach catchment, France), J. Hydrol., 242, 255–274, https://doi.org/10.1016/S0022-1694(00)00391-7, 2001.
Lin, H.: Linking principles of soil formation and flow regimes, J. Hydrol., 393, 3–19, https://doi.org/10.1016/j.jhydrol.2010.02.013, 2010.
Liu, C. Q.: Biogeochemical processes and cycling of nutrients in the earth's surface: cycling of nutrients in soil–plant systems of karstic environments, Southwest China, Science Press, Beijing, China, 1970 (in Chinese).
Liu, J. F., Gu, W. Z., Liao, A. M., Wang, N., Lu, J. J., Lin, J., Liu, H. W., Wang, W. Z., Ma, T., Cai, Z., Liao, M. H., Li, X. G., Zhuo, P., and Yang, N.: Hydrology of artificial and controlled experiments, Practice on the Watershed Hydrological Experimental System Reconciling Deterministic and Stochastic Subjects Based on the System Complexity: 1, Theoretical Study (chap. 11), 227–251, https://doi.org/10.5772/intechopen.78721, 2018a.
Liu, J. F., Liao, A. M., Wang, N., Lin, J., Liu, H. W., Wang, W. Z., Ma, T., Cai, Z., Liao, M. H., Li, X. G., Zhuo, P., Yang, N., Lu, J. J., and Gu, W. Z.: Hydrology of artificial and controlled experiments, Practice on the Watershed Hydrological Experimental System Reconciling Deterministic and Stochastic Subjects Based on the System Complexity: 2, Practice and Test (chap. 12), 253–281, https://doi.org/10.5772/intechopen.79357, 2018b.
Maurya, A. S., Shah, M., Deshpande, R. D., Bhardwaj, R. M., Prasad, A., and Gupta, S. K.: Hydrograph separation and precipitation source identification using stable water isotopes and conductivity: River Ganga at Himalayan foothills, Hydrol. Process., 25, 1521–1530, https://doi.org/10.1002/hyp.7912, 2011.
Mcdonnell, J. J., Bonell, M., Stewart, M. K., and Pearce, A.: Implications for Stream Hydrograph Separation, Water Resour. Res., 26, 455–458, 1990.
Mul, M. L., Mutiibwa, R. K., Uhlenbrook, S., and Savenije, H. H.: Hydrograph separation using hydrochemical tracers in the Makanya Catchment, Tanzania, Phys. Chem. Earth, 33, 151–156, https://doi.org/10.1016/j.pce.2007.04.015, 2008.
Pilla, G., Sacchi, E., Zuppi, G., Braga, G., and Ciancetti, G.: Hydrochemistry and isotope geochemistry as tools for groundwater hydrodynamic investigation in multilayer aquifers: a case study from Lomellina, Po plain, South-Western Lombardy, Italy, Hydrogeol. J., 14, 795–808, https://doi.org/10.1007/s10040-005-0465-2, 2006.
Robinson, Z. P., Fairchild, I. J., and Arrowsmith, C.: Stable isotope tracers of shallow groundwater recharge dynamics and mixing within an Icelandic sandur, Skeiđarársandur, Hydrology in mountain regions: Observations, processes and dynamics, 119–125, 2009.
Shen, X.: Natural Hydrochemistry, China Environmental Science Press, 102 pp., 2010 (in Chinese).
Spence, C., Guan, X. J., Phillips, R., Hedstrom, N., Granger, R., and Reid, B.: Storage dynamics and streamflow in a catchment with a variable contributing area, Hydrol. Process., 24, 2209–2221, https://doi.org/10.1002/hyp.7492, 2010.
Stadler, S., Sültenfuß, J., Holländer, H. M., Bohn, A., Jahnke, C., and Suckow, A.: Isotopic and geochemical indicators for groundwater flow and multi-component mixing near disturbed salt anticlines, Chem. Geol., 294, 226–242, https://doi.org/10.1016/j.chemgeo.2011.12.006, 2012.
Tan Z. C., Lu, B. H., Wang, J., and Sun, Y. Y.: Characteristics of stable hydrogen and oxygen isotopes of precipitation and runoff in Wudaogou Hydrological Experimental Catchment, J. Hohai Univ., 37, 650–654, 2009 (in Chinese).
Tardy, Y., Bustillo, V., and Boeglin, J. L.: Geochemistry applied to the watershed survey: hydrograph separation, erosion and soil dynamics. A case study: the basin of the Niger River, Africa, Appl. Geochem., 19, 469–518, https://doi.org/10.1016/j.apgeochem.2003.07.003, 2004.
Uhlenbrook, S.: Catchment hydrology-a science in which all processes are preferential, Hydrol. Process., 20, 3581–3585, https://doi.org/10.1002/hyp.6564, 2010.
Uhlenbrook, S., Frey, M., Leibundgut, C., and Maloszewski, P.: Hydrograph separations in a mesoscale mountainous basin at event and seasonal timescales, Water Resour. Res., 38, 1–14, https://doi.org/10.1029/2001WR000938, 2002.
Vincent, M., Jean-Francois, D. L., and Couren, M.: Investigation of the hydrological processes using chemical and isotopic tracers in a small Mediterranean forested catchment during autumn recharge, J. Hydrol., 247, 215–229, https://doi.org/10.1016/s0022-1694(01)00386-9, 2001.
Walton, N. R. G.: Electrical Conductivity and Total Dissolved Solids-What is Their Precise Relationship?, Desalination, 72, 275–292, https://doi.org/10.1016/0011-9164(89)80012-8, 1989.
Western, A. W., Zhou, S. L., Grayson, R. B., McMahon, T. A., Blöschl, G., and Wilson, D. J.: Spatial correlation of soil moisture in small catchments and its relationship to dominant spatial hydrological processes, J. Hydrol., 286, 113–134, https://doi.org/10.1016/j.jhydrol.2003.09.014, 2004.
Williams, M. W., Barnes, R. T., Parman, J. N., Freppaz, M., and Hood, E.: Stream Water Chemistry along an Elevational Gradient from the Continental Divide to the Foothills of the Rocky Mountains, Vadose Zone J., 10, 900–914, https://doi.org/10.2136/vzj2010.0131, 2011.
Yang, Y. G., Xiao, H. L., Zou, S. B., Zhao, L. J., Zhou, M. X., Hou, L. G., and Wang, F.: Hydrochemical and hydrological processes in the different landscape zones of alpine cold region in China, Environ. Earth Sci., 65, 609–620, https://doi.org/10.1007/s12665-011-1108-7, 2012.
Zhang, Q., Knowles, J. F., Barnes, R. T., Cowie, R. M., Rock, N., and Williams, M. W.: Surface and subsurface water contributions to streamflow from a mesoscale watershed in complex mountain terrain, Hydrol. Process., 32, 954–967, https://doi.org/10.1002/hyp.11469, 2018.
Zhao, R. J.: Catchment Hydrological Modelling, Water Conservancy Press, Beijing, 76–79, 1989 (in Chinese).