the Creative Commons Attribution 4.0 License.
the Creative Commons Attribution 4.0 License.
 | 16 Sep 2020
The Runoff Observation and Composition Analysis in the Niyang River Basin on the Tibetan Plateau
Jiufu Liu
Wenzhong Wang
Xing Min
Hao Zheng
Xiyuan Deng
Niu Wang
In order to study on the hydrometric methods in the high-altitude area, and learn more about the hydrological mechanism in the Qinghai-Tibet Plateau, a series of observation research were carried out in the Niyang River watershed, a tributary of the Yarlung Zangbo River. The glacier recession and the runoff variation which conducted by the climate change asked people to study more on the plateau hydrology, where is extremely lack of the hydrological monitoring and dataset in the past due to the high altitude and the cold environment. In this study, 4 basins with the areas of 182, 216, 243, 213 km2 was equipped with different types of hydrometric instruments, so that the precipitation (rainfall and snow), water level, flow speed and the meteorological elements could be measured. In addition, the soil and water in the watershed were sampled at the altitude from 3667 to 6140 m, which could be used to analyze the runoff composition. With the equipment, the applicability of the hydrometric methods and instruments were discussed according to the monitoring situation. With the samples' analysis results (including the δD, δ18O, and the chemical components), the runoff composition characteristics were analyzed. This research is funded by the NSFC project 91647111 and 91647203, which are included in the Runoff Change and its Adaptive Management in the Major Rivers in Southwestern China Major Research Plan.
- Article
(11090 KB) - Full-text XML
- BibTeX
- EndNote


The Qinghai-Tibet plateau, so-called Asian Water Tower (Immerzeel et al., 2010; Viviroli et al., 2007), origins many large rivers in Asia, including the Yangtze River, Yellow River, Yarlung Zangbo River (Brahmaputra River), Lancang River, Nu River, etc (Fig. 1). Water resources and hydro energy are quite rich in this area, and more than 500 billion m3 fresh water flows out of China through the Yarlung Zangbo river, Lancang river, and Nu river (Yao et al., 2000) The region is a climate change sensitive area, and its water resources situation is obviously affected by climate change. In the past 50 years, the glaciers in the southwestern river source area have been retreated, and the snow line has risen. Accordingly, the runoff in the Southwest China increased significantly (Immerzeel et al., 2010), but whether it has encountered the inflection point is still unclear (Piao et al., 2010). In a changing climate with the water resources demands growth, the role that Asian Water Tower plays for the regional water river supply have to be identified more closely, which is based on understanding of the runoff variation trends and mechanism in the plateau area.
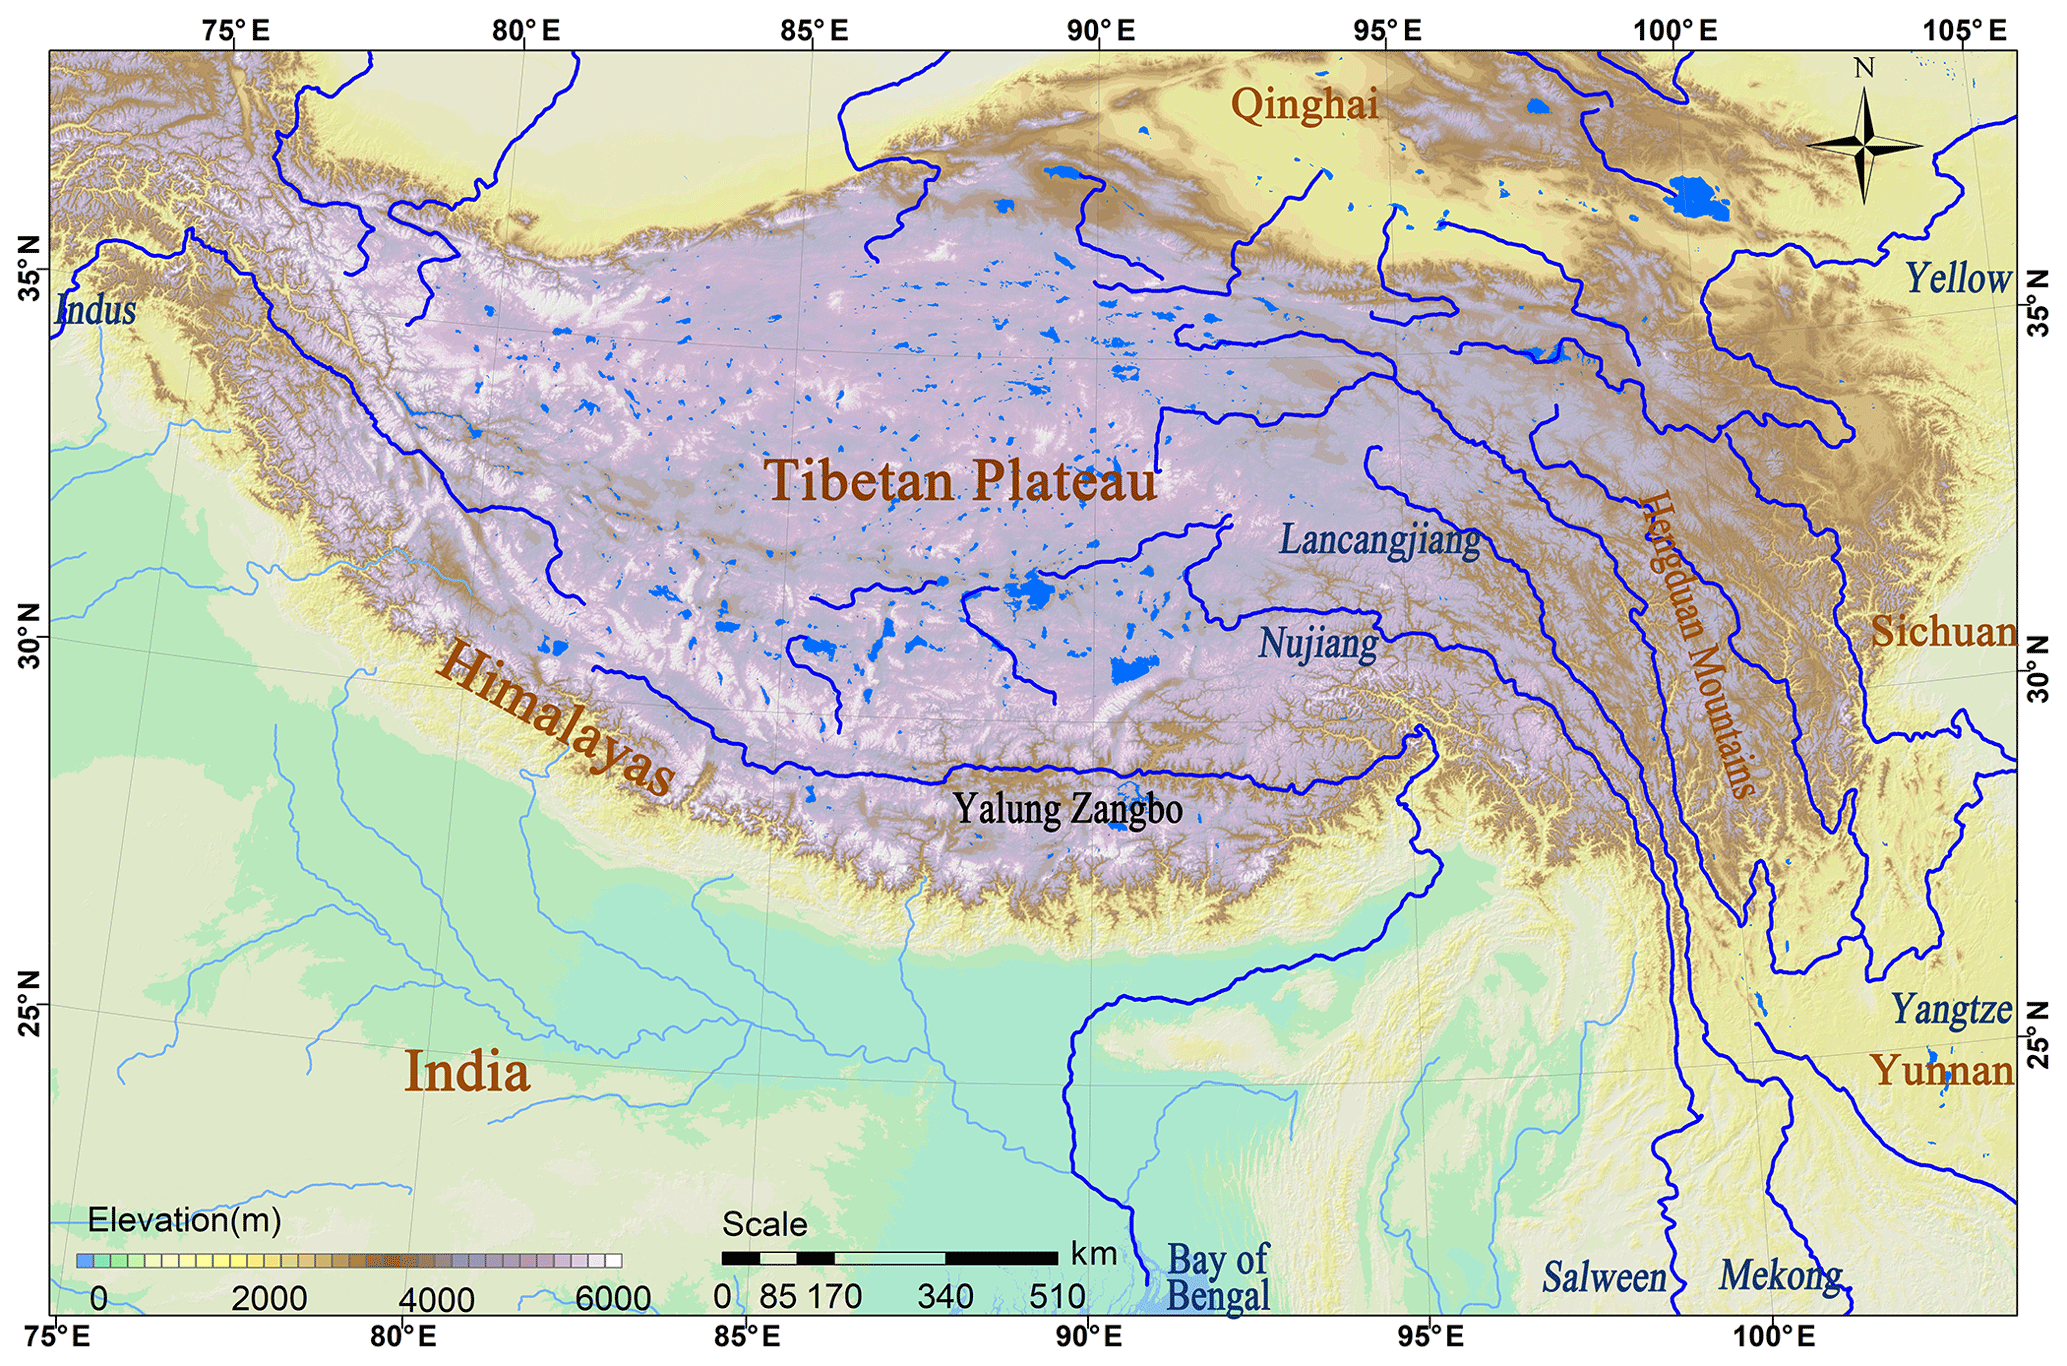
Figure 1Large rivers flow out of Tibet Plateau.
Although there is great need for the knowledge of the runoff evolution and biogenic substances migration and transformation for developing strategies for adaptive utilization of runoff, progress in study on these hydrological questions lags behind in the Qinghai-Tibet plateau than the other regions because of lack of observation dataset (Liu et al., 2016; Yin et al., 2016). Scarce hydrometric network was built in the extremely topographically biased alpine region, for what accumulated observing records were far from adequate for researching the highly spatial heterogeneity of hydrological, meteorological and climatological patterns (Briggs and Cogley, 1996; Liu et al., 2016; Viviroli et al., 2007). A consensus is that the research in data scarce areas would be a long-term mission for the hydrologists, due to that the IAHS (International Association Of Hydrological Sciences) started an PUB plan (Predictions in Ungauged Basins) in the 23rd IUGG conference in 2003 (Sivapalan et al., 2003). The PUB methods also depend on the regional hydrological and meteorological knowledge, or the new remote sense satellites and the data fusion (Blöschl et al., 2013; Liu et al., 2010). Consequently, sound monitoring dataset is an irreplaceable foundation for the hydrological research and development basically. Fortunately, new methods development, especially the sensing and information technology, provide more possibilities for the high altitude, extremely cold, and mountainous plateau, with which hydrological research will focus on much wider range of spatial and temporal scales and interactions between water, earth, and biological systems (Montanari1 et al., 2015).
Benefit from the information technology development and internet of things, traditional sensors are redesigned to monitor, record, and transformation hydrometric data automatically (Shu, 2005). The monitoring data could break away from the spatial distance and physical network, which make building the hydrometric network in the depopulated alpine zones (Meyer and Huey, 2006), such as the discharge measurement based on the intelligent control of hydrological cable (Yuan et al., 2004), the automatic hydrometric boat (Wu and Kong, 2017), ADCP (Liu, 2016), and so on. Generally, the online monitoring hydrometric technologies with the contact-type sensors are able to use practically in the hydrometric networks. And more non-contact-type sensing technologies are developing, including grand-based, airborne-based, and satellite based remote sensors. The ground-based water level and discharge radar, and the ultrasonic water level meter had been widely used in the hydrometric stations (Shu, 2005). Airborne lidar was used for the terrain elevation scan and modelling, with which the hydraulic model could be develop to calculate the river discharge (Roub et al., 2012). Air-based flow velocity measurement technique is also developing. The satellite-based radar and multispectral camera data are widely used for the precipitation monitoring and forecasting (Wandishin et al., 2005), total water storage (Long et al., 2015), variation of the snow cover and glacier (Deems et al., 2013; Nolan et al., 2015).
Since 2015, the NSFC launched a Major Research Plan named Runoff Change and its Adaptive Management in the Major Rivers in Southwestern China, which focus on the research of the analysis of the water and its solute sources, runoff variation, and the adaptive management mainly in the Qinghai-Tibet plateau region. Observation of the hydrological information is a critical portion of the plan, which focus on the effective monitoring methods of the water quantity, water quality and other relevant elements in the alpine environment.
The high-altitude region with low air pressure, low temperature, and strong ultraviolet ray bring a lot of problems on using the hydrological and meteorological monitoring instruments, for what A series of hydrological monitoring and water components analysis field experiments were carried out in a sub-basin of the Yarlung Zangbo River, named Niyang River Basin. It is expected to develop the hydrometric network construction principles and understand the runoff components better.
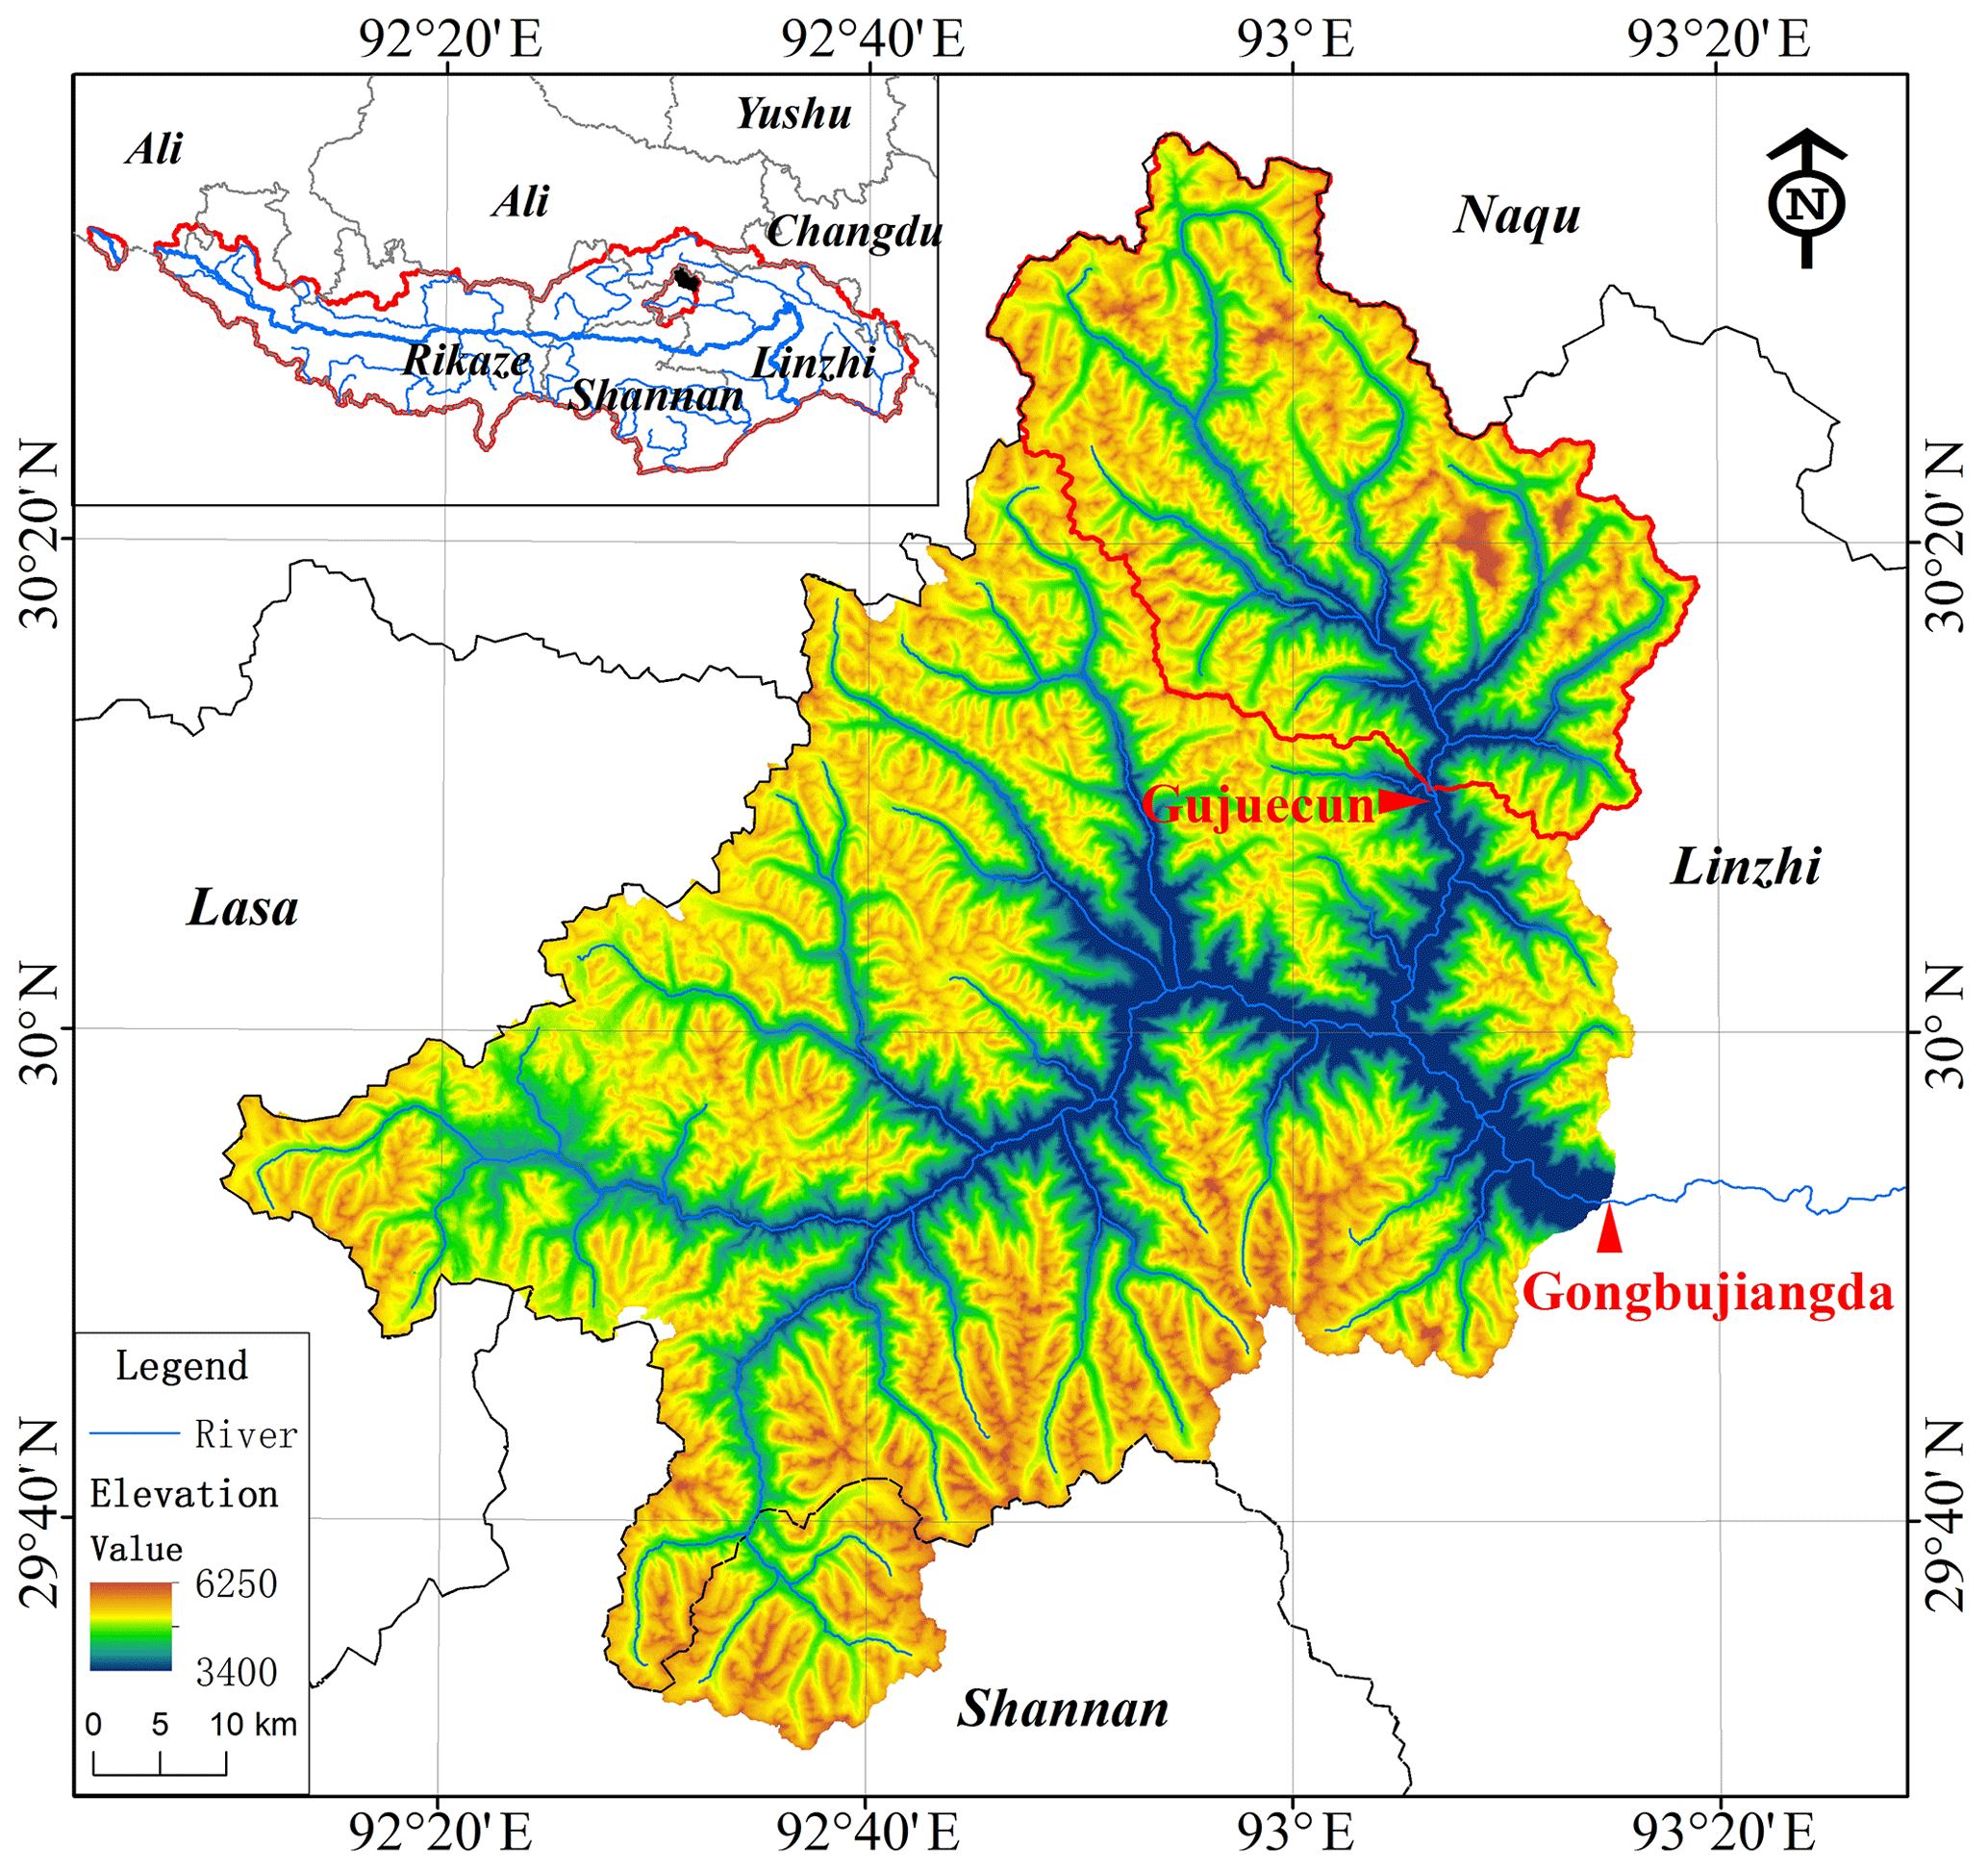
Figure 2Map of the study area (1. Yarlung Zangbo, 2. Gongbujiangda, 3. Gujuecun Basin).
2.1 Site Locations
The study area locates in the Niyang River Watershed, which is a tributary of the Yarlung Zangbu River in the Qinghai-Tibet Plateau. The interest basin named Gujuecun Basin is in the area of Gongbujiangda Country belongs to the Tibet autonomous region (Fig. 2), which is a sub-basin of the Niyang River Basin.
The Yarlung Zangbo River as one of the highest rivers in the world origins from Jiemayangzong Glacier in western Tibet and flows more than 2000 km in China before entering India, in which the name changes to Brahmaputra River. The Niyang River is one of the 5 biggest tributaries with 307.5 km long and 2.2×10¹⁰ m3 ∕ a volume of runoff. The Gujuecun basin is a rugged mountainous sub-basin with the elevation between 3667–6140 m.
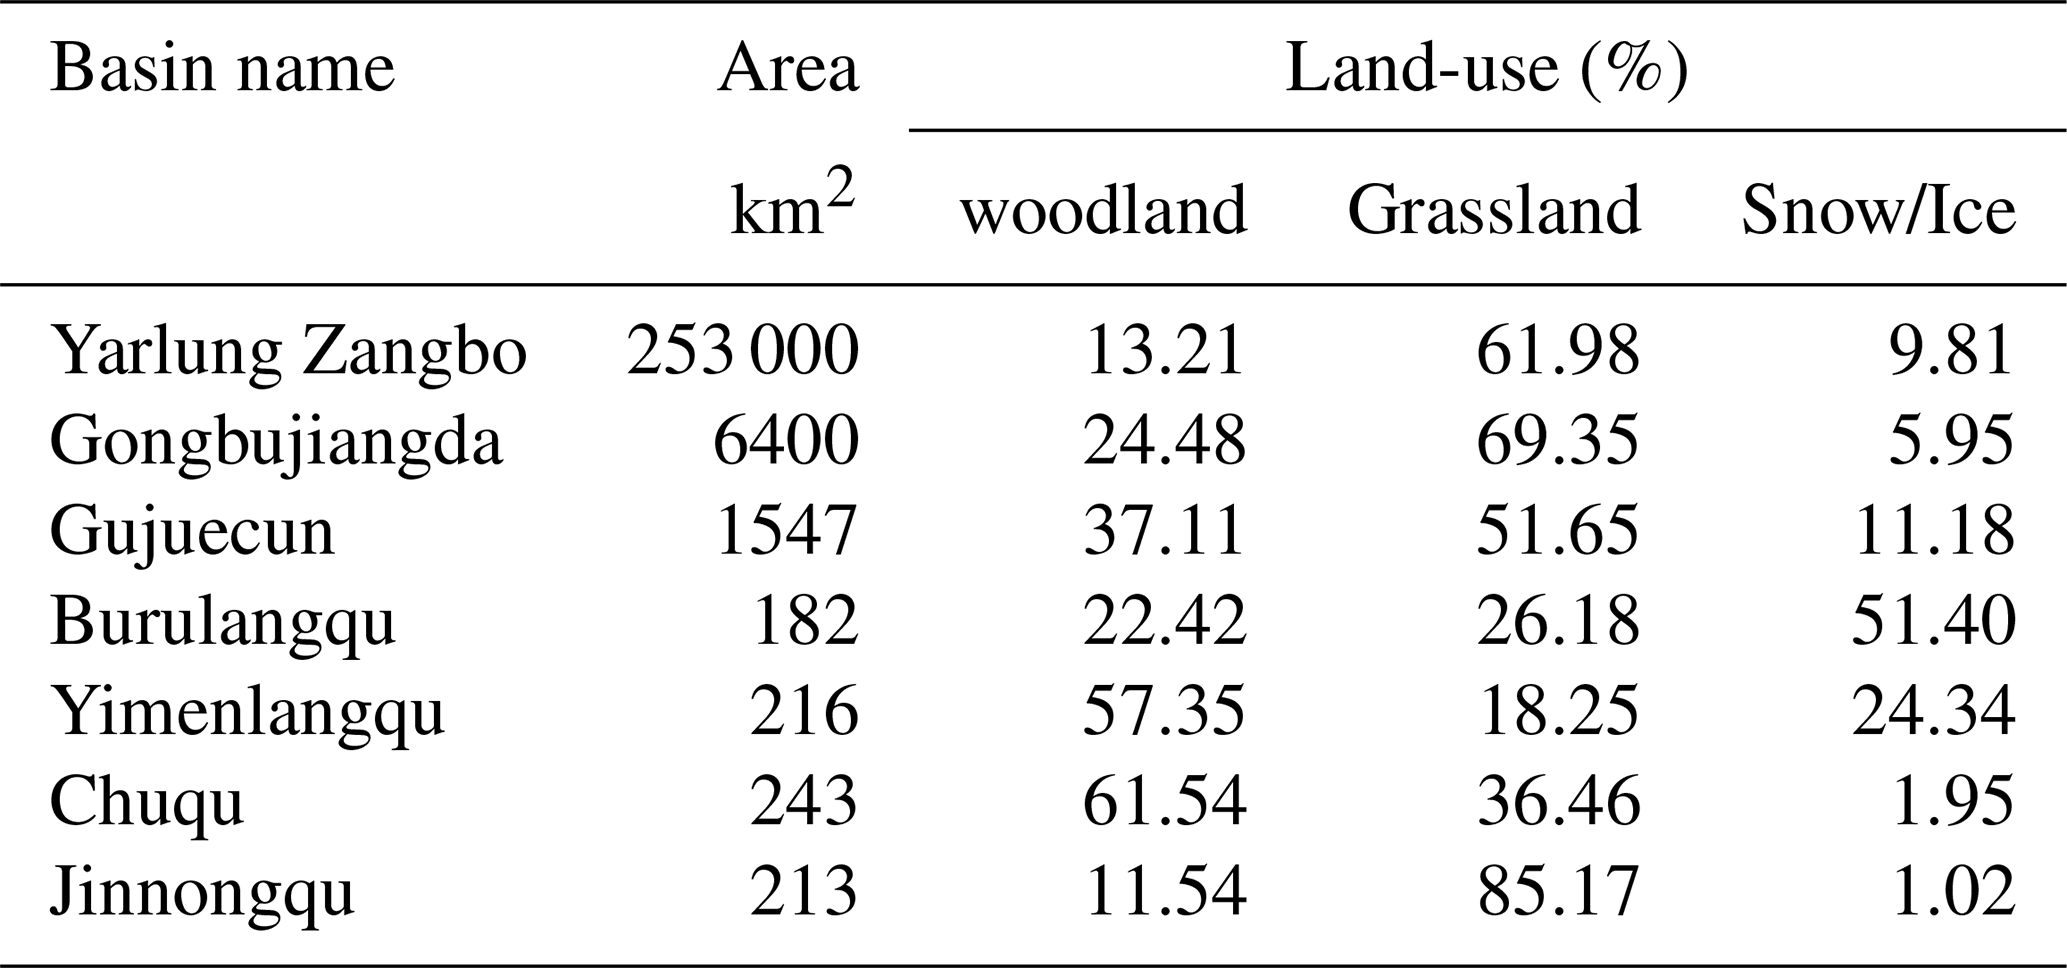
2.2 Land-use
Land-use types in the experimental area are mainly the forest, grassland, snow and ice (including temperate glacier), as shown in the Table 1 and Fig. 3.
Four sub-basins could be divided from the Gujuecun Basin, and named I-Burulangqu Creek, II-Yimenlangqu Creek, III-Chuqu Creek, and IV-Jinnongqu Creek. The Glacier spreads in the east part of the Gujuecun Basin, so that more focus is paid to Burulangqu Creek and Yimenlangqu Creek with more comprehensive land-use combinations.
2.3 Cross-sections Gauged
Gujuecun Basin is an ungauged basin because of the mountainous topography and lack of electricity and communication lines. In order to get the basic hydrological dataset, 5 monitoring gauges were built at 4 outlets of the sub-basins and the general outlet of Gujuecun Basin (Fig. 3).
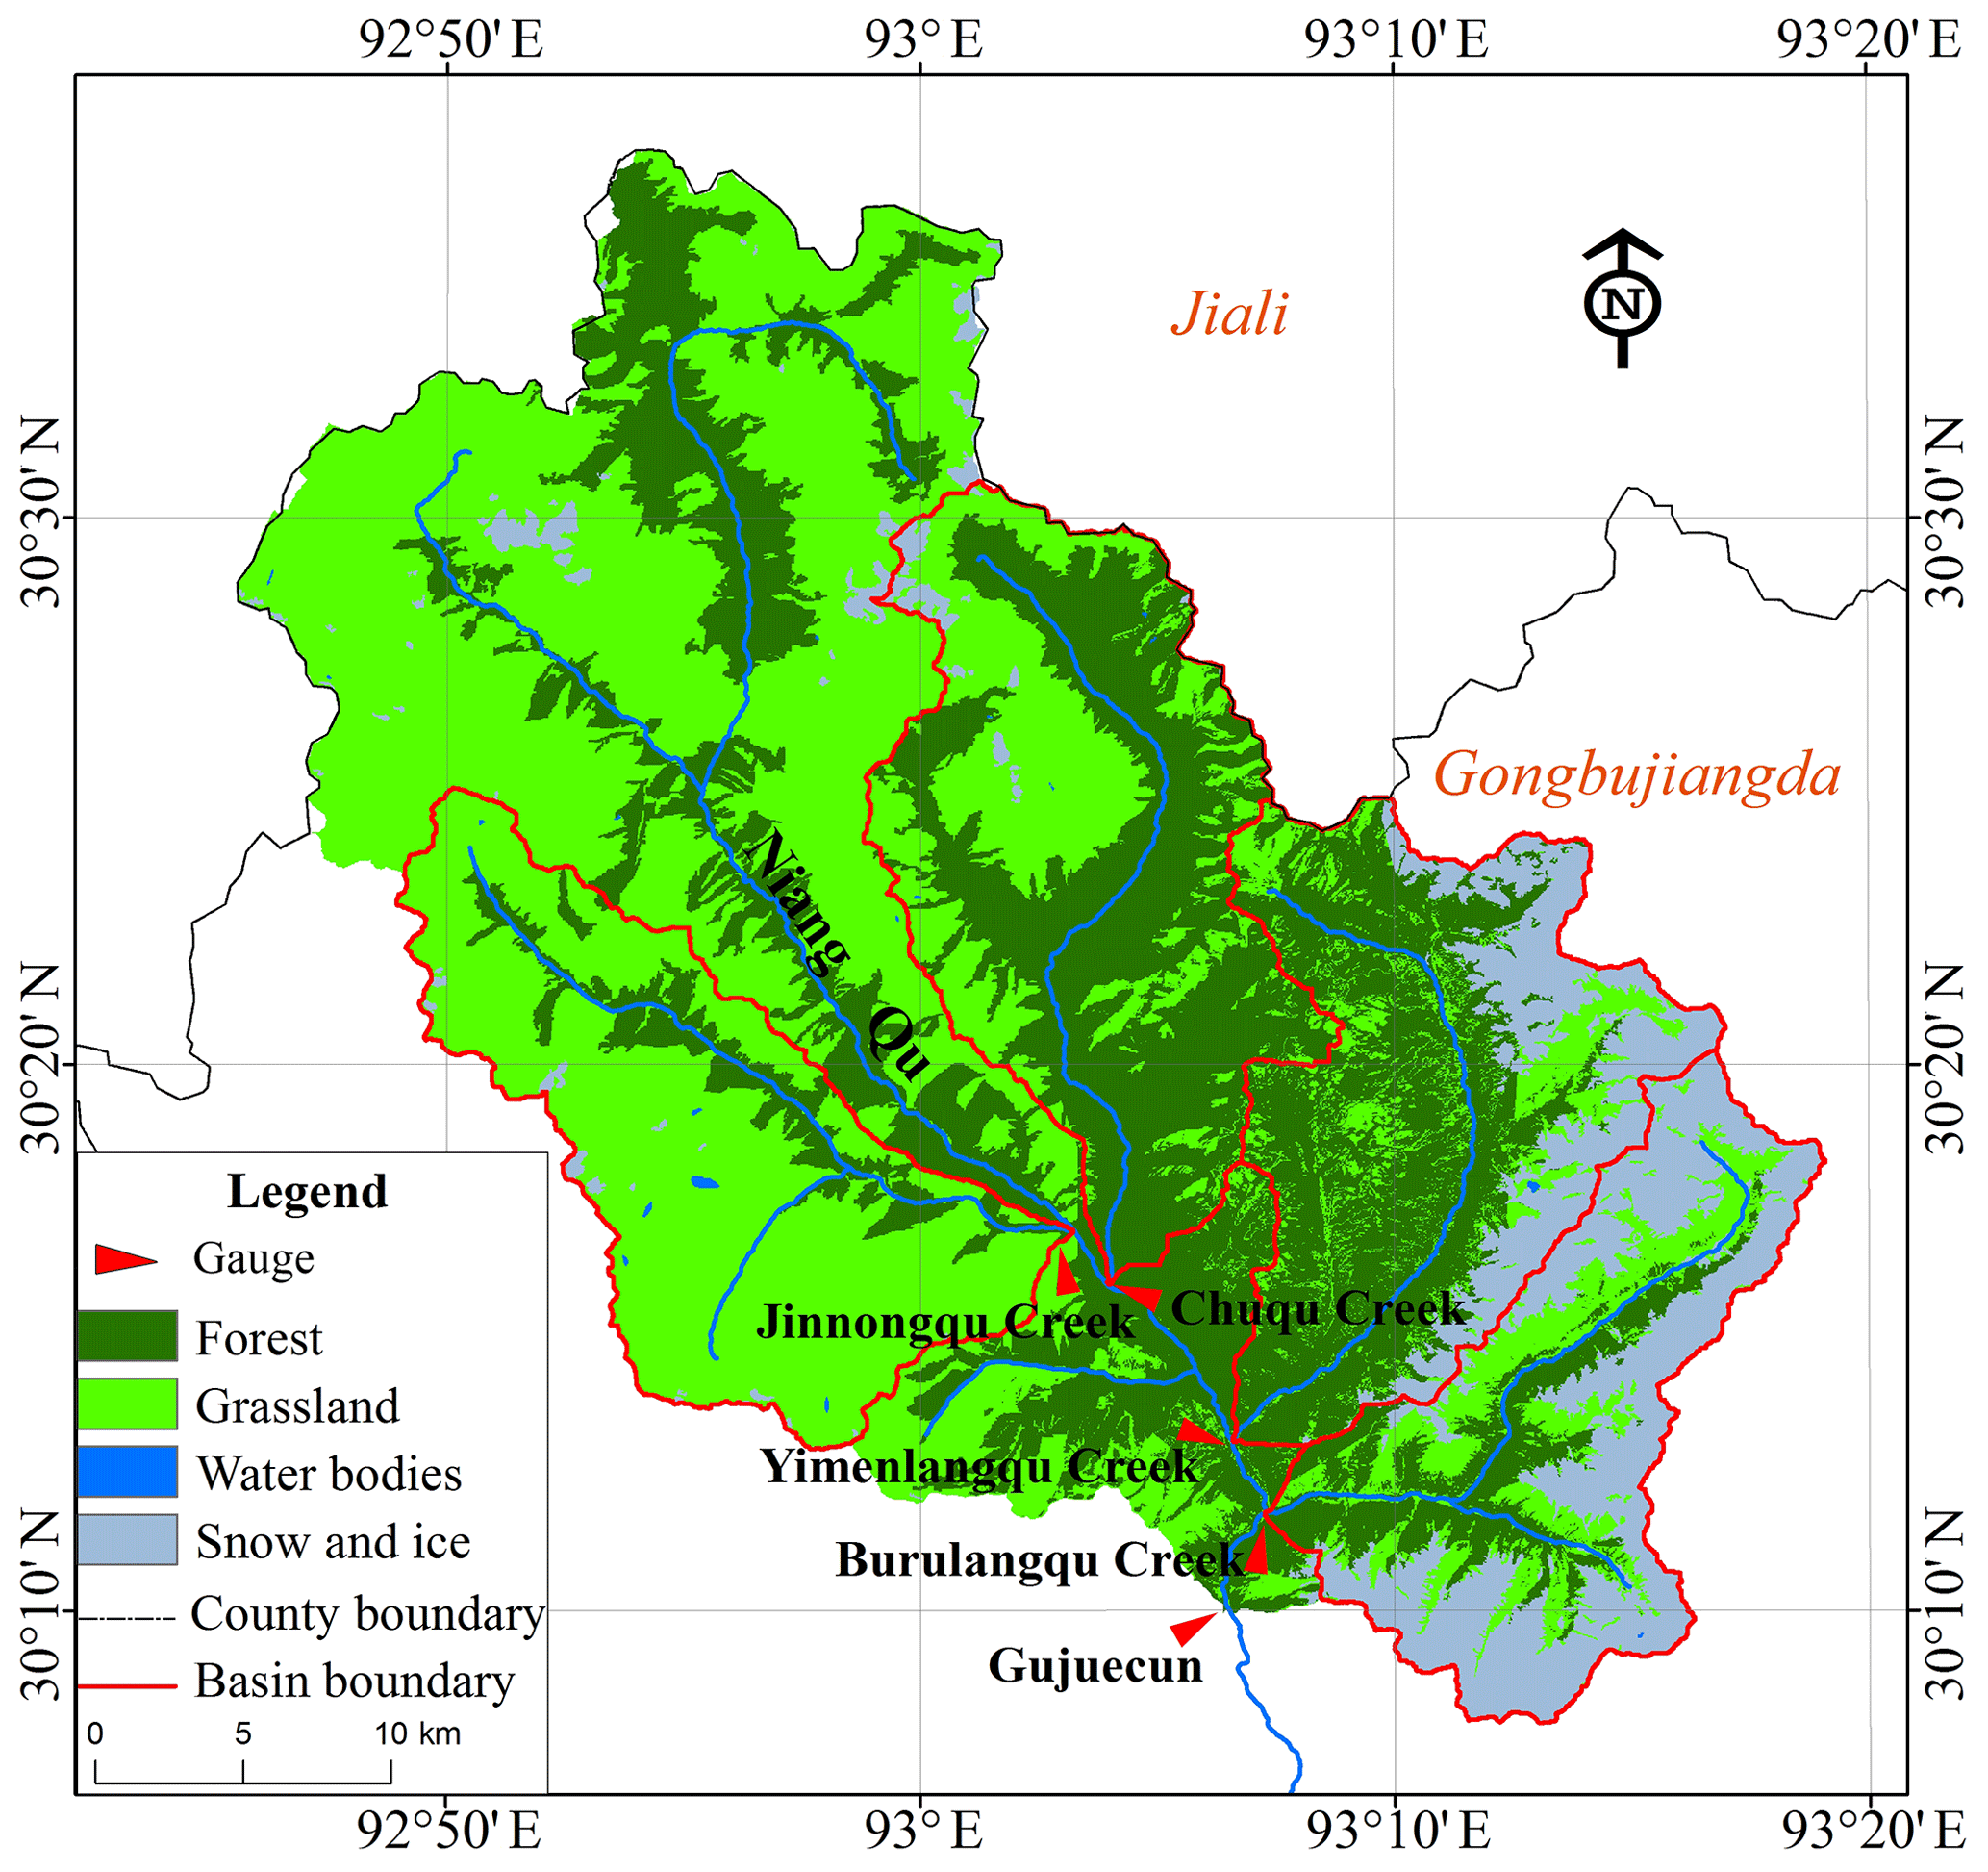
Figure 3Map of the land-use distribution of gauges in the outlets of the sub-basins.
Besides the hydrological data, the dataset needed for the runoff component analysis includes the geochemical and the stable isotopic data in the river water, soil water, and vegetation water. A possible effort to make runoff components clear in this ungauged basin is the End Member Analysis (EMMA) finally, but the first issue should be solved is the fundamental dataset.
The measures for achieving the dataset generally through three kinds of work, observing in site, gauging, sampling and analysis.
3.1 Observation in site
The necessary terrain information, gauging cross-section, and some chemical concentrations of the water were measured in site.
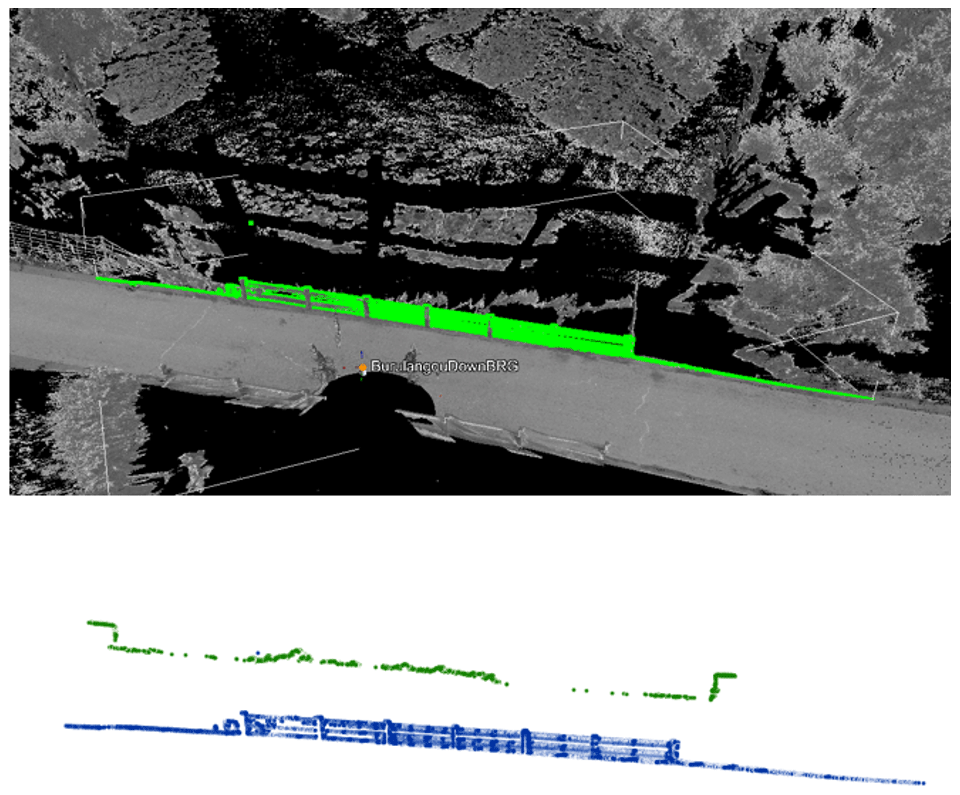
Although the overall topographic data could use the satellite DEM dataset, the detailed terrain data necessary around the 5 gauges must be surveyed in site. A 3-D laser scanner (Rigel VZ1000 type) was used to scan the ground surface, and the points cloud was record to establish the terrain model (Fig. 4). The underwater elevation was measured by the dip sticks. The gauging sites' cross-section were able to be drawn by combining the surface and underwater survey results. The pH, dissolved oxygen, water temperature, water conductivity, and measured with Hash HQ40d Portable Meter with sensors in every sampling site (will be introduce in Sect. 3.3).
3.2 Gauging
As shown in Figs. 3, 5 gauges was established in 2017 to launch the hydrometric monitoring. Radar water level meter was installed on a iron frame hanging over the river channel. Data was stored in a local memory and transmitted by Beidou satellite, and the satellite receiver was installed in an experimental field of Nanjing Hydraulic Research Institute, 2300 km away.
3.3 Field Trip and Sampling
More data necessary was not able to monitor by the 5 gauges, consequently, field trips and sampling were launched in the area. Focus on the comprehensive land-use area, sampling was concentrated in the Burulangqu Creek and Yimenlangqu Creek, which have glacier and snow. River water, sprint water, snow, glacier ice, soil, and vegetation samples were taken ever 5 m × 5 m grid, if the types of samples exist (Fig. 5). Three times sampling trips were arranged in one year, winter (before snowmelt), summer (wet season), autumn (before the snow accumulated).
3.4 Sample Analyzing
The water samples were examined by the LGR isotopic water analyser, DIONEX ICS-2100 ion chromatographic system, and PE ICP-OES Optima 7000DV, with which δ18O, δ2H, K+, Na+, Ca2+, Mg2+, Sr, Si, F−, Cl−, , , etc. were analysed.
The soil and vegetation samples were treated with the cryogenic vacuum distillation system, with which the water could be extracted, and δ18O, δ2H were analysed.
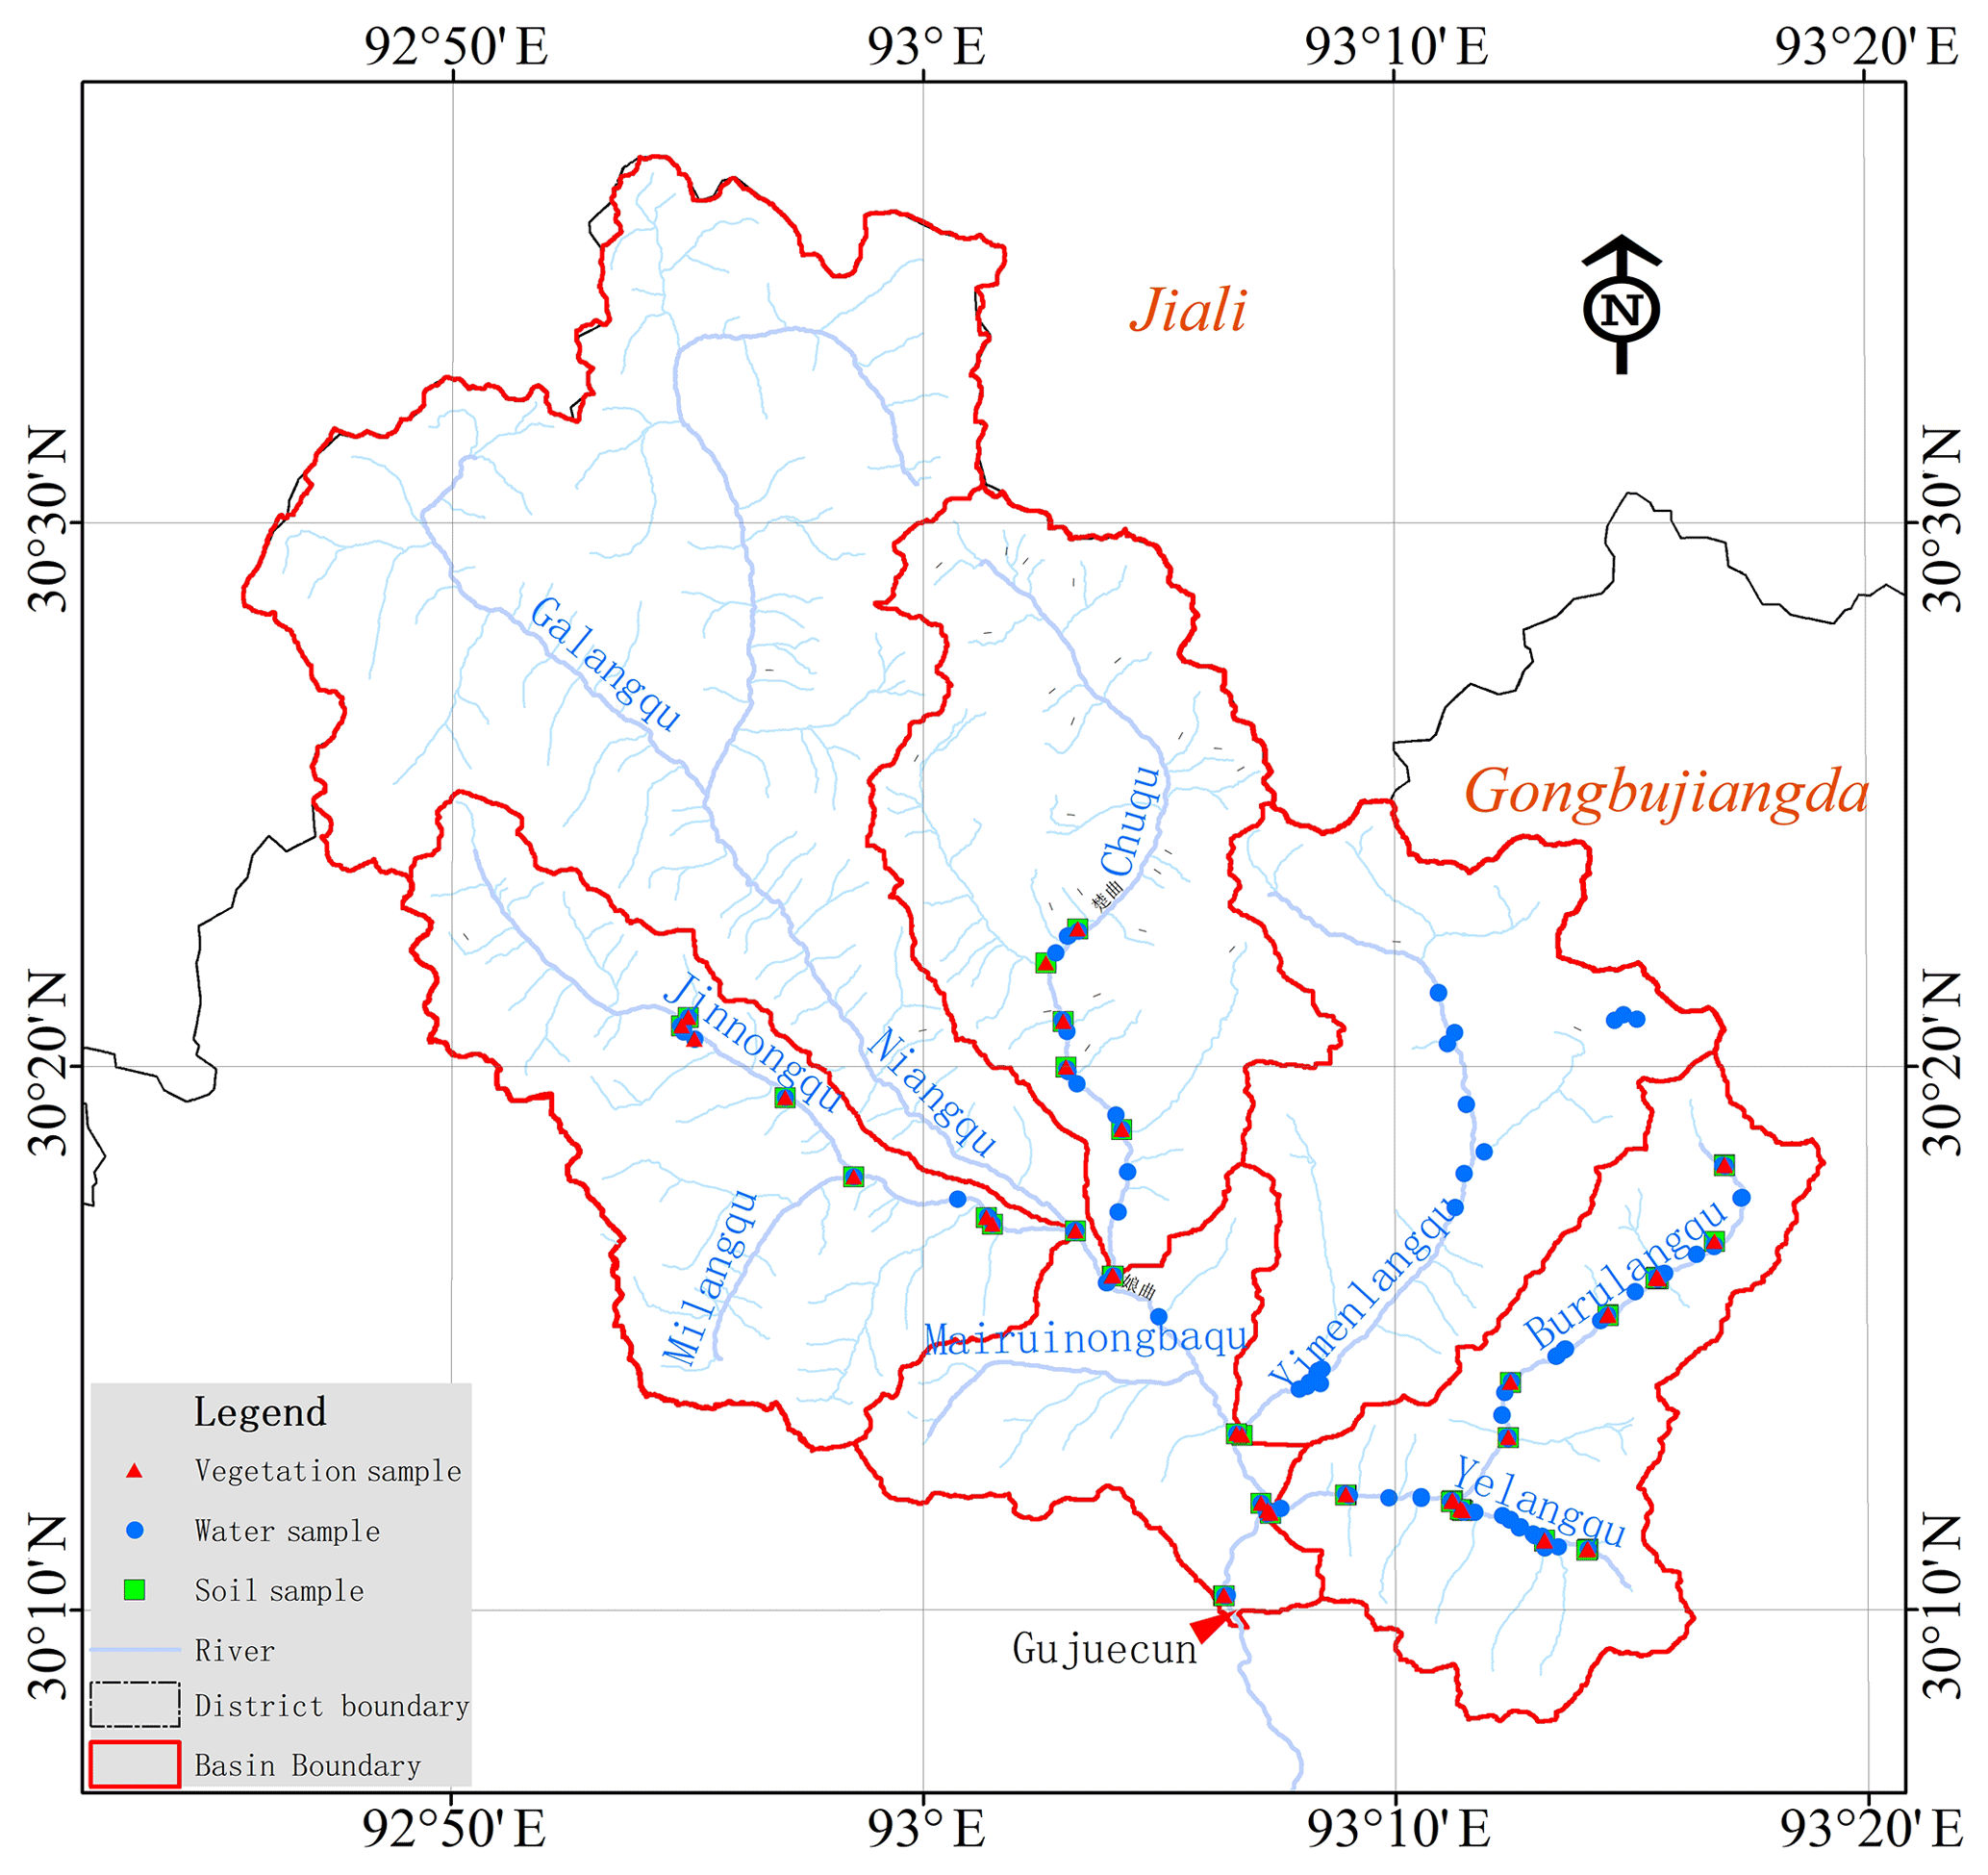
Figure 5Sampling points in the field trip.
4.1 Precipitation and river water isotopes
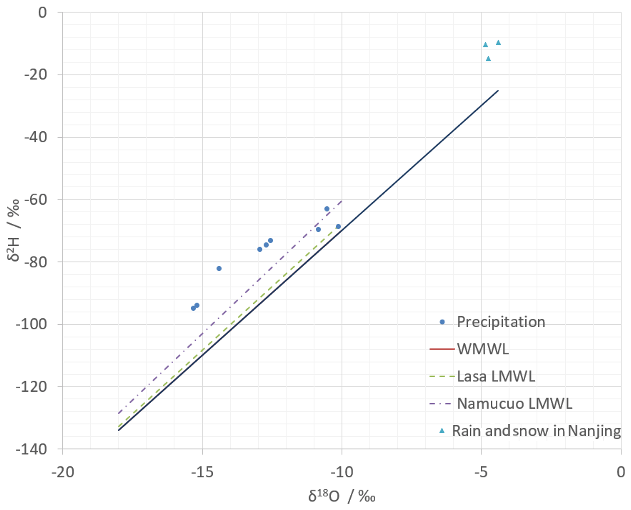
The steady isotopes show regularities in the stable isotopic composition of the precipitation water and surface water along the river according to the elevation change in the Gujuecun Basin obviously, that the higher elevation samples show lower δ2H and δ18O content, and the δ2H vs δ18O scatter plots spread around a line generally. Three Nanjing rainfall and snow samples isotopic values were included to extend the comparation. According to the rainfall and the snow isotope result in Fig. 6, most of the data point spread over the World Meteoric Water Line (WMWL, or GMWL), the Lasa Local Meteoric Waterline (LMWL), and the Namucuo LMWL, while 3 points falls quite near the 3 lines. It shows that the different sources of the atmospheric water which formed the snow and rain, some precipitation comes from the similar sources to the Namucuo Lake and Lasa City, but there're also some different sources. Combine the surface water isotopes, it seems most of the runoff trends to fit the Lasa and Namucuo LMWLs, so that more observation needed before a sound Gujuecun LMWL could be drawn. But we still could speculate that the Gujuecun LMWL should be a little bit higher than the other 3 lines.
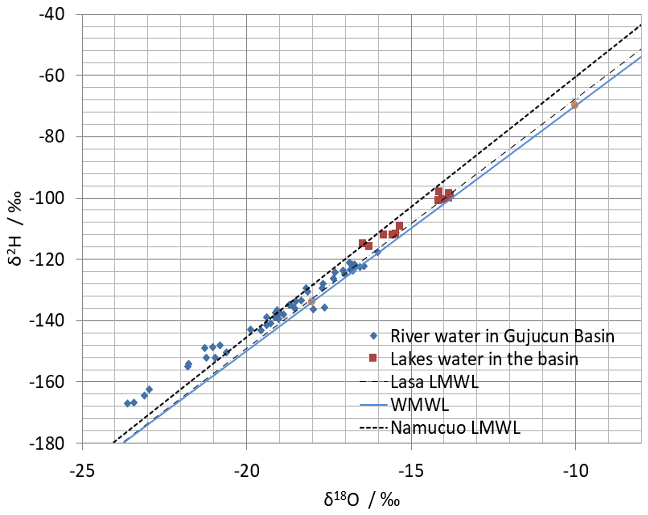
The δ2H and δ18O isotope values of the local river water in Fig. 7 are not meet the Lasa LMWL very well nor the Namucuo LMWL generally. In the mid and -value area, the points spread between the two LMWLs, while in the negative-value area dataset deviated higher from the lines.
The points in the relative higher value area in Fig. 7 trends closer to the Lasa LMWL, which generally lower than the Namucuo line and higher than the global precipitation line WMWL. With the decreasing of the δ2H and δ18O isotope values, the points spread higher and higher gradually, reaching the Namucuo LMWL and across then. The samples with poorer value points in the left side of the graph are all from the higher altitude area, which could accord with the precipitation attributes better shown in Fig. 6. Considering the complexity of the surface water sources, the river and lake may contain runoff from rain, snow, glacier, underground runoff, or other sources formed at different time, which may undergo different degrees of fractionation. Because of sampling happen only in some particular months rather than the monthly series, the mixed surface water is regarded as better representative of the local isotope attribute, which imply that the vapor sources of the precipitation in Gujuecun basin are similar to Lasa and Namucuo, but different sources or source combinations may also exist. More observations and sampling are needed to make it clear.
4.2 Spatial variation of the geochemical indicators
The geochemical elements could also help to identify the sources of the runoff. According to the Fig. 8, K, Ca, Na, Mg, F, Sr elements shows different spatial distribution characteristics. The K, Ca, Mg elements shows a significant source of the Yelangqu Creek, which is a branch of the Burulangqu Creek. The Na and Sr elements
contribute more by the Chuqu Creek and Yelangqu Creek. The F spread similar in different branches. High value points could be found in Yimenlangqu downstream and the Burulangqu downstream, that may relate to the grazing points. With the concentration of different geochemical elements at Gujuecun Gauge, distribution of the elements could help us to estimate the general sources of the mixed river water. An EMMA method is possible to be launched with the isotopes and geochemical elements, and the runoff composition could be analylized quantitively in the coming further research.
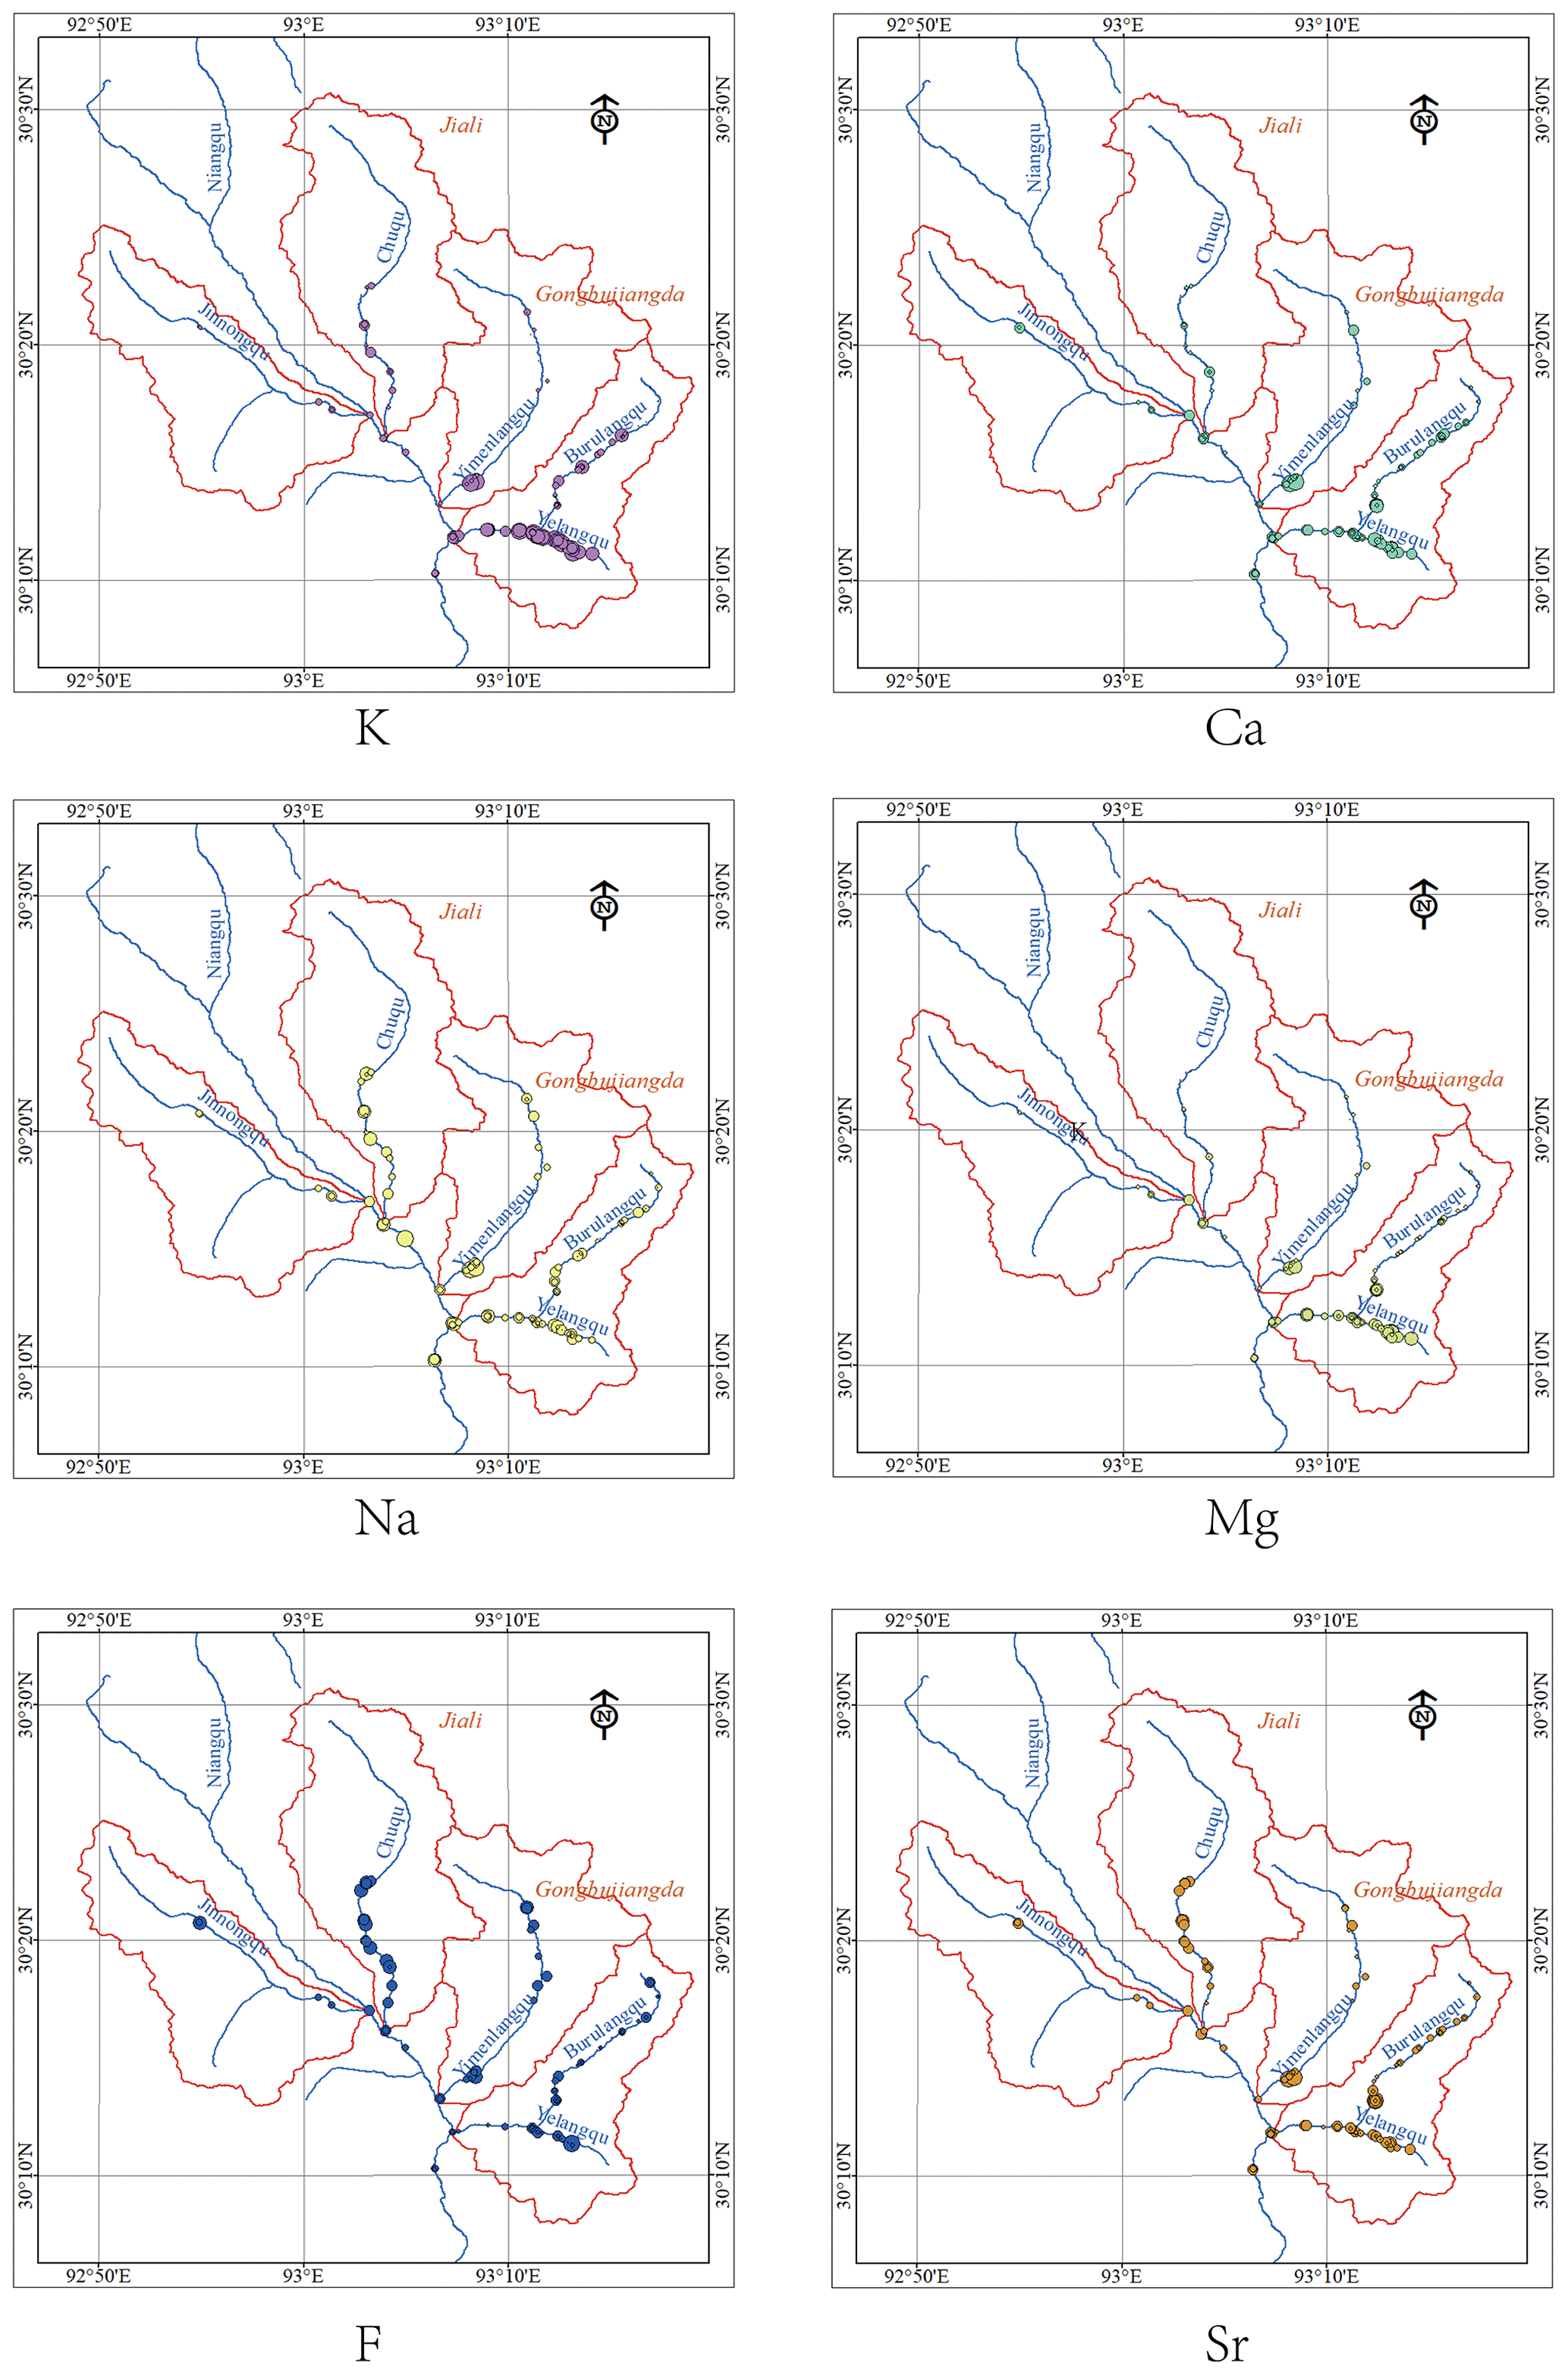
Figure 8Geochemical elements distribution map.
4.3 Isotopes and Ions in the Soil and Vegetation
The Fig. 9 is for the trees' stems isotope characteristics. The stems' values trend to spread under the WMWL and the LMWL, which shows that the water in the stems must be mainly from the precipitation event most recently. The trees seem take use of not only the local water in the soil around the root, but also the fractured water formed by the multiple precipitation events or supplied by the higher place. Certainly, there may also be some of the soil pore water used. According to the points which are closer to the LMWL may use more water from the river.
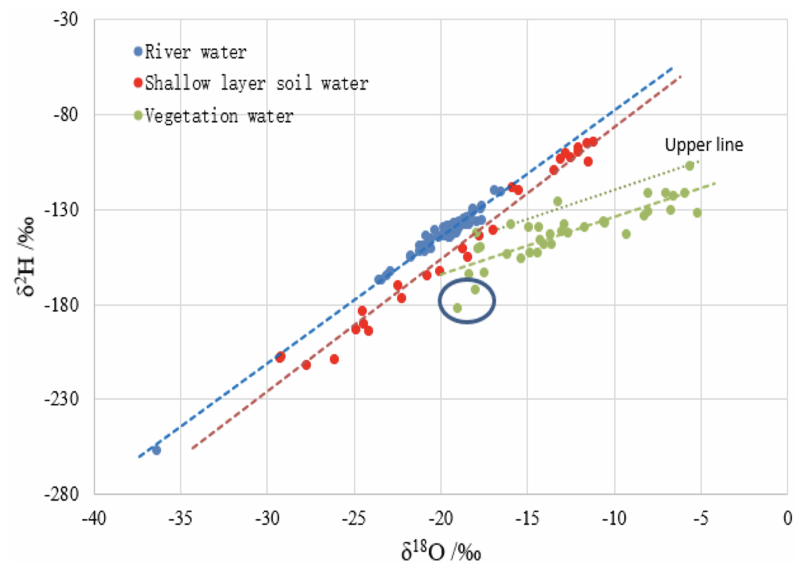
The vegetation water isotopes spread scattered. It may be caused by different reasons, but the water source should be an essential factor. Most of the vegetation seems comes from the similar water source according to the Fig. 9, for the points trend spread along a line significantly. But the points near the upper line (the trendline of the top 6 vegetation water) and in the lower circle should not from the same source. The vegetation may utilize not only the soil water supplied by the surface runoff, but also the deeper water sources with different isotopic characteristics. It could be speculated that the water in the stems were mainly from the precipitation event most recently. The trees seem take use of not only the local water in the soil around the root, but also the fractured water formed by the multiple precipitation events or supplied by the higher place.
This study was aimed at finding a series of feasible methods on the hydrometric monitoring and runoff composition analysis in the alpine environment. According to the high mountainous and low air pressure environment, automatically experimental gauges were established. Although the automatically instrument could monitor the water level data, but lack of public transition signal and the low guarantee degree of Beidou satellite channel, the received data are not quite complete. The equipment is still adjusting and improving.
Survey and sampling are still necessary for the study of the hydrological scheme of the alpine basin lack of observation data. Hydrogen and oxygen isotopes and geochemical elements were examined in the interest basin. Results show that δ2H and δ18O stable isotopes of the precipitation, river water, lake water was analyzed, and there are obvious regularities according to the elevation change. The steady isotopes show regularities in the stable isotopic composition of the precipitation water and surface water along the river according to the elevation. The river water δ2H and δ18O generally meet the local meteoric water line nearby, which shows the main source of the runoff is the precipitation and snow. Different geochemical elements indicate the different spatial sources of the runoff water, which could further analyzed with the end member algorithm methods later.
Vegetation water in the stems must be mainly from the river water and precipitation event most recently. Although the trees seem mainly take use of the similar water sources, but a few observation data also show different sources existence, such as fractured water formed by the multiple precipitation events or supplied by the higher place.
More observation and analysis will be done in the coming 3–4 years to collect more data, which should help to understand the hydrological and the ecohydrological processes characteristics better in the plateau area. More quantitative analysis and modeling method will be used when the dataset can support it.
Topographic, geochemical and isotopic data are measured by authors' research group, which would be collected, summarized and published by the NSFC KEY RESEARCH PLAN Runoff Change and its Adaptive Management In the Major Rivers in Southwestern China.
HL and JL contribute to the concept of the study; HL generally organized the measuring, sampling, and analyzing; WW supported the GIS analysis and survey; XM contributed to the sampling and survey; HZ, XD, and NW contributed to the samples' geochemichal and isotopical analysis.
The authors declare that they have no conflict of interest.
This article is part of the special issue “Hydrological processes and water security in a changing world”. It is a result of the 8th Global FRIEND-Water Conference: Hydrological Processes and Water Security in a Changing World, Beijing, China, 6–9 November 2018.
This study is funded by NSFC projects, (1) the Experiment Study on Runoff Components Analysis in Niyang River Watershed Based on the Geochemical Indicative Tracing Factors (No. 91647111) and (2) Multi-scale monitoring of hydrological processes in the Yarlung Zangbo River Basin (No. 91647203), which are included in the Major Research Plan – National Natural Science Foundation of China.
This research has been supported by the National Natural Science Foundation of China (grant nos. 91647111 and 91647203).
Blöschl, G., Sivapalan, M., Wagener, T., Viglione, A., Venije, H. S., and Processes, S.: Runoff Prediction in Ungauged Basins, ISBN 9781139235761, https://doi.org/10.1017/CBO9781139235761, 2013.
Briggs, P. R. and Cogley, J. G.: Topographic Bias in Mesoscale Precipitation Networks, J. Climate, 9, 205–218, 1996.
Deems, J. S., Painter, T. H., and Finnegan, D. C.: Lidar measurement of snow depth: A review, J. Glaciol., 59, 467–479, https://doi.org/10.3189/2013JoG12J154, 2013.
Immerzeel, W. W., Van Beek, L. P. H., and Bierkens, M. F. P.: Climate change will affect the asian water towers, Science, 328, 1382–1385, https://doi.org/10.1126/science.1183188, 2010.
Liu, C., Bai, P., Wang, Z., Liu, S., and Liu, X.: Study on prediction of ungaged basins: A case study on the Tibetan Plateau, Shuili Xuebao/Journal Hydraul. Eng., 47, 272–282, https://doi.org/10.13243/j.cnki.slxb.20150925, 2016.
Liu, S., Liu, C., and Zhao, W.: Towards the Methodology for Predictions in Ungauged Basins, available at: http://www.progressingeography.com/EN/10.11820/dlkxjz.2010.11.014, Prog. Geogr., 29, 1333–1339, 2010.
Liu, Y.: Review on Development of ADCP Technology and Its Application, Hydrogr. Surv. Charting, 36, 45–49, https://doi.org/10.3969/j.issn.1671-3044.2016.02.011, 2016.
Long, D., Longuevergne, L., and Scanlon, B. R.: Global analysis of approaches for deriving total water storage changes from GRACE satellites, Water Resour. Res., 51, 2574–2594, https://doi.org/10.1002/2014WR016853, 2015.
Meyer, M. L. and Huey, G. M.: Telemetric system for hydrology and water quality monitoring in watersheds of northern New Mexico, USA, Environ. Monit. Assess., 116, 9–19, https://doi.org/10.1007/s10661-006-7242-0, 2006.
Montanari1, A., Bahr, J., Bloschl, G., Cai, X., Mackay, D. S., Michalak, A. M., Rajaram, H., and Sander, G.: Fifty years of Water Resources Research:Legacy and perspectives for the science of hydrology, Water Resour. Res., 51, 6797–6803, https://doi.org/10.1002/2015WR017998, 2015.
Nolan, M., Larsen, C., and Sturm, M.: Mapping snow depth from manned aircraft on landscape scales at centimeter resolution using structure-from-motion photogrammetry, The Cryosphere, 9, 1445–1463, https://doi.org/10.5194/tc-9-1445-2015, 2015.
Piao, S., Ciais, P., Huang, Y., Shen, Z., Peng, S., Li, J., Zhou, L., Liu, H., Ma, Y., Ding, Y., Friedlingstein, P., Liu, C., Tan, K., Yu, Y., Zhang, T., and Fang, J.: The impacts of climate change on water resources and agriculture in China, Nature, 467, 43–51, https://doi.org/10.1038/nature09364, 2010.
Roub, R., Hejduk, T., and Novák, P.: Automating the creation of channel cross section data from aerial laser scanning and hydrological surveying for modeling flood events, J. Hydrol. Hydromechanics, 60, 227–241, https://doi.org/10.2478/v10098-012-0020-5, 2012.
Shu, D.: On Modernization of Hydrological Information System, Hohai University, (phD thesis), 2005.
Sivapalan, M., Takeuchi, K., Franks, S. W., Gupta, V. K., Karambiri, H., Lakshmi, V., Liang, X., McDonnell, J. J., Mendiondo, E. M., O'Connell, P. E., Oki, T., Pomeroy, J. W., Schertzer, D., Uhlenbrook, S., and Zehe, E.: IAHS Decade on Predictions in Ungauged Basins (PUB), 2003–2012: Shaping an exciting future for the hydrological sciences, Hydrol. Sci. J., 48, 857–880, https://doi.org/10.1623/hysj.48.6.857.51421, 2003.
Viviroli, D., Dürr, H. H., Messerli, B., Meybeck, M., and Weingartner, R.: Mountains of the world, water towers for humanity: Typology, mapping, and global significance, Water Resour. Res., 43, W07447, https://doi.org/10.1029/2006WR005653, 2007.
Wandishin, M. S., Baldwin, M. E., Mullen, S. L., and Cortinas, J. V: Short-Range Ensemble Forecasts of Precipitation Type, Society, 20, 609–626, https://doi.org/10.1175/WAF871.1, 2005.
Wu, C. and Kong, F.: Scheme Research on IoT Hydrological Measuring and Reporting System Based on Unmanned Ship, Sh. Electron. Eng., 37, 136–139, https://doi.org/10.3969/j.issn.1672-97302017.08.032, 2017.
Yao, T., Liu, X., Wang, N., and Shi, Y.: Amplitude of climatic changes in Qinghai-Tibetan Plateau, Sci. Bull., 45, 1236–1243, 2000.
Yin, Z., Feng, Q., Liu, S., and Zou, S.: The application progress of hydrological model in quantifying the contribution of glacier runoff to total watershed runoff, available at: http://www.bcdt.ac.cn/CN/10.7522/j.isnn.1000-0240.2016.0028, J. Glaciol. Geocryol., 38, 248–258, 2016
Yuan, D., Li, D., Zhang, L., Tian, Z., and Zhang, F.: Study and Development on Hydrometric Cableway of Automation Observation and Control System, Yellow River, 26, 11–12, 2004.