the Creative Commons Attribution 4.0 License.
the Creative Commons Attribution 4.0 License.
 | 16 Sep 2020
Study of the spatial and temporal variability of rainfall in the Middle and Lower Cheliff (Algeria)
Ali Hadour
Gil Mahé
Mohamed Meddi
The purpose of this study is to identify homogeneous rainfall regions and to study the spatial and temporal variability of rainfall in the Cheliff basin using the regional vector method and the statistical approach (Pettitt test, Lee Heghinian test and Hubert segmentation) and the geostatistic approach (inverse distance weighting method). In terms of results, the regional vector method highlighted six (6) homogeneous rainfall regions. The downward trend occurred in the study area in 1972, affecting a few coastal stations. In 1976, this decline extended to the South West and throughout the coastal region. In 1980, the drop covered the entire basin. This decline has resulted in an estimated deficit of 30 % on average in the eastern region, the coastal region and the Mina. However, the central part of the basin experienced a 20 % decrease compared to the period before the break (1968–1980). The same spatial irregularity in rainfall was observed during the pre-break and post-break periods (1981–2010). On the other hand, throughout the basin, the areas corresponding to the rainfall ranges identified during the 1968–1980 period experienced an average decrease of 100 mm during the post-break period, except in the eastern region, where the decrease exceeded 200 mm.
- Article
(5151 KB) - Full-text XML
- BibTeX
- EndNote


Water demand has never been so high. This is due to the population growth, the expansion of irrigated areas or the increasing needs of industry (WWAP, 2018). In the Mediterranean area, liquid precipitation is the main source of water for rivers and underground reservoirs. In addition, rainfall is the third stage of the water cycle; a cycle influenced by different natural meteorological fluctuations, and its intensification and acceleration is expected because of global warming (IPCC, 2007, 2014).
Located on the Southern shore of the Mediterranean Sea, Algeria is characterized by a contrasting and diversified climate; its evolution shows an alternation between wet and dry periods. Besides, the great variability of the 1970s allowed the extension of semi-arid zones and the restriction of wetlands.
In such a context, the study of the spatial and temporal evolution of climate parameters, including rainfall, is essential to understand this variability, to quantify it and map it, as well as to improve management approaches, to put in place adaptation plans and to develop new orientations if necessary.
This study examined the spatial and temporal variability of rainfall in the Cheliff basin. In this regard, the regional vector method on monthly rainfall data was used for two purposes: to criticize and synthesize rainfall information; and to build and validate homogeneous rainfall regions. In addition, the statistical approach was used to study the temporal variability of rainfall. For this purpose, three tests integrated into the Khronostat software were selected (Pettitt test, Lee Heghinian test and Hubert segmentation). Subsequently, the spatialization of rainfall was done by the inverse distance weighting method over two different periods: the pre-break period and the post-break period.
2.1 Presentation of the study area
The Cheliff basin is the largest watershed in Algeria. Its surface area is about 44 900 km2. It includes three different regions: the Boughezoul upstream; the High and Middle Cheliff; the Lower Cheliff and the Mina. It extends between 0 and 3∘30′ E and 34 and 36∘ N. It is surrounded to the North by the Dahra Mountains and to the South by the Saharan Atlas, to the West by the Oranese basin and to the East by Algerian basin. The region experiences a semi-arid Mediterranean climate. The rainy season extends from November to March, and the rest of the year is characterized by dry and sunny periods.
2.2 Origin of the data
The monthly rainfall data come from the National Hydraulic Resources Agency (ANRH). The spatial distribution of the 50 stations included in this study is heterogonous. Indeed, there is a high concentration of measurement sites on the plains and a significant insufficiency qualifies the relief areas. The measure covers the period from the hydrologic year 1968 to the hydrologic year 2010; a hydrologic year starts on 1 September and ends on 31 August. 24 stations present complete series. On the other hand, the remaining 26 contain deficiencies; the number and the date differ from one station to another.
2.3 The regional vector method
The regional vector method was developed by Hiez (1977) at ORSTOM/IRD (Institute of Research for Development). It is based on the pseudo-proportionality hypothesis.
As a result, the method gives a regional vector corresponding to a time series of monthly rainfall indices, coming from the extraction of the information most probably contained in a set of observation sites previously grouped by homogeneous region. The most probable information is extracted using the principle of pseudo-proportionality of total rainfall between stations and the principle of likelihood. This method has been applied by several authors in West Africa and Mediterranean area (Mahé and Olivry, 1995; Bodian, 2014; Kotti et al., 2016; Hallouz et al., 2013).
This technique is used in this study to validate the previously delineated homogeneous regions based on the results of inter-station correlation studies, and to review and synthesize information of each homogeneous region. The corrections proposed by the method are intended to minimize the error matrix; they are not taken into account since a good analysis of extremes in the study area is not available.
The study area was divided into 6 homogeneous regions on which the regional vector method was applied to the monthly time step, using IRD's Hydraccess software (Vauchel, 2005).
2.4 Detection of breaks in time series
Statistical analysis was chosen to study and identify rainfall variability in our study area. For this purpose, a classical statistical test, a Bayesian method and a segmentation technique were selected. Our choice was based on the ease of implementation; they work even when the position of the jumps is unknown and require fewer application conditions.
The classical statistical test is a non-parametric approach to identify a change in mean or variance in a data series. It is developed by Pettitt (1979); it does not require any particular conditions, except continuity.
Lee and Heghinian's test (Lee and Heghinian, 1977) based on the univariate Bayesian method is adapted to identify a change in mean in the data series. It imposes normality, non-autocorrelation and constancy of variance of the time series studied.
The segmentation technique chosen is based on optimal segmentation in the least-squares sense and uses the simple step-by-step technique as combinatory. It is developed and presented by Hubert and Carbonnel (1987). It is used to search several jumps in the average. It requires the normality of the studied distribution.
The implementation of these three tests on all observed rainfall time series is performed by the Khronostat software (Boyer, 1998).
2.5 Spatialization of rainfall data
The objective is to determine and map the spatial distribution of rainfall in our study area before and after the break period. The geostatic method chosen is a deterministic approach, called inverse distance weighting (Davis, 1986; Franke, 1982). This method assigns a weight inversely proportional to the distance between the site and the point to be estimated.
Unlike stochastic methods (kriging) that require a large number of application assumptions and allow the consideration of the spatial structure of the data and their positions, the deterministic approach does not assume any hypothesis on the data and only takes into account the positioning of the stations in relation to each other.
3.1 Data review and validation of homogeneous regions
Homogenization consists in grouping rainfall stations that have a similar behavior, based on a proportionality test integrated into the regional vector method (Mahé and L'Hôte, 1992). The close behavior of the rainfall series is validated if and only if the proportionality coefficient for each station is below 0.20. Above this value, the risk that the evolution of the station will differ from that of the other stations in the group increases (Kotti et al., 2016). The results of the regression approach are used as the first filter for selecting homogeneous regions. In addition, the regional vector method validated six homogeneous regions with a proportionality coefficient below the threshold (0.20) in each homogeneous group.
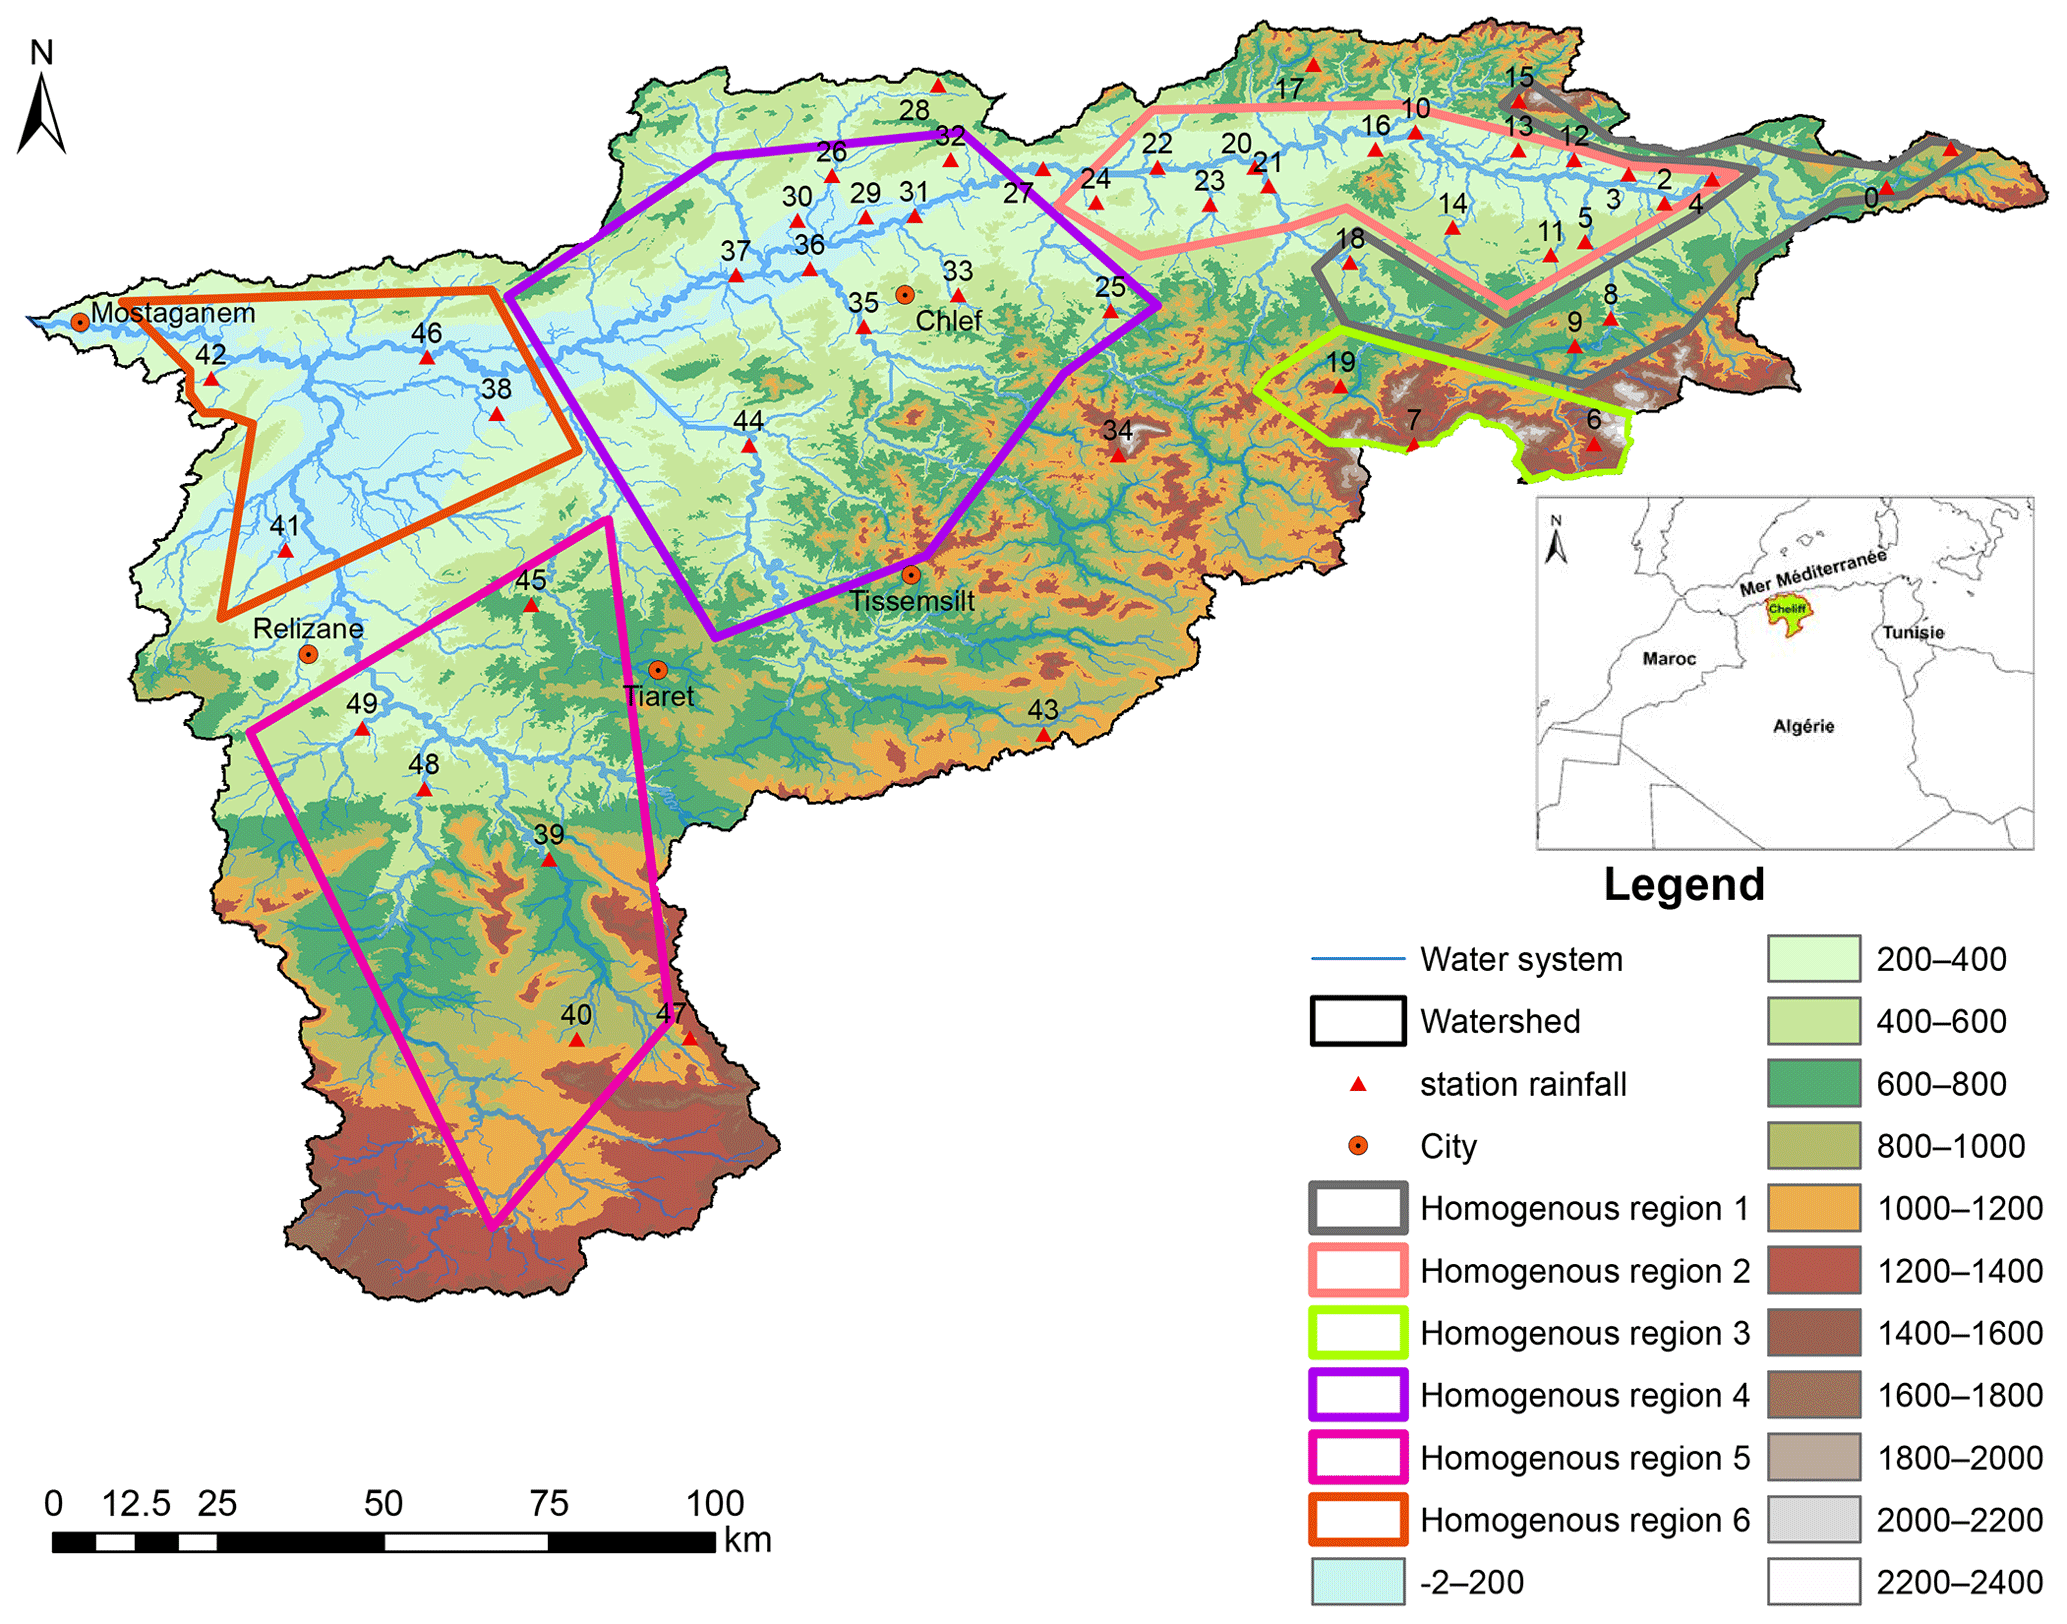
Figure 1Study area and delineation of homogeneous regions.
Stations showing close rainfall variability are grouped together in the same region. The spatial distribution of the regions is oriented along two axes: (1) from West to East, (2) from North West to South West. The first region includes 6 stations located on the Atlas, a mountainous range with a relief varying from 800 to 1400 m. The second region is based in the Northern valleys of the Atlas Mountains and reaches some plains in the Eastern part of the basin; it concerns 15 stations. The fourth region is locate on the plains in the middle of the basin and consists of 11 stations. The sixth region is concentrated in the coastal zone and contains 4 stations. The third region gathers 3 stations located on the South Eastern mountainous area of the Atlas with altitudes exceeding 1400 m. 5 stations exhibit an isolated behavior. In other words, they do not represent any similarity with the validated regions; they are situated on the periphery of the basin, in high relief areas Fig. 1.
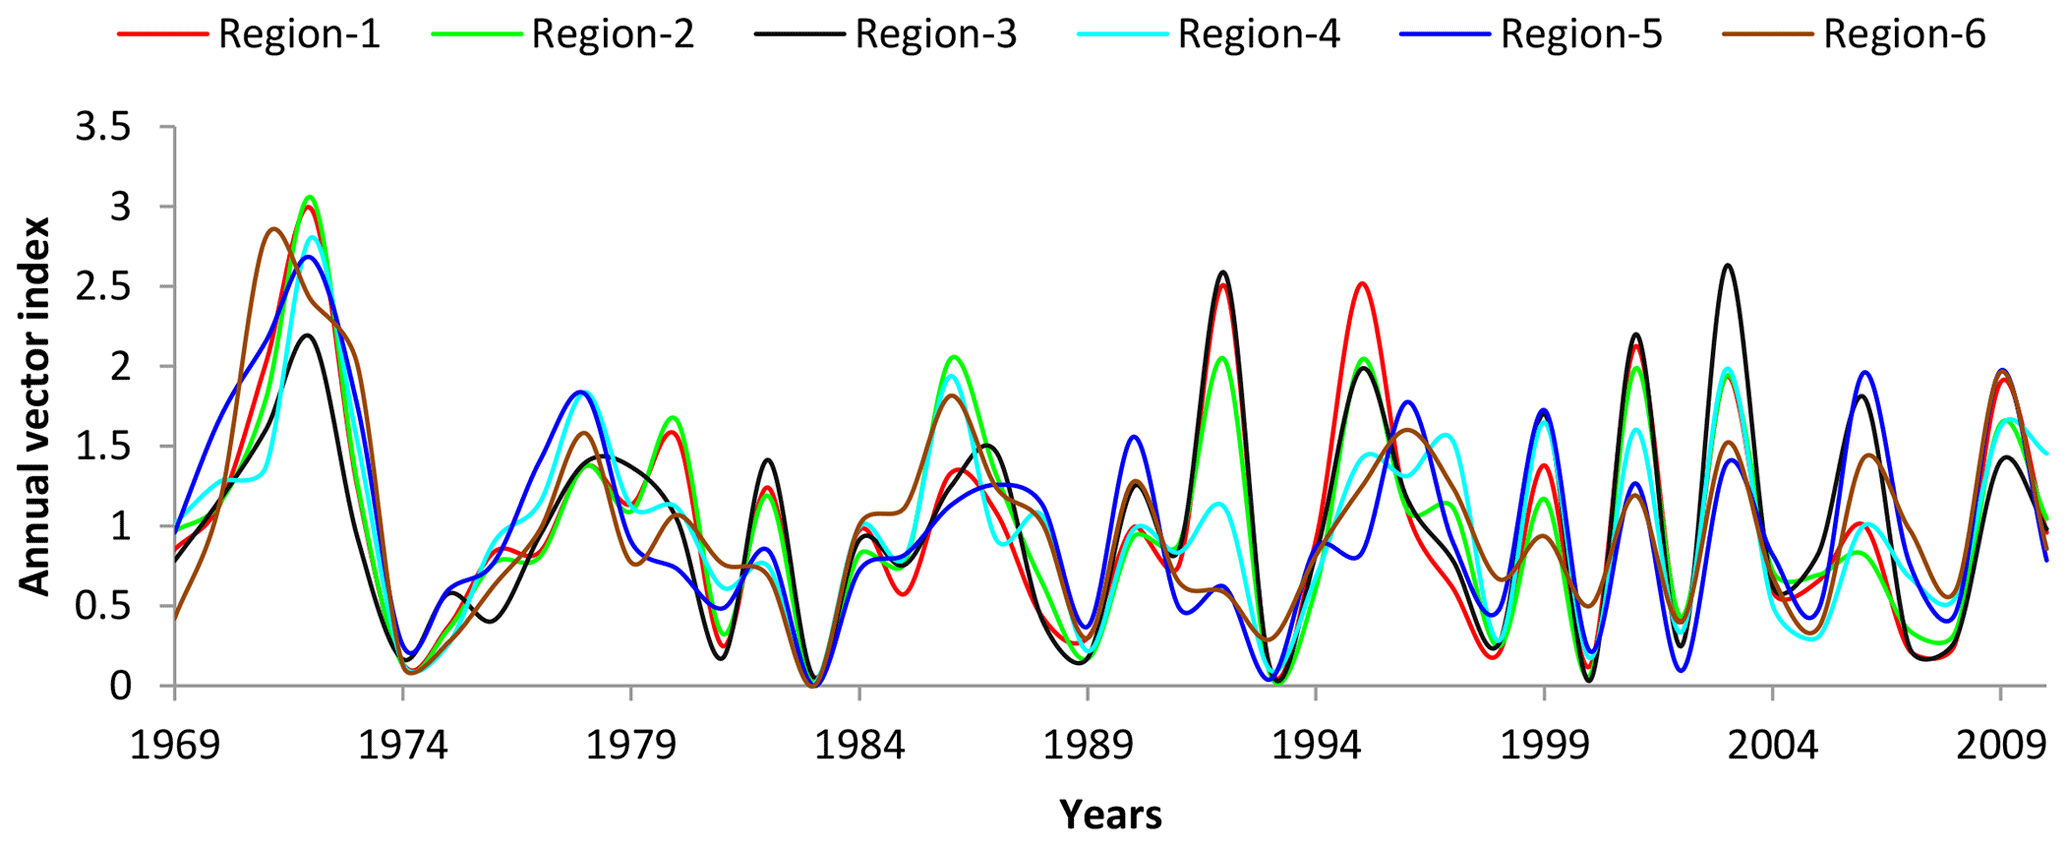
The regional vector also allows us to synthesize the rainfall signal in each region as a vector. This makes it easily accessible and simplified to visualize and understand the evolution of rainfall in each region as well as to compare regions. Figure 2 shows that the six regions have the same fluctuation in the rainfall signal. In contrast, the amplitude of the rainfall signal is varying according to the regions. It is relatively the same in regions 1, 2 and 3. In addition, region 4 shows a variation in amplitude close to that of region 6. On the other hand, region 5 located in the South Western part of the basin is characterized by the lowest amplitudes.
3.2 Study and identification of the rainfall temporal variability
The observation period for all stations extends from 1968 to 2010, except for the stations 013002 and 012503 that have observation periods from 1930 to 2007 and from 1936 to 2010, respectively.
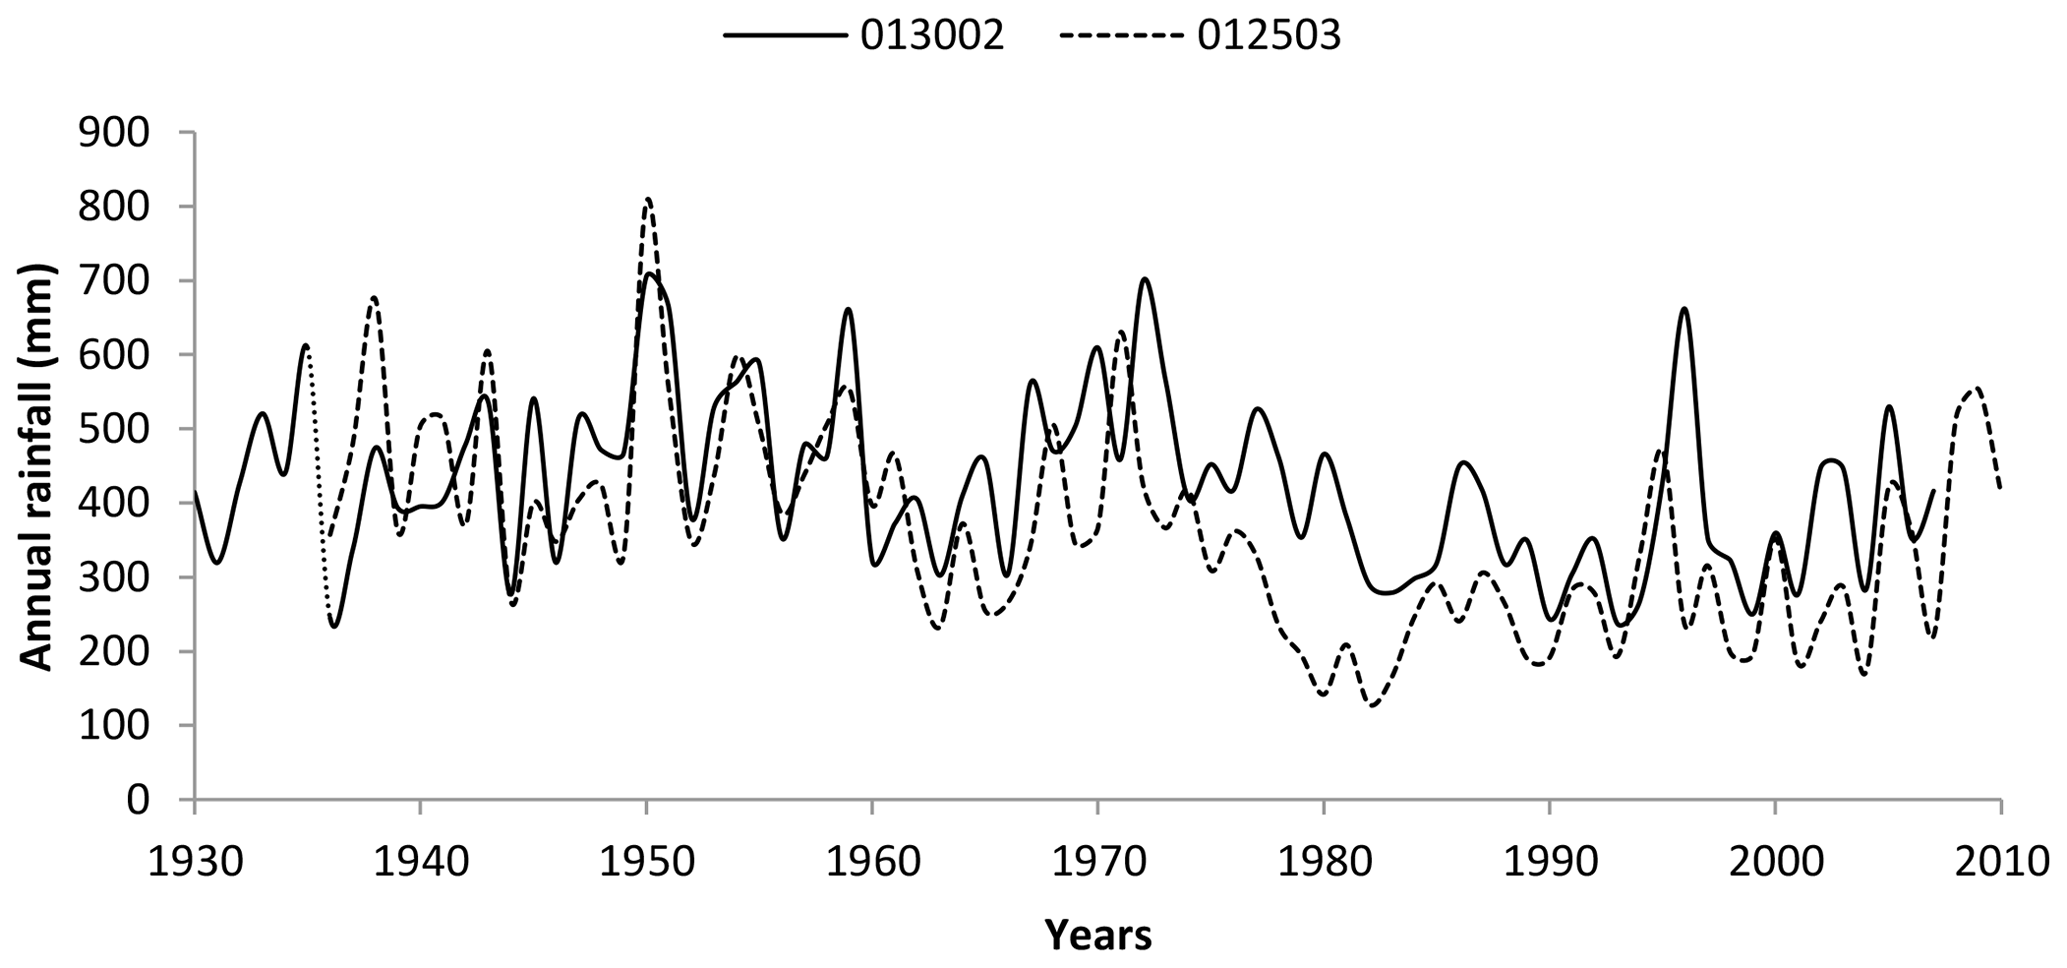
Figure 3 shows the rainfall evolution in these two stations. It highlights the alternation of dry and wet years along the observation period and also shows a gradual decrease in rainfall in the mid-1970s. It is noted that rainfall from 1930 to 1970 fluctuated around a relatively higher average than that of the 1970–2010 period.
The break tests were applied to the 50 rainfall time series considered in this study. The first homogeneous region experienced a break (a decrease in annual rainfall) in 1979; this jump was observed in 4 stations among 6 stations included in this group. Rainfall in the second homogeneous region began to decline in 1979 and 1980; among the 15 stations in this group, 8 had a break in 1980 and 4 in 1979. 2 out of 3 stations in the third homogeneous group showed no downward trend. From the 11 stations belonging to region 4, 3 stations exhibited a decreasing trend from 1978, 4 experienced a break in 1979 and 3 stations reported a jump in 1980. Rainfall in the fifth homogeneous region began to decrease in 1976, a date detected at 4 of the 5 stations belonging to this region. In the coastal region, the downward trend was introduced in 1972 and affected all the stations by the end of 1977. In short, this downward trend appeared in the Cheliff basin in 1972, where it occurred in some coastal stations. In 1976, the decrease in rainfall extended to both South West and coastal stations. This decline began to reach the central part of the basin in 1978, and then it spread to the East and South East of the Cheliff in 1980. These results are consistent with the work of other researchers on Algeria (Hallouz et al., 2013; Meddi and Hubert, 2003), and even at the regional level (Singla et al., 2010; Kingumbi et al., 2005).
It is known that climatic factors strongly influence the variability of rainfall at different time scales. However, the real reasons for this sudden decline in the 1980s are now unknown. On the one hand, reliable conclusions cannot be made about the cyclical pattern of rainfall in the study area, given the limited number of observation years. On the other hand, conclusions on the type of oscillation index influencing rainfall in the study area are contradictory. For example, Meddi et al. (2010) and Taibi et al. (2017) assert that the variability of rainfall in the study area is positively correlated with the Southern Oscillation Index (SOI) while Salameh (2008) and Xoplaki et al. (2004) argue that climate variability in the Mediterranean area is influenced by the North Atlantic and Mediterranean Oscillations. In the current context, such a decrease can also be attributed to climate change and its possible impacts on rainfall.

Figure 4Rainfall deficit in the Cheliff Basin, Algeria.
Figure 4 illustrates the deviation between the average of the pre-break period (1968–1980) and the average of the post-break period (1981–2010) for each station. In terms of deficits, the first homogeneous region experienced an estimated average decline by 31.5 %. In addition, the 15 stations in the second homogeneous region showed an average deficit of 22.8 %. The 11 stations belonging to the homogeneous group 4 also reported an estimated average decrease of 18.73 %, while those in the 5th homogeneous region dropped by an average of 31.8 %. The coastal stations belonging to the 6th region recorded an estimated decrease of 30.75 %.
It can be seen that the stations located in high relief areas and in the coastal region are more affected by the decline. In contrast, the stations in the central part of the basin, in plains with moderate relief, experienced a relatively small decrease. Meddi and Meddi (2007), Ghenim and Megnounif (2013), Meddi et al. (2010) and Taibi et al. (2013) showed the same deficit magnitudes over the study area and surrounding regions.
3.3 Study of the spatial variability of rainfall
The spatialization was performed over 2 different periods, the first period is from 1968 to 1980 and the second one is from 1980 to 2010. This distribution was chosen in order to understand the spatial structure of rainfall after and before the downward trend over the entire basin.
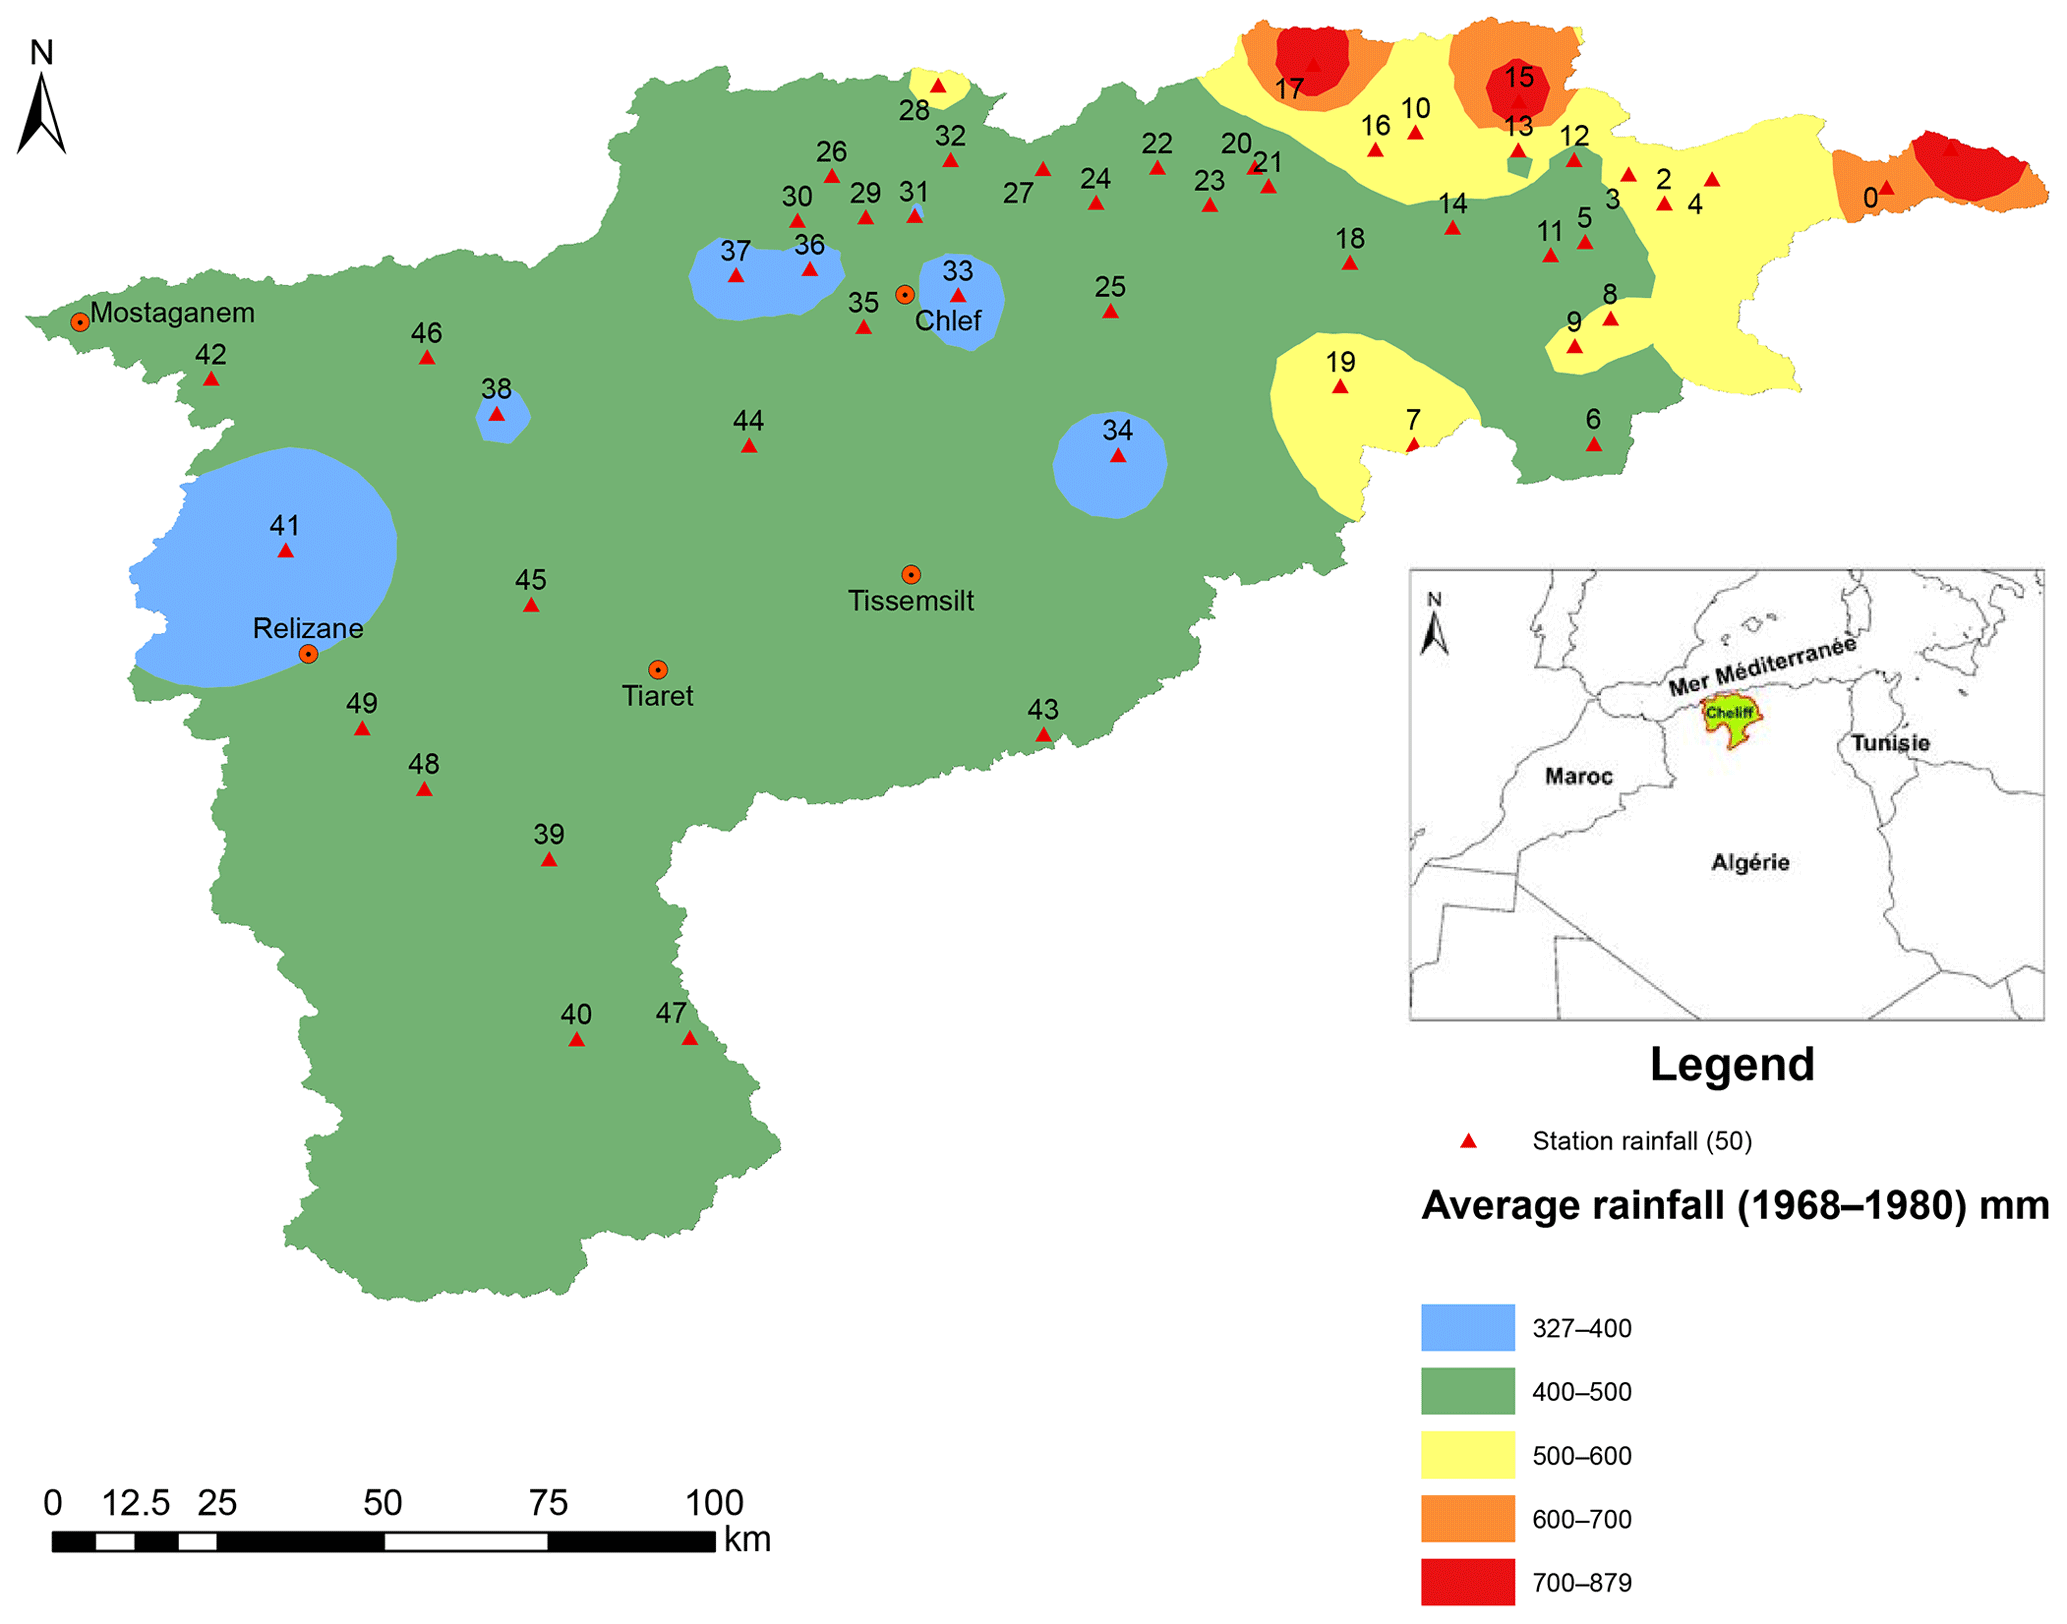
Figure 5Inter-annual rainfall map in the Cheliff Basin (1968–1980).
Figure 5 shows the distribution of inter-annual average rainfall over the study area from 1968 to 1980, the year during which the decreasing trend in annual totals spread to the entire basin. This map displays the increase in rainfall from West to East.
The coastal region of the Cheliff wadi received an average ranging from 311 to 400 mm during the 22 years of observations. In addition, the central plains of the basin and the upstream part of the Mina River experienced an average rainfall varying from 400 to 450 mm, and the valleys connecting the central plains and the mountain ranges of the Atlas were watered with an average from 450 to 550 mm. Besides, the Eastern and North Eastern mountain areas were provided with rainfall between 550 and 800 mm.
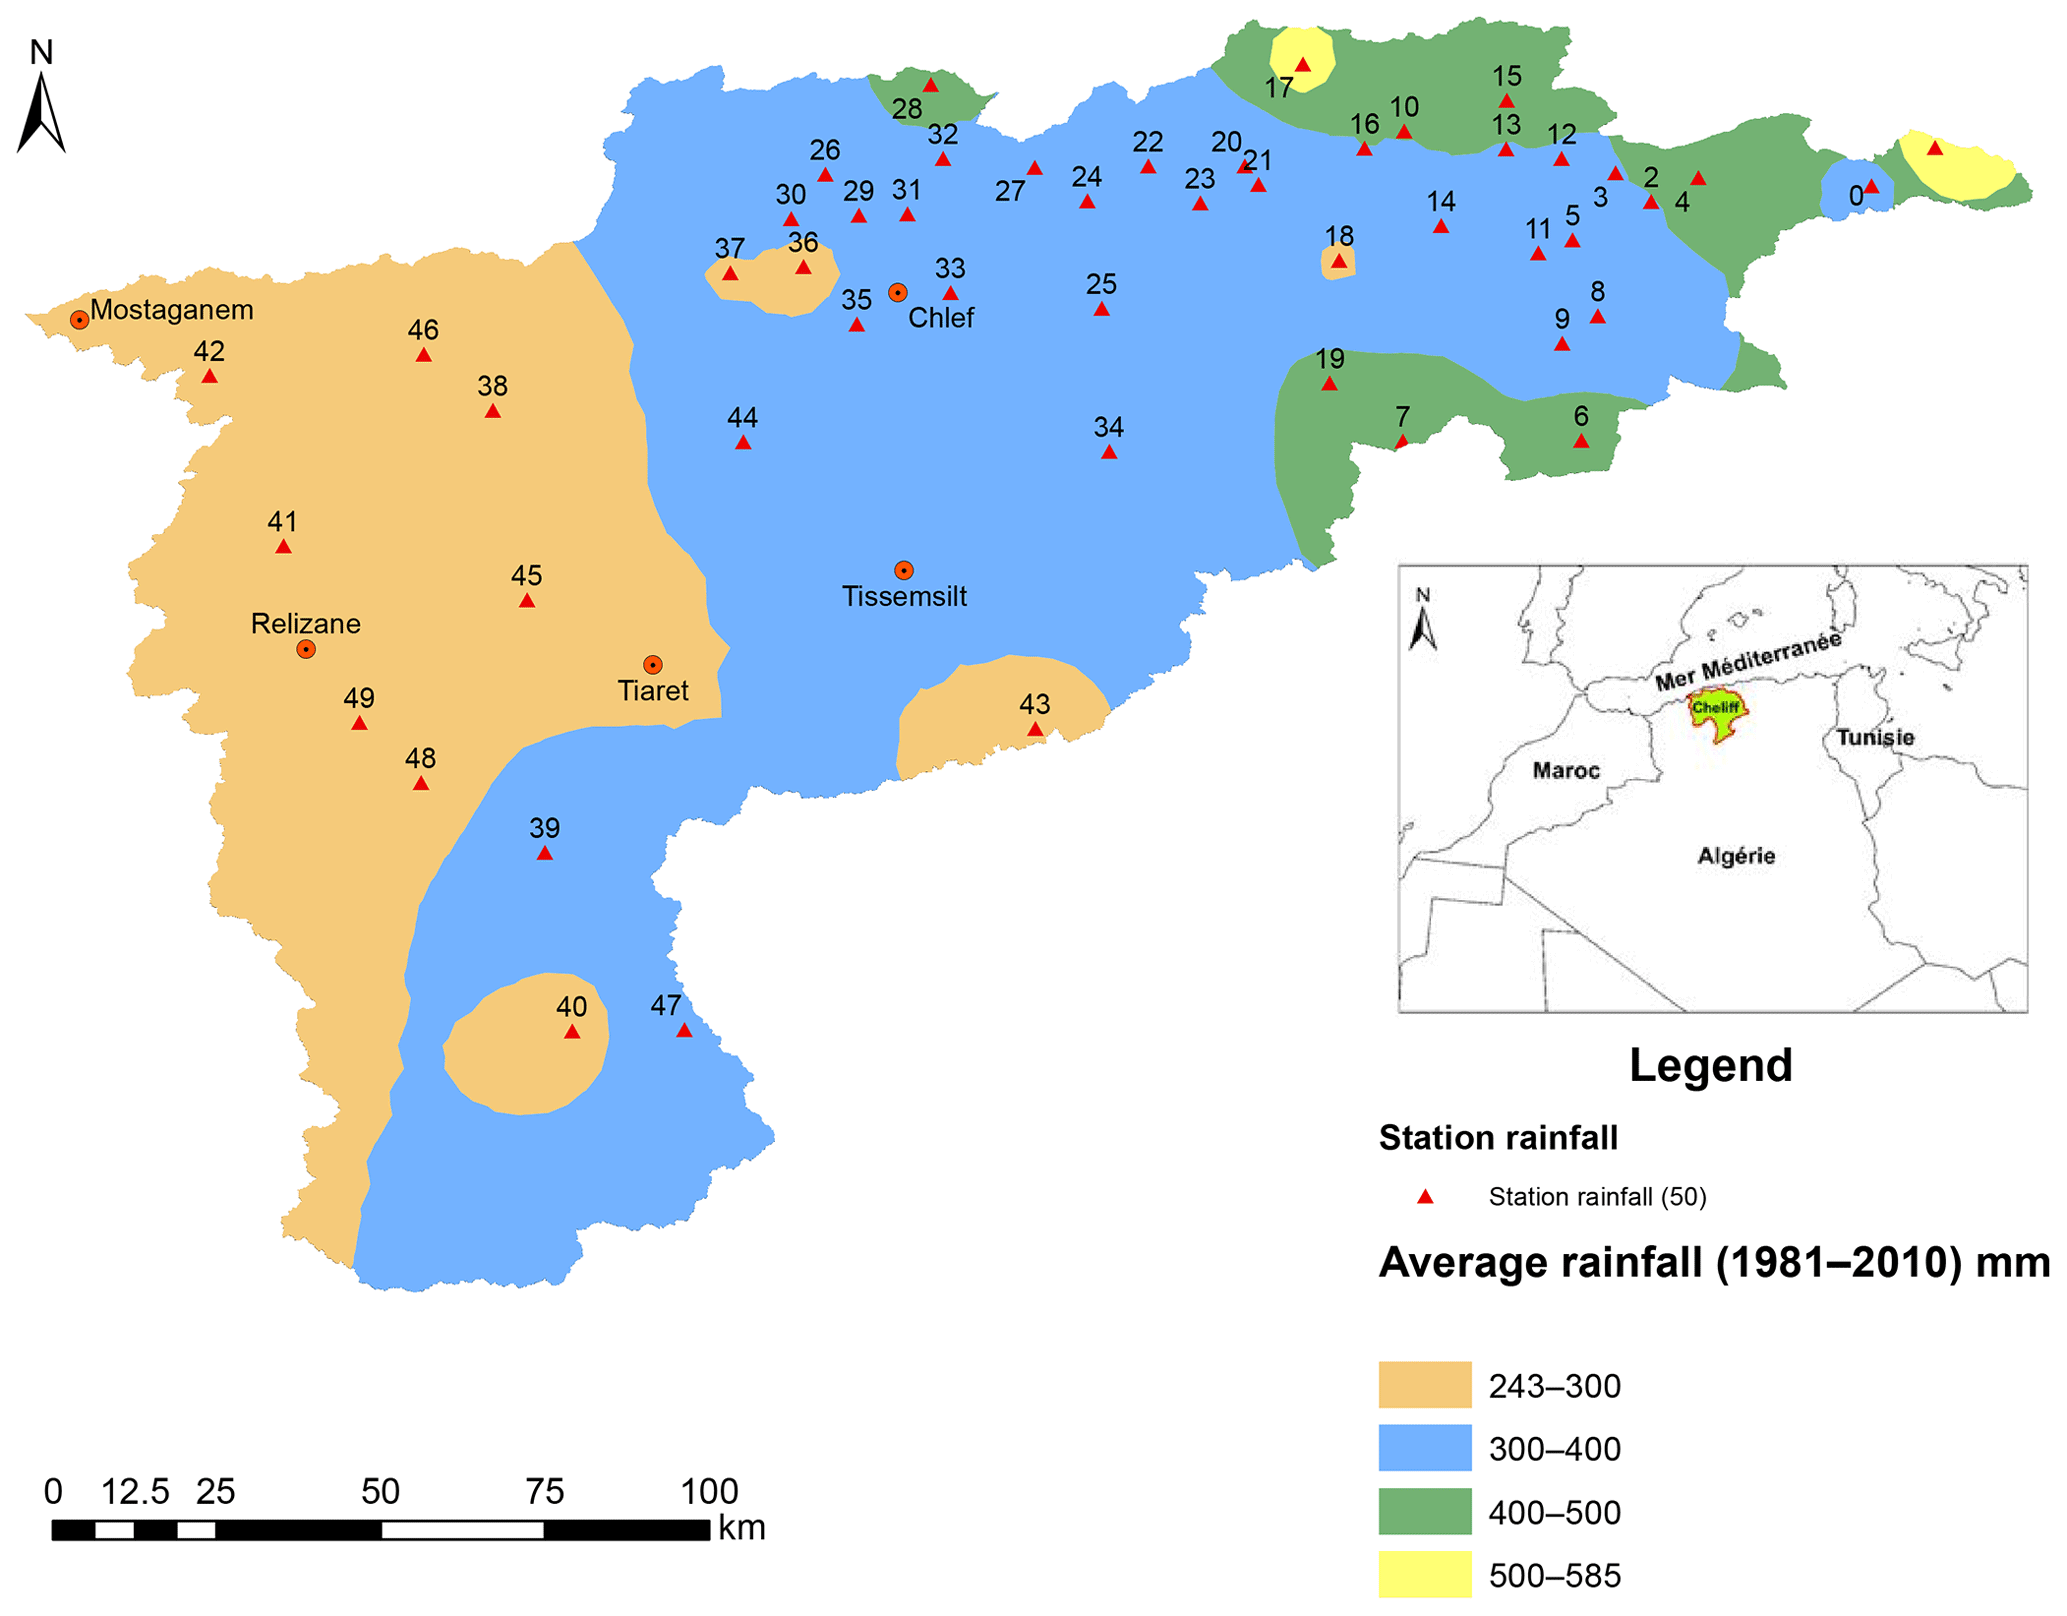
Figure 6Inter-annual rainfall map in the Cheliff Basin (1981–2010).
Following the propagation of the break through the whole basin in 1980, the average inter-annual rainfall calculated over a period of 30 years (1981–2010) showed the same spatial irregularity with an increase along a West-to-East oriented axis. On the other hand, the rainfall amounts received by the various regions identified above have decreased relatively in the entire basin Fig. 6. Thus, the coastal region experienced rainfall ranging from 240 to 300 mm. In addition, rainfall dropped from (400, 450 mm) to (300, 350 mm) after 1980 in the central plains region and upstream the Mina. Besides, the valley area received rainfall varying from 400 to 450 mm while the Eastern and North Eastern mountains experienced rainfall ranging from 450 to 580 mm. In sum, it is noted that the annual totals decreased on average by 100 mm in the study area, except for the high relief region located in the Eastern and North Eastern part, which had a rainfall decrease of over 200 mm.
A study of the spatial and temporal variability of rainfall, as well as the determination of homogeneous rainfall units in the Cheliff basin, was conducted based on data from 50 rainfall stations over a 42-year observation period (1968–2010).
The regional vector method validated 6 homogeneous regions. Subsequently, the rainfall signal was synthesized in each region. The comparison between the six regional vectors developed showed a similar evolution of rainfall in the East and the central part of the basin. However, the rainfall pattern in the coastal region and the South Eastern part was different from the rest of the basin.
The 3 statistical tests used in the study of the temporal variability of rainfall showed a general downward trend over the entire basin in 1980. The rainfall deficit recorded over the period 1981–2010 compared to the period 1968–1980 is estimated at an average of 30 % in the Eastern part of the basin, the coastal region and the upstream part of the Mina. In addition, the plain domain located in the central part of the basin has experienced an average estimated decrease of 20 %.
The study area has a high spatial variability in rainfall. This variability is directly related to the topographical variety that characterizes it (plain, valley, plateaus, isolated or chain mountains). The same spatial distribution of rainfall during the periods 1968–1980 and 1981–2010 is observed, with an increase in rainfall from West to East. On the other hand, rainfall decreased by an average of 100 mm during the post-break period over the entire basin, except in the Eastern part where the decrease exceeded 200 mm.
The reduction in rainfall since 1980 has resulted in a considerable rainfall deficit. Such a decline caused a dramatic impact on the availability of water resources. To this end, a good understanding and estimation of rainfall variability is of crucial importance in any approach to preserve and manage water resources.
The data are not publicly accessible.
GM and MM provided the work supervision and AH performed the calculation and analysis.
The authors declare that they have no conflict of interest.
This article is part of the special issue “Hydrological processes and water security in a changing world”. It is a result of the 8th Global FRIEND–Water Conference: Hydrological Processes and Water Security in a Changing World, Beijing, China, 6–9 November 2018.
This study was carried out as part of the referenced TASSILI research project (40010RJ/18MDU109). We would like to thank the Directorate-General of Scientific Research and Technological Development (Algeria) and the Joint Research Unit HydroSciences Montpellier (France).
This research has been supported by the Partenariat Hubert Curien (PHC) TASSILI program (grant no. 18MDU109).
Bodian, A.: Caractérisation de la variabilité temporelle récente des précipitations annuelles au Sénégal (Afrique de l'Ouest), Physio-Géo. Géographie physique et environnement, 8, 297–312, 2014.
Boyer, J.-F.: Logiciel Khronostat d’analyse statistique de séries chronologiques. IRD UR2 Programme 21 FRIEND AOC, Equipe Hydrologie UMRGBE, Université de Montpellier II, Ecole des Mines de Paris, France, 1998.
IPCC: Climate Change 2007: The Physical Science Basis. Contribution of Working Group I to the Fourth Assessment Report of the Intergovernmental Panel on Climate Change, edited by: Solomon, S., Qin, D., Manning, M., Chen, Z., Marquis, M., Averyt, K. B., Tignor, M., and Miller, H. L., Cambridge University Press, Cambridge, UK and New York, NY, USA, 996 pp., 2007.
IPCC: Climate Change 2014: Mitigation of Climate Change. Contribution of Working Group III to the Fifth Assessment Report of the Intergovernmental Panel on Climate Change, edited by: Edenhofer, O., Pichs-Madruga, R., Sokona, Y., Farahani, E., Kadner, S., Seyboth, K., Adler, A., Baum, I., Brunner, S., Eickemeier, P., Kriemann, B., Savolainen, J., Schlömer, S., von Stechow, C., Zwickel, T., and Minx, J. C., Cambridge University Press, Cambridge, UK and New York, NY, USA, 161 pp., 2014.
Davis, J. C.: Statistics and Data Analysis in Geology, John Wiley and Sons, New York, USA, 656 pp., 1986.
Franke, R.: Scattered data interpolation: tests of some methods, Math. Comput., 38, 181–200, 1982.
Ghenim, A. N. and Megnounif, A.: Analyse des précipitations dans le Nord-Ouest algérien, Science et changements planétaires/Sécheresse, 24, 107–114, 2013.
Hallouz, F., Meddi, M., and Mahe, G.: Modification du régime hydroclimatique dans le bassin de l'Oued Mina (nord-ouest d'Algérie), Revue des sciences de l'eau/Journal of Water Science, 26, 33–38, 2013.
Hiez, G.: L'homogénéité des données pluviométriques, Cahiers ORSTOM, série Hydrologie, 14, 29–173, 1977.
Hubert, P. and Carbonnel, J. P.: Approche statistique de l'aridification de l'Afrique de l'Ouest, J. Hydrol., 95, 165–183, 1987.
Kingumbi, A., Bargaoui, Z., and Hubert, P.: Investigation of the rainfall variability in central Tunisia/Investigations sur la variabilité pluviométrique en Tunisie centrale, Hydrolog. Sci. J., 50, p. 508, https://doi.org/10.1623/hysj.50.3.493.65027, 2005.
Kotti, F. C., Mahe, G., Habaieb, H., Dieulin, C., Calvez, R., and Ali, H. B.: Etude des pluies et des débits sur le bassin versant de la Medjerda, Tunisie Study of rainfall and discharges in the Medjerda watershed, Tunisia, Bulletin de l'Institut Scientifique, Rabat, 38, 19–28, 2016.
Lee, A. F. and Heghinian, S. M.: A Shift Of The Mean Level In A Sequence Of Independent Normal Random Variables – A Bayesian Approach, Technometrics, 19, 503–506, 1977.
Mahé, G. and L'Hôte, Y.: Utilisation de la Méthode du Vecteur Régional pour la description des variations pluviométriques interannuelles en Afrique de l'Ouest et centrale de 1951 à 1989, Régionalisation en hydrologie: application au développement. Huitièmes Journées Hydrologiques de l'ORSTOM, Montpellier, France, 22–23, 1992.
Mahé, G. and Olivry, J. C.: Variations des précipitations et des écoulements en Afrique de l'Ouest et centrale de 1951 à 1989, Science et changements planétaires/Sécheresse, 6, 109–117, 1995.
Meddi, M. and Hubert, P.: Impact de la modification du régime pluviométrique sur les ressources en eau du nord-ouest de l’Algérie, in: Hydrology of the Mediterranean and Semiarid Regions, IAHS Publ, 278, 229–235, 2003.
Meddi, H. and Meddi, M.: Variabilité spatiale et temporelle des précipitations du Nord-Ouest de l'Algérie, Géographia technica, 2, 49–55, 2007.
Meddi, M., Assani, A., and Meddi, H.: Temporal variability of annual rainfall in the Macta and Tafna catchments, Northwestern Algeria, Water Resour. Manag., 24, 3817–3833, 2010.
Pettitt, A.: A non-parametric approach to the change-point problem, J. Roy. Stat. Soc. C-App., 28.2, 126–135, 1979.
Salameh, T.: Modelisation multi-echelles de la circulation atmospherique sur le bassin mediterraneen, Doctoral dissertation, Ecole Polytechnique X, Paris, France, 2008.
Singla, S., Mahé, G., Dieulin, C., Driouech, F., Milano, M., El Guelai, F. Z., and Ardoin-Bardin, S.: Evolution des relations pluie-débit sur des bassins versants du Maroc, Global Change: Facing Risks and Threats to Water Resources, Proc. Of the Sixth World FRIEND Conference, Fez, Morocco, IAHS. 340, 679–687, 2010.
Taibi, S., Meddi, M., Souag, D., and Mahé, G.: Évolution et régionalisation des précipitations au nord de l'Algérie (1936–2009), Climate and land surface changes in hydrology, IAHS Publ, 359, 191–197, 2013.
Taibi, S., Meddi, M., Mahé, G., and Assani, A.: Relationships between atmospheric circulation indices and rainfall in Northern Algeria and comparison of observed and RCM-generated rainfall, Theor. Appl. Climatol., 127, 241–257, 2017.
Vauchel, P.: Hydraccess: Software for Management and processing of Hydro–meteorological data software, Version 2.1.4, available at: https://www.documentation.ird.fr/hor/fdi:010026171 (last access: 5 August 2020), 2005.
WWAP (United Nations World Water Assessment Programme)/UN-Water: The United Nations World Water Development Report 2018: Nature-Based Solutions for Water, UNESCO, Paris, France, 154 pp., 2018.
Xoplaki, E., González-Rouco, J. F., Luterbacher, J., and Wanner, H.: Wet season Mediterranean precipitation variability: influence of large-scale dynamics and trends, Clim. Dynam., 23, 63–78, 2004.