the Creative Commons Attribution 4.0 License.
the Creative Commons Attribution 4.0 License.
 | 16 Sep 2020
Variations of Seasonal Precipitation in the Yellow River Basin and Its Relationship to General Circulation and SST
Jing Liu
Lijun Jin
Changxing Huang
Lina Zhang
Based on the precipitation data from 1961 to 2017 in the Yellow River Basin and NCEP/NCAR reanalysis data, the variation characteristics of seasonal precipitation in the Yellow River Basin and its relationship to the circulation patterns were analyzed. Furthermore, effect of sea surface temperature (SST) on the seasonal precipitation was discussed. The results were as follows: (1) The precipitation in spring, summer and autumn all presented non-significant decreasing trends, while that in winter presented a non-significant upward trend. (2) The inter-annual and inter-decadal fluctuations of the precipitation of each season were evident. The fluctuation in winter was the most obvious, followed by that in spring and autumn, with that in summer most stable. Moreover, the precipitation in summer, autumn and winter in 1990s was the least. (3) When the precipitation in spring, autumn and winter was significantly above (below) normal, the 500 hPa height anomaly field over Eurasia mid-high latitude of the corresponding period presented “positive (negative) in east and negative (positive) in west”. While, when the precipitation in summer was significantly above (below) normal, the height anomaly field presented “, , ”, and the West Pacific subtropical high was stronger (weaker) and lying more northward (southward). Additionally, when the precipitation in each season was significantly above (below) normal, the 850 hPa wind anomalies showed abnormal southerly (northerly) winds in Eastern China, which was favorable (unfavorable) to transport water vapor from the South China Sea and the Western North Pacific to the Yellow River Basin. (4) The spring precipitation was above (below) normal during the period of El Niño (La Niña), while the summer, autumn and winter precipitation presented the opposite characteristics.
- Article
(4183 KB) - Full-text XML
- BibTeX
- EndNote


The Yellow River Basin with a vast territory is the second largest river in China. Precipitation is the main source of water resources, having significant effect on industrial and agricultural production as well as people's livelihood (Shao et al., 2015). Hence, it is a very meaningful work to study the precipitation variations in the Yellow River Basin. The annual mean precipitation increases from the northwest to the southeast. Generally, the spatial distribution of the seasonal precipitation is identical to that of the annual mean precipitation, but there are differences in some local area as the season changes (Chang et al., 2014; Zhu et al., 2005; Xu and Zhang, 2006). In recent 50 years, the annual, spring, summer and autumn precipitation all presented decreasing trends except for that in winter (Chang et al., 2014; Yao and Wu, 2014). Wang et al. (2012) proposed that there was significant inter-annual fluctuation for the summer precipitation with rainy years alternating with dry years. Chen et al. (2016) considered that the seasonal precipitation distribution changed in 1990s, namely, if the proportion of the seasonal precipitation gradually increased before 1990s, it would decrease after 1990s.
There had been many researches on the causes of the summer precipitation anomaly in the Yellow River Basin. Wang et al. (2012) proposed that monsoon, the West Pacific subtropical high, extratropical cyclone and the depression in Lake Baikal were the main circulation systems affecting the summer precipitation. Shao et al. (2015) and Song et al. (2013) considered that when the upper-level jet stream in East Asian and the West Pacific subtropical high were stronger (weaker) and lying more northward (southward), and simultaneously the trough in Lake Baikal was deeper (higher), there would be more (less) precipitation in the middle reaches of the Yellow River. Chang et al. (2014) discovered that the break-point of the precipitation in the Yellow River Basin was around 1986, and the change was mainly closely related to the monsoon variation. Lan et al. (2007) considered that Ural blocking highs existed mostly when the summer precipitation was plentiful in the upper reaches of the Yellow River, and vice versa. Weather and climate is directly affected by atmospheric circulation, and is also obviously influenced by the sea surface temperature (SST) via acting on atmospheric circulation. Many studies found that El Niño and La Niña had a significant relationship with precipitation distribution in China. In El Niño years, precipitation was more (less) than normal in the south (north) of China, and that was the opposite in La Niña years (Gong et al., 1998; Xu et al., 2005). Zhao et al. (2018) considered that the annual mean precipitation was decreased in the El Niño years and increased in La Niña years. Chang et al. (2013) defined the NINO3 SST difference index from the previous October to current April and indicated that the index had a significant negative correlation with summer precipitation in the Yellow River Basin.
Predominantly, the data used in the previous studies was mostly of the period before 2010, and the objects were about the summer precipitation in the Yellow River Basin. While in this paper, the data was prolonged to 2017 and the evolution characteristics of the spring, summer, autumn and winter precipitation were analyzed. Furthermore, the effects of atmospheric circulation as well El Niño and La Niña on the seasonal precipitation were discussed to provide a basis for seasonal precipitation forecast in the Yellow River Basin.
2.1 Data
The monthly area rainfall data of 1961–2017 applied in this paper was from the Information Center (Hydrology Monitor and Forecast Center), Ministry of Water Resources; The monthly reanalysis data of geopotential height and wind fields were from the U.S National Center for Environmental Prediction and National Center for Atmospheric Research (NCEP/NCAR), and the horizontal resolution was . The monthly SST data was from the Met Office Hadley Centre for Climate Prediction and Research, and the horizontal resolution was (Rayner et al., 2003).
2.2 Methods
The year was divided into four seasons: spring (March, April and May), summer (June, July and August), autumn (September, October, November) and winter (December, January and February of the next year). The least square method was used to calculate the linear variation trends and the significance was estimated by T test (Wei, 1999). The seasonal precipitation was standardized and the obtained value greater (less) than 1 (−1) was defined as significantly above (below) normal. Furthermore, composite analysis of the general circulation anomaly fields for the periods with extremely excessive or deficient seasonal precipitation was applied, and then the differences between the two situations were estimated and tested by T test (Wei, 1999). Specially, it should be noted that the climate fields were of the period from 1961 to 2017.
Table 1Seasonal precipitation eigenvalues in the Yellow River Basin.
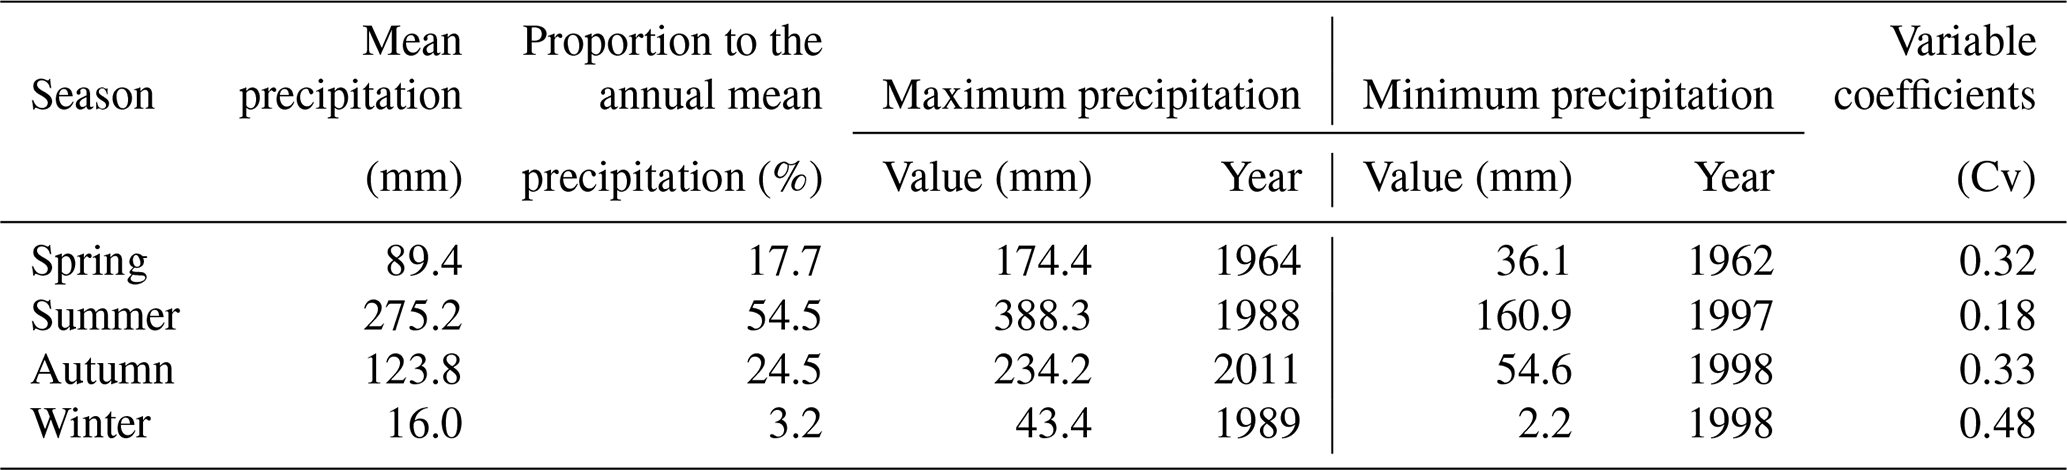

Figure 1Time series of the spring (a), summer (b), autumn (c) and winter (d) precipitation in the Yellow River Basin.
3.1 Season distribution of annual precipitation
The mean spring, summer, autumn and winter precipitation in the Yellow River Basin was respectively 89.4, 275.2, 123.8 and 16.0 mm, accounting for 17.7 %, 54.5 %, 24.5 % and 3.2 % of the mean annual precipitation (see Table 1), which was consistent with the previous studies (Chang et al., 2014; Chen et al., 2016). It was thus clear that the precipitation in summer was the most, followed by that in autumn and spring, with that in winter the least. The precipitation amount in summer was 16 times more than that in winter. Correlations between different period precipitation were measured and the results showed that the correlation coefficients between the annual precipitation and the spring/summer/autumn precipitation were respectively 0.39/0.71/0.61, which were all at 0.01 significance level, while the correlation coefficient between the annual precipitation and the winter precipitation and those between each seasonal precipitation were not significantly correlative. Overall, the annual precipitation amount was largely determined by the summer and autumn precipitation.
3.2 Inter-annual variation of the seasonal precipitation
The inter-annual fluctuation of each seasonal precipitation in the Yellow River Basin was evident (see Fig. 1). During the period from 1961 to 2017, the spring precipitation was extremely excessive in 1963, 1964, 1967, 1983, 1990, 1991 and 1998, while extremely deficient in 1962, 1981, 1995, 2000 and 2001. Specifically, the maximum/minimum spring precipitation appeared in 1964/1962, and accordingly the amount was 174.4/36.1 mm. The summer precipitation was extremely excessive in 1964, 1966, 1973, 1976, 1988, 1996, 2003, 2013 and 2016, while extremely deficient in 1965, 1969, 1972, 1974, 1986, 1991, 1997, 1999, 2001 and 2015, which were slightly different from the previous studies due to the using of data of different periods (Shao et al., 2015; Song et al., 2013; Zhang, 2011). The maximum/minimum summer precipitation appeared in 1988/1997, and accordingly the amount was 388.3/160.9 mm. The autumn precipitation was extremely excessive in 1961, 1964, 1967, 1968, 1975, 1983, 1985, 2003, 2011 and 2014, while extremely deficient in 1965, 1972, 1979, 1986, 1988, 1991 and 1998. Specifically, the maximum/minimum autumn precipitation appeared in 2011/1998, and accordingly the amount was 234.2/54.6 mm. The winter precipitation was extremely excessive in 1971, 1975, 1988, 1989, 2000, 2001, 2005 and 2007, while extremely deficient in 1962, 1967, 1982, 1983, 1985 and 1998. The maximum/minimum winter precipitation appeared in 1989/1998, and accordingly the amount was 43.4/2.2 mm. Variable coefficients (Cv) of each seasonal precipitation during the period from 1961 to 2017 were analyzed, and the results showed that the Cv of the summer precipitation was the minimum, followed by that of the spring and autumn precipitation, with that of the winter precipitation the maximum (see Table 1). Namely, the precipitation series distribution in summer was the most concentrated, while that in winter was the most dispersed.
3.3 Inter-decadal variation of the seasonal precipitation
The variation trends of the spring, summer, autumn and winter precipitation in the Yellow River Basin were respectively −1.9, −1.6, −2.2 and 0.3 mm per 10 years, which all failed the significance test. The inter-decadal variation for each seasonal precipitation was analyzed (see Fig. 1), and the results showed that the spring precipitation with 97.8/79.9 mm during the 1990s/1970s was the most/least. Conversely, the summer precipitation with 287.4/267.5 mm during the 1970s/1990s turned out to be the most/least. As for the autumn precipitation, the average amount with 130 mm since 2010 was the most, while the amount with 94.8 mm during the 1990s was the least. For the winter precipitation, the average amount with 20.3/13 mm during the 2000s/1990s was the most/least. In summary, the precipitation in summer, autumn and winter uniformly presented the least during the 1990s. Besides, the autumn precipitation successively showed decline and increase tendency before and after 1990s.
There were mainly two reasons that caused the abnormal precipitation: abnormal moisture condition; abnormal ascending movement. Moisture was transported mainly at 850 hPa and ascending movement was crucially provided by the background fields at 500 hPa (Hao et al., 2016). For the years with abnormal precipitation in the Yellow River Basin, the wind field at 850 hPa and the geopotential height field at 500 hPa definitely presented abnormal. Thus in order to find the relationship between the abnormal precipitation and the general atmospheric circulation, composite analyses of the two element fields were conducted respectively for the years with extremely excessive and deficient seasonal precipitation.
4.1 Characteristics of the geopotential height field at 500 hPa
When the precipitation was abnormal in spring, autumn or winter in the Yellow River Basin, the geopotential height anomaly fields of the corresponding period presented similar spatial distributions. For the years with extremely excessive precipitation, the anomaly field over Eurasia mid-high latitude presented “positive in east and negative in west”, namely the anomaly field presented positive in coastal region of East Asia and negative in Lake Balkhash and the area north to it. While the anomaly field presented opposite distribution for the years with extremely deficient seasonal precipitation. Ulteriorly the differences between the height anomaly fields for the years with extremely excessive precipitation and those for the years with extremely deficient precipitation were calculated and the results were analyzed by T test. It could be seen clearly that the spatial distribution of the difference field presented a positive centre in the Sea of Japan and a negative centre in the area to the north of Lake Balkhash, passing the significance test at 0.05 level, which was in accordance with the anomaly field for the years with extremely excessive precipitation. Especially, the difference field in winter was the greatest with the positive centre of “60 pm” and the negative centre of “−70 gpm” (see Fig. 2a, c and d).
When the precipitation was abnormal in summer, the spatial distribution of the height anomaly field at 500 hPa showed distinctly different. When the precipitation in summer was extremely excessive, the anomaly filed presented a pattern of “+, −, +” over Eurasia mid-high latitude with positive anomaly around the Ural Mountains and the Sea of Okhotsk and simultaneously negative anomaly around the Lake Baikal. Over mid-low latitude, there showed positive anomaly around the Yangtze-Huaihe Rivers and the south of the Yangtze River, which indicated that the West Pacific subtropical high was stronger and lying more northward and the warm moist southerly flow in the west of it met with the dry cold air diffused from the bottom of Lake Baikal Trough around the Yellow River Basin, leading to abundant precipitation. On the contrary, the anomaly field presented opposite distribution when the precipitation in summer was extremely deficient: both the trough located in the east of the Ural Mountains and that in coastal region of East Asia were stronger; there was a ridge around the Lake Baikal; the West Pacific subtropical high was weaker and lying more southward. Under this background, the most area of the Yellow River Basin was controlled by the north air stream behind the trough, which was unfavourable to bring about precipitation. Ulteriorly the differences between the height anomaly fields for the years with extremely excessive precipitation and those for the years with extremely deficient precipitation in summer were calculated and the results were analyzed by T test. It could be seen that the differences around the Ural Mountains, the Sea of Okhotsk and the Yangtze-Huaihe Rivers were positive, which all passed the significance test at 0.1 level (see Fig. 2b).
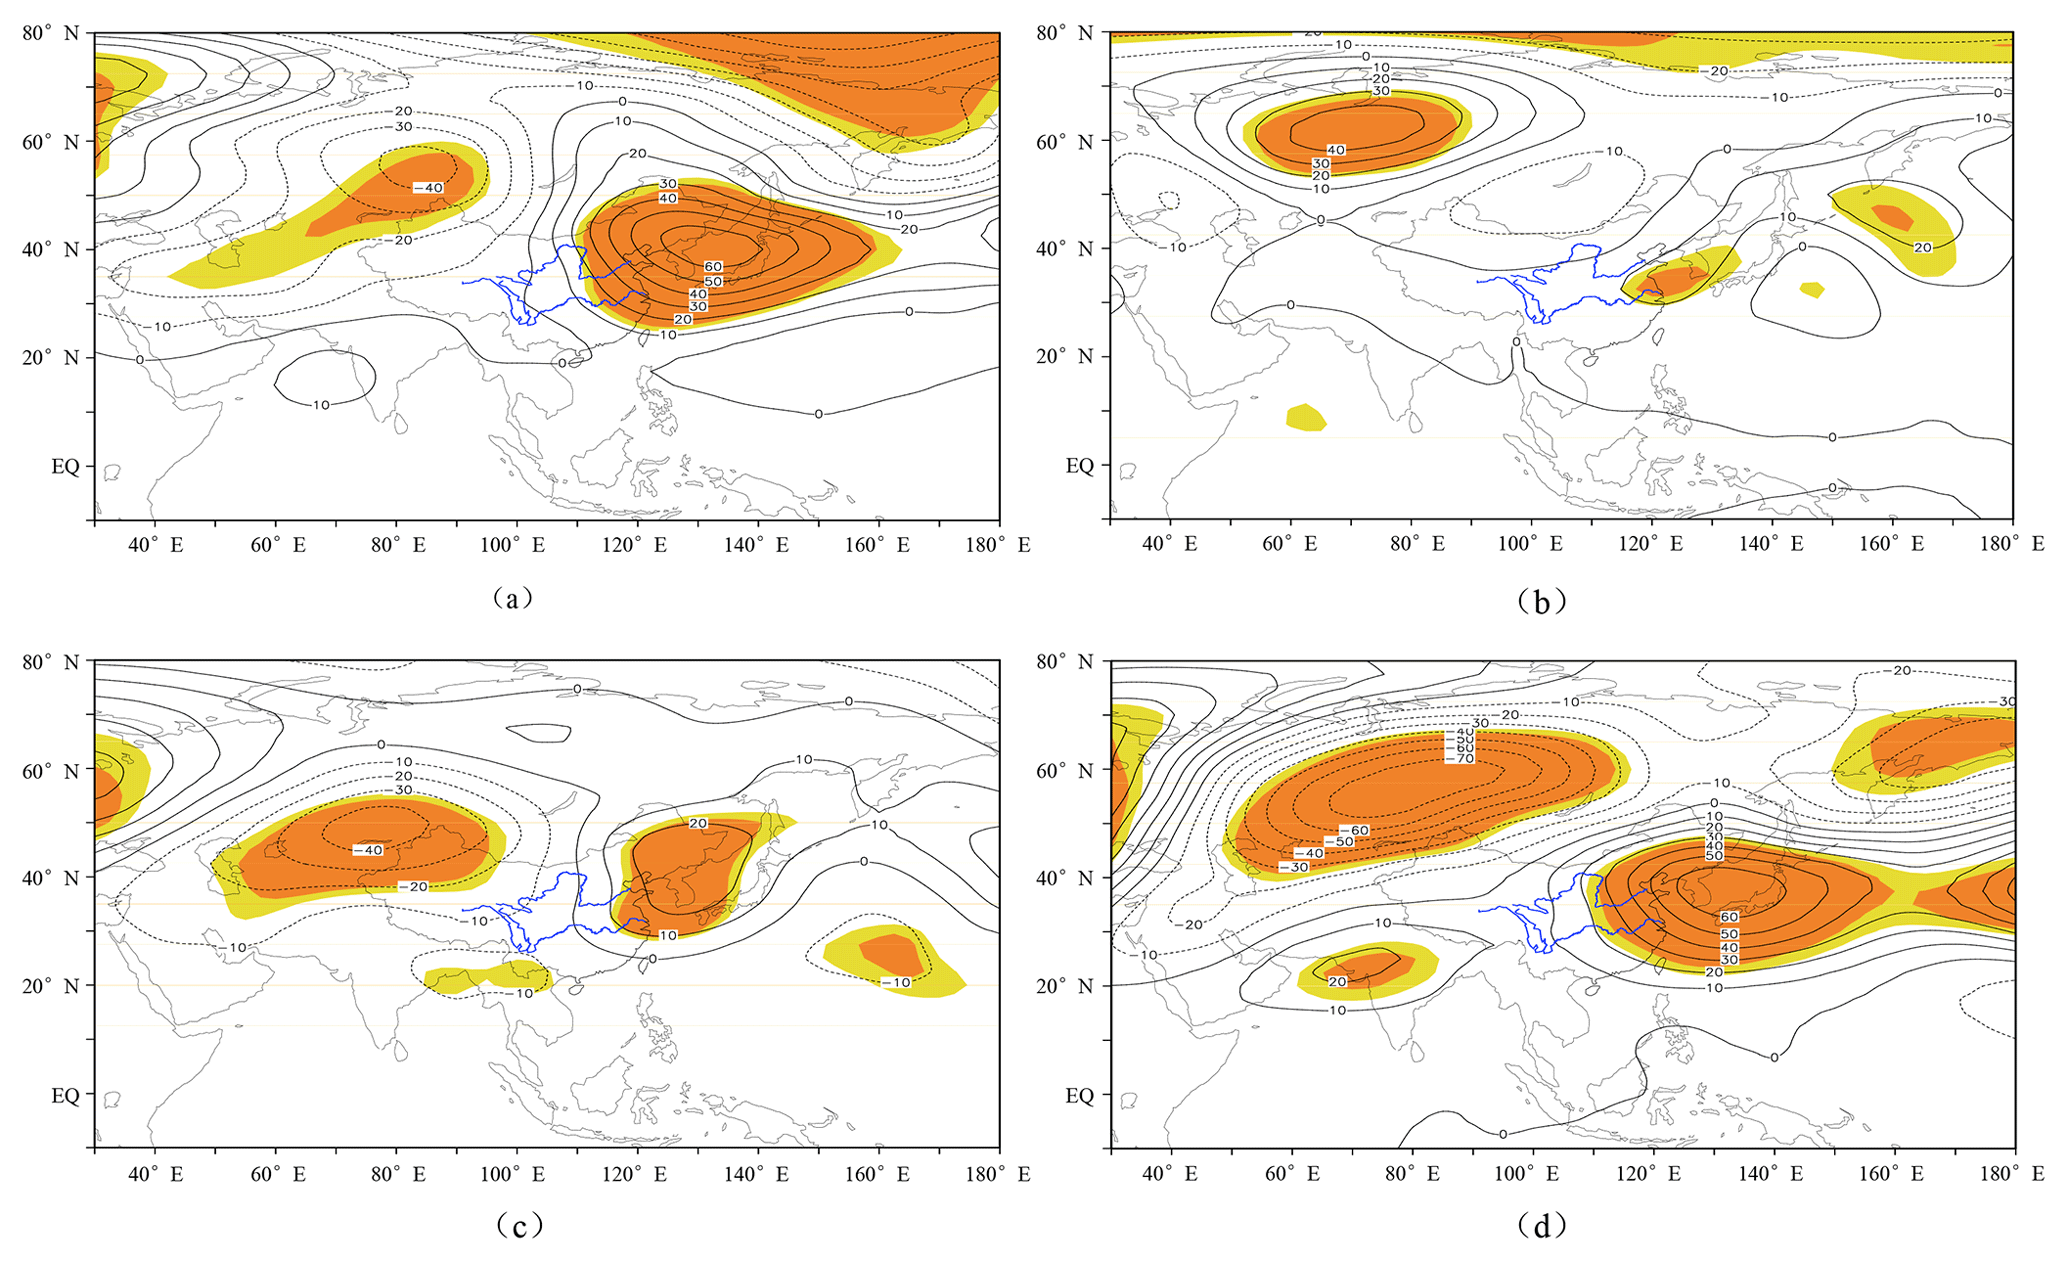
Figure 2The differences between the height anomaly fields at 500 hPa for the years with extremely excessive precipitation and those for the years with extremely deficient precipitation in spring (a), summer (b), autumn (c) and winter (d). (The yellow and orange parts respectively indicated the area passing the significance test at 0.1 and 0.05 levels.)
4.2 Characteristics of the wind field at 850 hPa
When the precipitation was significantly above normal in spring, summer, autumn and winter in the Yellow River Basin, the height anomaly fields at 500 hPa of the corresponding period were all beneficial to the formation of the abnormal southerly winds. Accordingly, the wind anomaly fields at 850 hPa indicated that there were uniformly abnormal southerly or southeasterly winds in Eastern China when the precipitation was extremely excessive, which was favourable to transport water vapor from the South China Sea and the Western North Pacific to the Yellow River Basin. Conversely, there were uniformly abnormal northerly winds in Eastern China when the precipitation was extremely deficient, which was not favourable to transport the water vapour to the north. The differences of the wind anomaly fields at 850 hPa were analyzed, and the results showed that the abnormal southerly winds in most of Eastern China in spring, autumn and winter passed the significance test at 0.05 level, while only those in areas from southern china to the lower reaches of the Yellow River in summer passed the significance test (see Fig. 3).
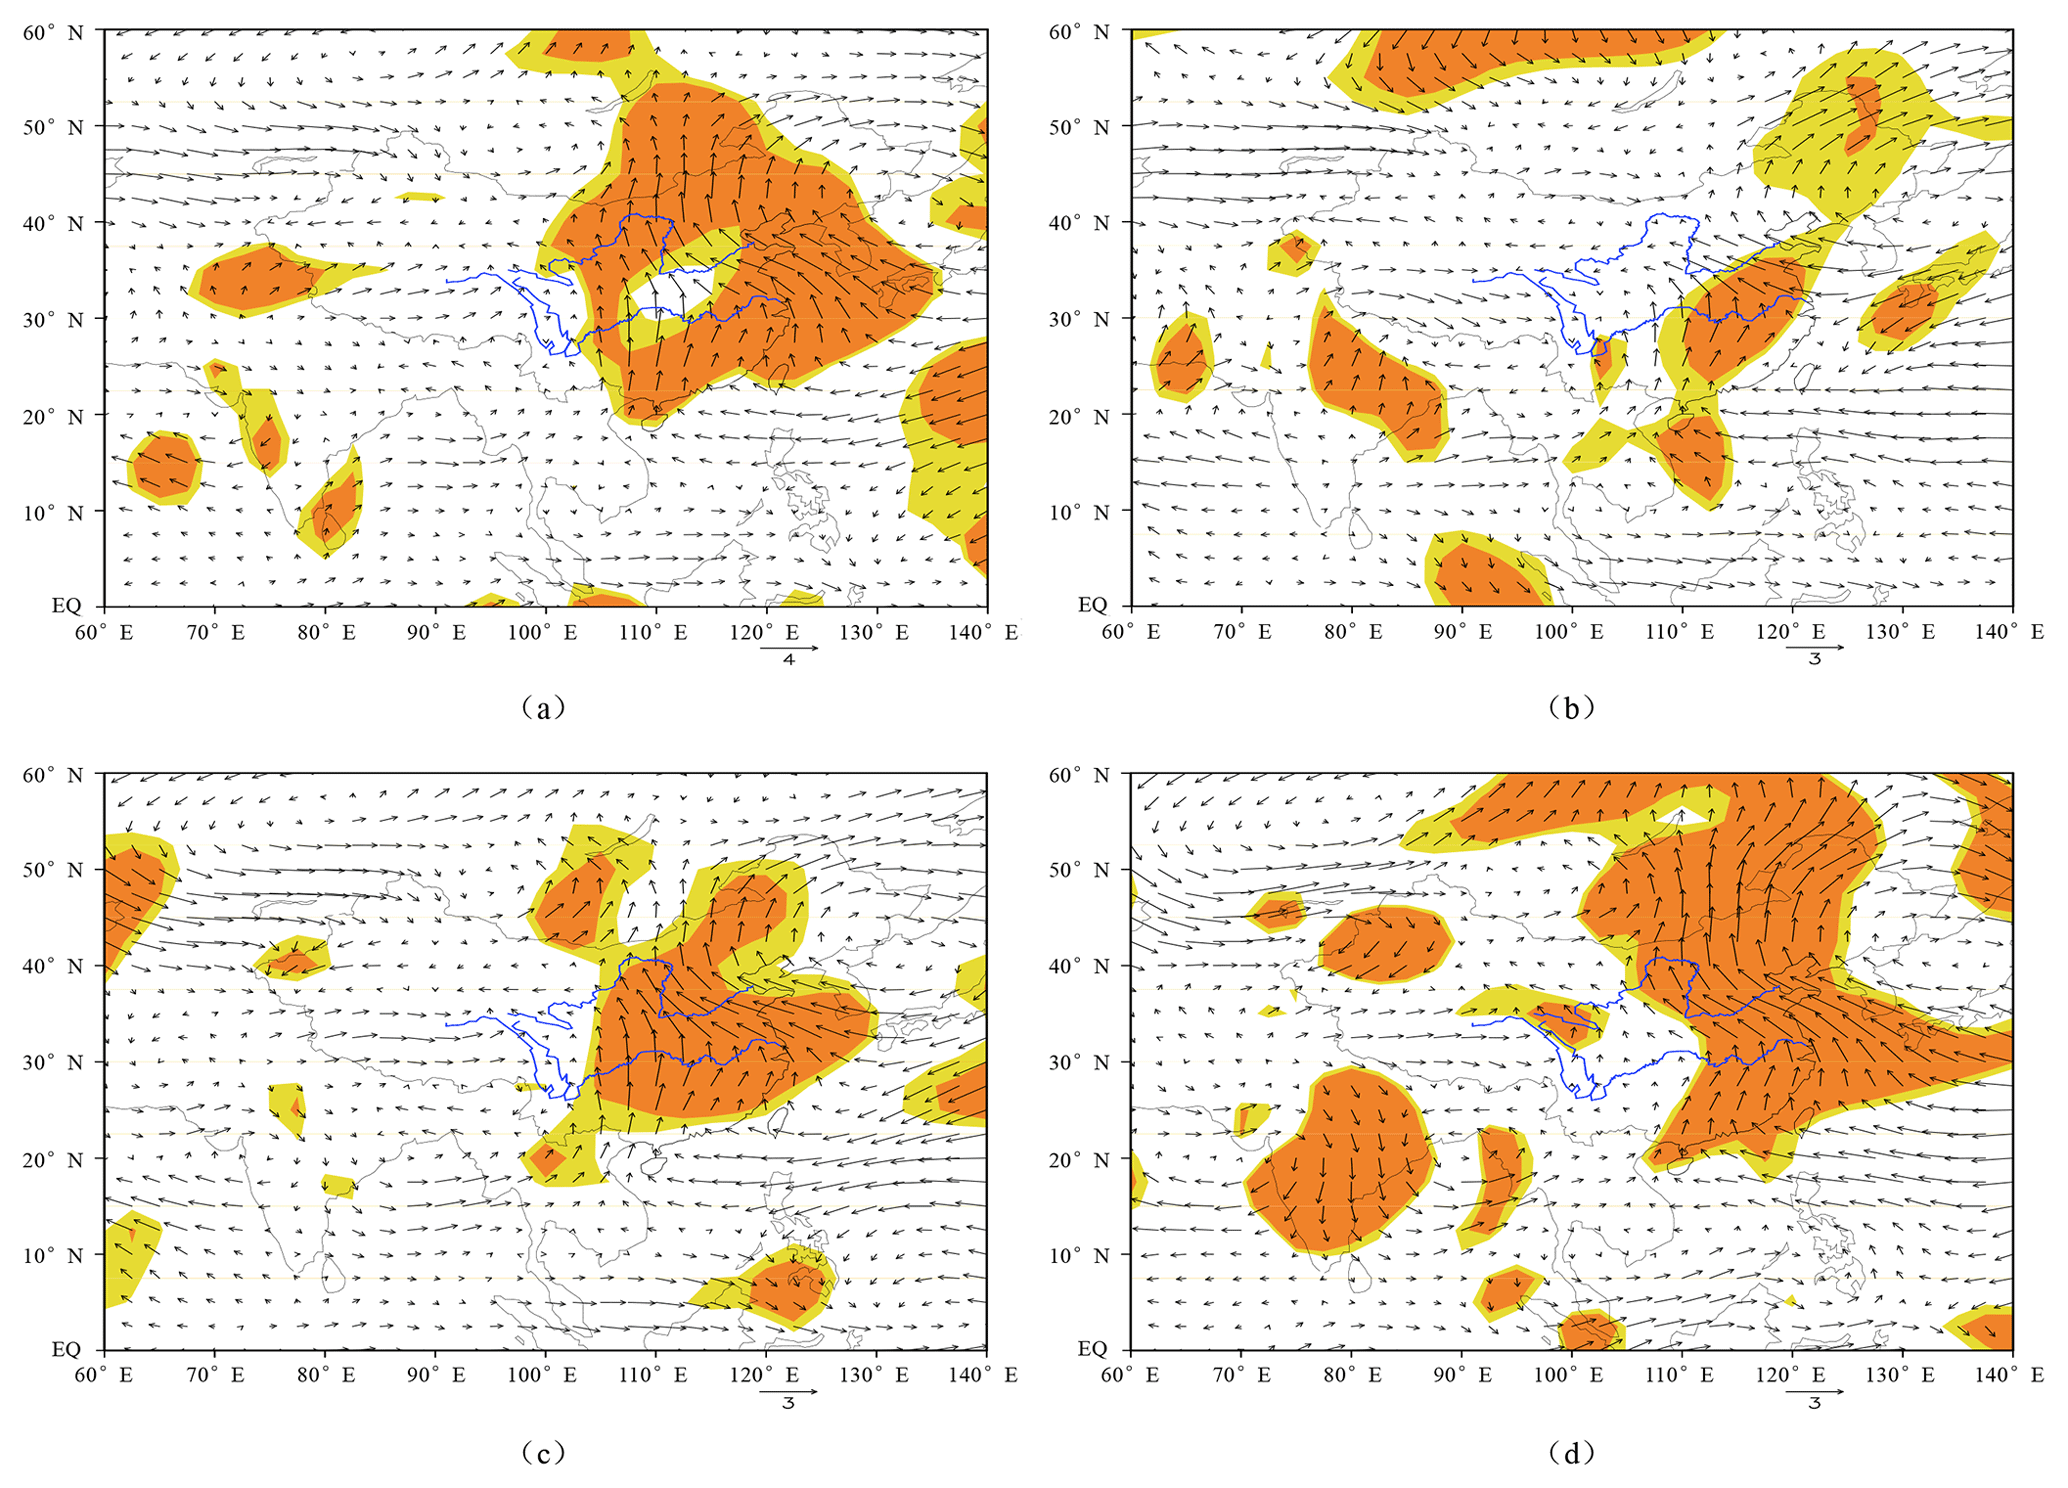
Figure 3The differences between the wind anomaly fields at 850 hPa for the years with extremely excessive precipitation and those for the years with extremely deficient precipitation in spring (a), summer (b), autumn (c) and winter (d). (The yellow and orange parts respectively indicated the area passing the significance test at 0.1 and 0.05 levels.)
Figure 4The correlation between precipitation in spring (a), summer (b), autumn (c) and winter (d) in the Yellow River Basin and the corresponding SST. (The shadow indicated the area passing the significance test at 0.1 level.)
The correlation analysis between seasonal precipitation in the Yellow River Basin and the corresponding SST (see Fig. 4) showed that spring precipitation was positively correlated with SST over the equatorial central eastern Pacific Ocean, while summer, autumn and winter precipitation were negatively correlated. Moreover, the correlation in spring, summer and autumn was stronger than that in winter. The region with high correlation in each season was uniformly located in the eastern Pacific, where was exactly similar to the NINO3 district (150–90∘ W, 5∘ S–5∘ N). In consideration of this factor, the NINO3 index (the regional average of the SST anomaly in NINO3 district) was adopted to discuss the influence of El Niño and La Niña on seasonal precipitation in the Yellow River Basin.
The El Niño (La Niña) phenomenon was characterized by high (low) value of NINO3 index above 0.5∘ (below −0.5∘). Based on this criterion, the years for each season under the conditions of El Niño and La Niña were selected. Furthermore, the average precipitation anomaly percentage for each season under the two conditions were respectively calculated (see Fig. 5). It was indicated that the spring precipitation was above (below) normal during the period of El Niño (La Niña) , while the summer, autumn and winter precipitation presented the opposite characteristics. The average NINO3 indices for each season when the corresponding precipitation was significantly above (below) normal were calculated. The results showed that the average NINO3 indices in spring, summer, autumn and winter were respectively 0.38, −0.47, −0.42 and −0.63∘ (−0.28, 0.6, 0.4, −0.08∘) when the corresponding precipitation was significantly above (below) normal. Thus it could be seen that the relationship between precipitation in spring, summer and autumn and SST in NINO3 district was consistent with what was illustrated in Fig. 4, while precipitation in winter was more closely related to El Niño than to La Niña, further indicating that the correlation between winter precipitation and SST in NINO3 district was relatively weaker.
On the whole, the spring precipitation was increased (decreased) during the period of El Niño (La Niña) , while the summer, autumn and winter precipitation was decreased (increased) during the period of El Niño (La Niña).
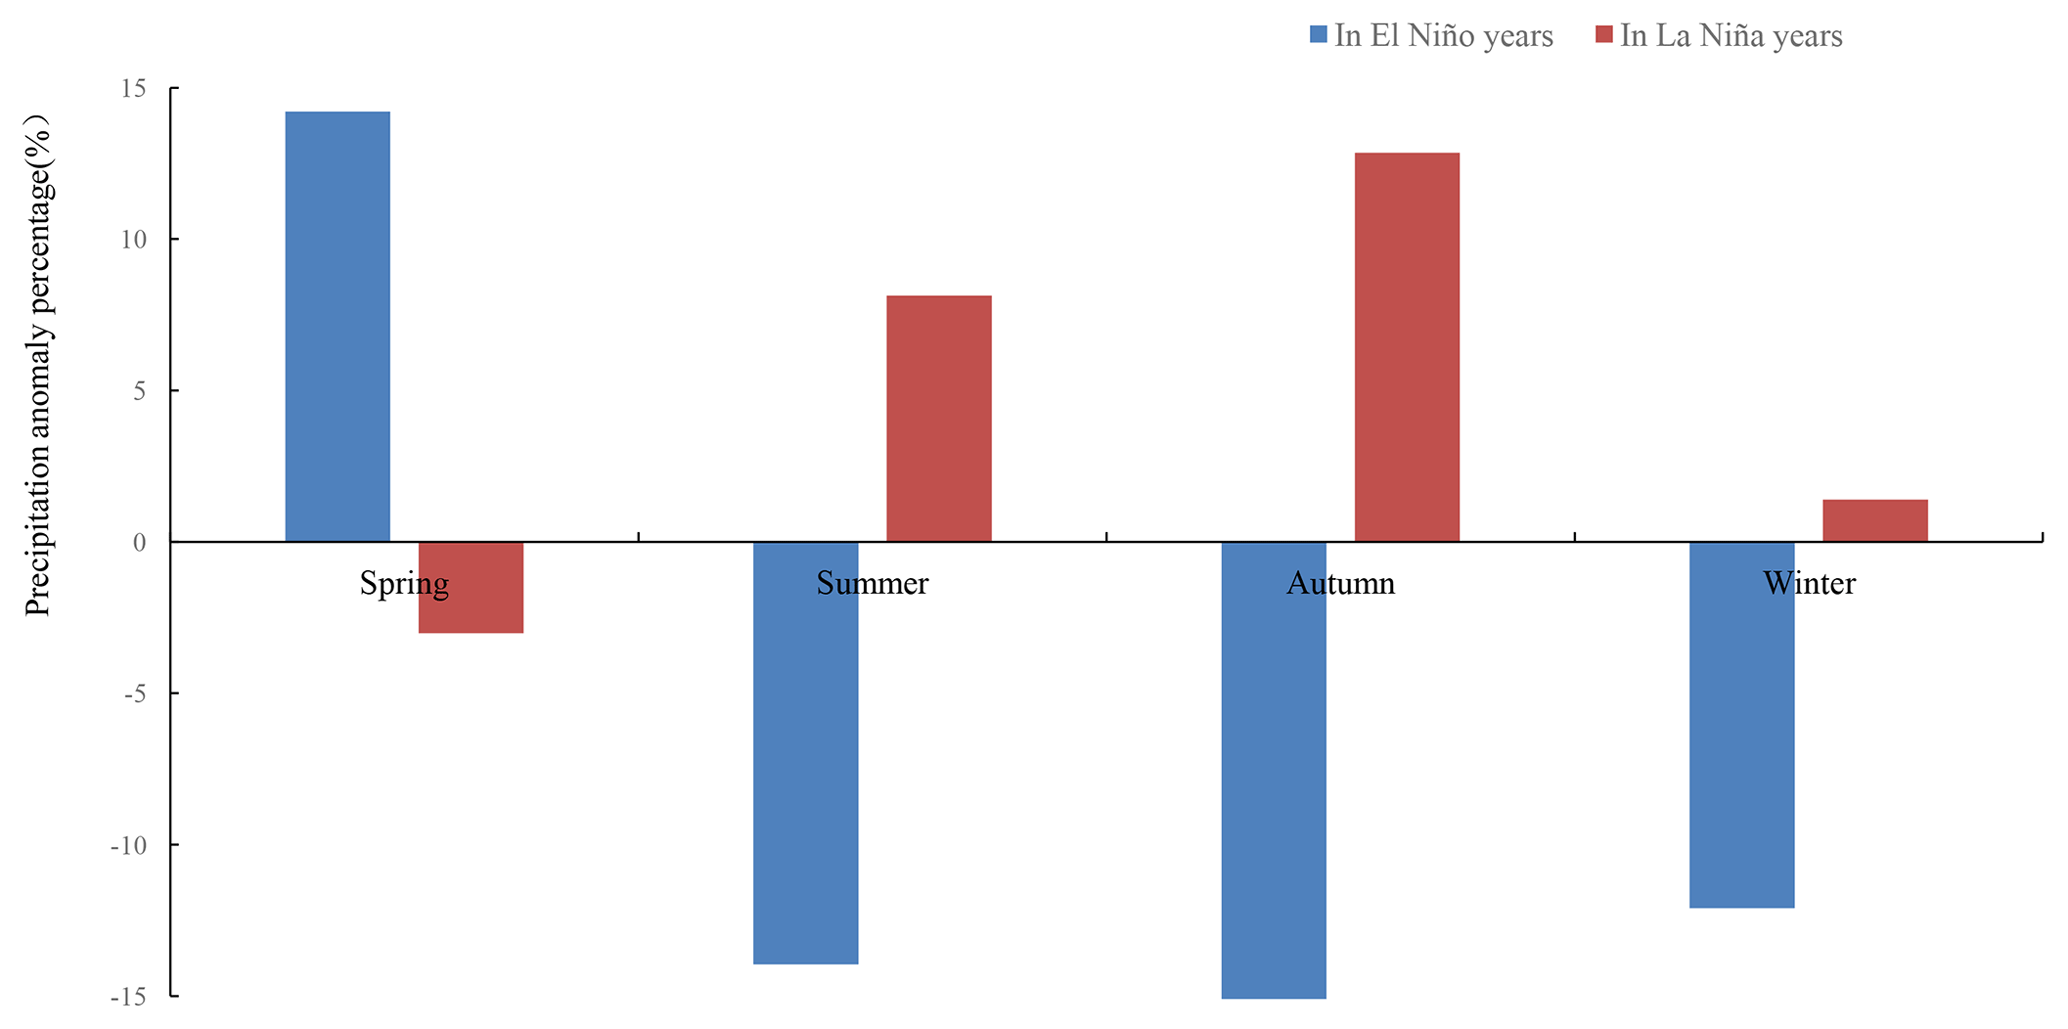
Figure 5The average precipitation anomaly percentage for each season under the conditions of El Niño and La Niña in the Yellow River Basin.
The change tendency as well as the inter-annual and inter-decadal variations of the spring, summer, autumn and winter precipitation in the Yellow River Basin were analyzed. On the basis, the circulation characteristics for the periods when the seasonal precipitation was abnormal were discussed and the results were as follows.
-
Variation trends of the precipitation in spring, summer, autumn, and winter of the Yellow River Basin were respectively −1.9, −1.6, −2.2 and 0.3 mm per 10 years, which all failed the test of significance.
-
The inter-annual and inter-decadal fluctuations of the precipitation of each season were evident. The fluctuation in winter was the most obvious, followed by that in spring and autumn, with that in summer most stable. In terms of the inter-decadal variation, precipitation in spring, summer, autumn, and winter reached the largest in respectively 1990s, 1970s, 2010–2017 and 2000s, while recorded the smallest in respectively 1970s, 1990s, 1990s and 1990s.
-
When the precipitation in spring, autumn and winter was significantly above (below) normal, the 500 hPa height anomaly field over Eurasia mid-high latitude of the corresponding period presented “positive (negative) in east and negative (positive) in west”. While, when the precipitation in summer was significantly above (below) normal, the height anomaly field presented “+ (−), − (+),+ (−)”, and the West Pacific subtropical high was stronger(weaker) and lying more northward (southward). Additionally, when the precipitation in each season was significantly above (below) normal, the 850 hPa wind anomalies showed abnormal southerly (northerly) winds in Eastern China, which was favorable (unfavorable) to transport water vapor from the South China Sea and the Western North Pacific to the Yellow River Basin.
-
The spring precipitation was above (below) normal during the period of El Niño (La Niña) , while the summer, autumn and winter precipitation was below (above) normal during the period of El Niño (La Niña).
The precipitation data is not publicly available due to research institution policy. The reanalysis data of geopotential height and wind fields was from the U.S National Center for Environmental Prediction and National Center for Atmospheric Research at: https://psl.noaa.gov/data/gridded/data.ncep.reanalysis.pressure.html (last access: 8 August 2020). The SST data was from the Met Office Hadley Centre for Climate Prediction and Research at: https://www.metoffice.gov.uk/hadobs/hadisst/ (last access: 8 August 2020).
JL developed the main idea and wrote the manuscripts. LJ and LZ collected and analyzed the data. CH participated in the translating of parts of the paper.
The authors declare that they have no conflict of interest.
This article is part of the special issue “Hydrological processes and water security in a changing world”. It is a result of the 8th Global FRIEND–Water Conference: Hydrological Processes and Water Security in a Changing World, Beijing, China, 6–9 November 2018.
Chang, J., Wang, Y. G., and Zhao, Y.: Impact of variation of sea surface temperature in Nino3 district on summer precipitation over Yellow River Basin, Meteorol. Monthly, 39, 1133–1138, 2013.
Chang, J., Wang, Y. G., Zhao, Y., and Li, F. X.: Characteristics of climate change of precipitation and rain days in the Yellow River Basin during recent 50 years, Plateau Meteorology, 33, 43–54, 2014.
Chen, L., Wang, Y. M., Chang, J. X., and Wei, J.: Application of weighted Markow Chain in forecasting rainfall in Jinan City, Yellow River, 38, 8–12, 2016.
Gong, D. Y. and Wang, S. W.: Impact of ENSO on the seasonal rainfall in China, Journal of Natural Disasters, 7, 44–52, 1998.
Hao, L. S., Ding, Y. H., and Min, J. Z.: Relationship between summer monsoon changes in East Asia and abnormal summer rainfall in North China, Plateau Meteorology, 35, 1280–1289, 2016.
Lan, Y. C., Lin, S., Wen, J., and Chang, J. J.: Studies on atmospheric circulation anomaly of flood period and prefreshet period in the highest and the lowest flow years in the upper reach of Yellow River, Plateau Meteorology, 26, 1652–1658, 2007.
Rayner, N. A., Parker, D. E., Horton, E. B., Folland, C. K., Alexander, L. V., Rowell, D. P., Kent, E. C., and Kaplan, A.: Global analyses of sea surface temperature, sea ice, and night marine air temperature since the late nineteenth century, J. Geophys. Res., 108, 4407, https://doi.org/10.1029/2002JD002670, 2003.
Shao, P. C., Li, D. L., and Wang, C. X.: Spatial and temporal changes of summer rain in the Yellow River Basin and its relation to the East Asia subtropical westerly jet in last 50 years, Plateau Meteorology, 34, 347–356, 2015.
Song, W. L., Gu, W., Liu, Y. J., and Liu, C. Z.: Characteristics of anomalous sign and prediction of summer precipitation in the middle reaches of Yellow River, Meteorological Monthly, 39, 1204–1209, 2013.
Wang, N., Li, D. L., and Z, J.: Variations and circulation pattern of drought and flood in summer at middle and upper reaches of Yellow River, Arid Land Geography, 35, 754–763, 2012.
Wei, F. Y.: Statistical diagnosis and prediction technology of modern climate, Meteorological, China, 1999.
Xu, W., Cheng, M. J., and Song, W. W.: A review of studies on the influence of ENSO events on the climate in China, Scientia Meteorologica Sinica, 25, 212–220, 2005.
Xu, Z. X. and Zhang, N.: Long-term trend of precipitation in the Yellow River basin during the past 50 years, Geogr. Res., 25, 27–34, 2006.
Yao, W. Y. and Wu, D.: Characteristics and variation trends of temperature and precipitation in the Yellow River Basin during 1961–2010, China Rural Water and Hydropower, 8, 104–109, 2014.
Zhang, S. Q.: Characteristics of changes of summer drought and flood and impact of climatic physical factors on these changes in the Yellow River valley, J. Meteorol. Environ., 27, 40–44, 2011.
Zhao, P. P., Lv, H. S., and Wang, C. Y.: Impact of ENSO event on meteorological drought and hyrological drought in Weihe River Basin, Water Resources and Power, 36, 9–13, 2018.
Zhu, Q. L., Zhang, L. Z., Yu, G. R., Dai, D., Cai, F., and Liu, X. A.: The spatial and temporal variability characteristics of precipitation in the Yellow River Basin of recent 30 years, J. Natural Resour., 20, 477–482, 2005.
- Abstract
- Introduction
- Data and methods
- Variation characteristics of seasonal precipitation in the Yellow River Basin
- Atmospheric circulation characteristics for the years with abnormal seasonal precipitation in the Yellow River Basin
- Effects of El Niño and La Niña on seasonal precipitation in the Yellow River Basin
- Conclusion
- Data availability
- Author contributions
- Competing interests
- Special issue statement
- References