the Creative Commons Attribution 4.0 License.
the Creative Commons Attribution 4.0 License.
 | 16 Sep 2020
Climatic variability in the Sine-Saloum basin and its impacts on water resources: case of the Sob and Diohine watersheds in the region of Niakhar
Waly Faye
Awa Niang Fall
Frédéric Do
Olivier Roupsard
Alioune Kane
Local peoples from Niakhar in the Senegalese peanut basin highlight a dramatic increase of water access problems due to marked rainfall deficits and salinization of surface and ground water resources. The chemical quality of groundwaters is often critical because of the salinization process, whereas water surfaces, which should be used in such situations, are up early. More and more, lowlands and rivers beds are pervaded by salt crusts. Then the salinization of wells is increasing, leading to the extension of tans (salty of acidified soils). To study the impacts of climatic pejoration on the agroecosystems and on the living conditions of the populations, we carried out the analysis of the time series of the precipitations with daily and annual time steps from 1950 to 2015 on 6 meteorological stations, in situ measurements on 78 wells for an area of 311 km2, as well as local population interviews and field observation. The results confirm an important climatic break in the region in 1970. The long dry period, from 1970 to 2009, has increased the annual rain variability, decreased the number of rainy days per year. We confirm a real and large extension of well salinization, and salt crusting in the lowlands and the riverbeds. From the local people, it seems the process of degradation of the aquifers continues to progress from a large tidal event in 1984. The rainfall increase noted in the last decade does not seem to be enough to reverse the trend and to ensure both the rise of the piezometric level of the aquifers and the desalinization of surface and ground waters.
- Article
(1729 KB) - Full-text XML
-
Supplement
(57 KB) - BibTeX
- EndNote


Agricultural production, river discharge and groundwater productivity are related to the abundance and the regularity of rainfalls, mainly under semi-arid zones. In the Sahel, the environmental sustainability is very fragile, the rainfall is the most immediate climatic element for water harvesting to meet the natural needs from the ecosystems and for human demands. The drastic rainfall deficit that was almost continuous in the Sahel from 1968 to the end of the 1980s (Servat et al, 1999) led to a depletion of the surface waters of the Sudano-Sahelian zone (Descroix et al., 2009). The severity of the rainfall deficit has brought the Senegal river to its lowest level in 1984–1985 (Gac et Kane, 1986; Orange, 1992). In the Sine-Saloum basin, the rainfall deficit from 1971 to 2000 is more than 300 mm compared to the period 1941 to 1970, as a reduction of the annual rainfall of more than 30 % in the estuarine part and 15 % in the upper basin (DGPRE, 2014). In this region, this altered climate condition has led to a decrease of river flows, a drop of groundwater table, a drying up of the wells, a desiccation of the pools which are very important for the breeders, a significant degradation of the abiotic environment in particular with the salinization of soils, waters and wells, and by a considerable degradation of the vegetation cover (Sagna et al., 2015).
But in despite the drought, the population density has largely increased, and the region still continues to be an important agricultural production area for Senegal. The density which was 100 inhabitants km−2 in the years 1960–1970 (Lericollais, 1970) rose to more than 200 inhabitants km−2 in the years 2010 (Delaunay et al., 2009), increasing the pressure on the natural resources. This recent demographic increase is more accentuated by the fact that the region of Sine-Saloum (Fatick and Kaolack) was already the most populated region of Senegal until the 1980s, combining a very large rural population and the densest urban network after Dakar (Becker et al., 1987). According to Pontié et al. (1999), the analysis of the land management methods takes a particular relief in Sine, because of the high density of population, which entails as a corollary an exploitation of all the lands and a strong land pressure.
To understand why this environment is particularly resilient, we have focused our research on two small agricultural watersheds in the Sine-Saloum basin, with the villages of Sob and Diohine. These two villages are in the center of the region studied by IRD and its partners for the Niakhar Population, Health and Environment Observatory (OPSE) in the administrative region of Fatick (Delaunay et al., 2009). Already Lericolais (1989) indicated that the water level of the central well of Sob which was at 14 m depth in 1989, was at 6 m depth in 1965. Moreover, this well is no longer used since 1989 due to its high salt content. Then the local population is convinced that the impact of the pluviometric decrease on water resources is reflected not only in a continuous decline of piezometric levels but with an important salinization process.
This study aims to provide a first understanding of the impact of the long recent drought on the rainfall variability, and secondly its consequences on the groundwater quality, highlighted through the local population perception on the water demand stress of the populations of Sob and Diohine watersheds. We propose to analyze the long serial rainfall records on 6 stations to characterize the effective climatic evolution in this part of the agricultural region of the Senegalese peanut basin. Then, because there is no hydrological data, we will discuss the impact on the water resources through the actual salinity measurements and interviews of local people.
Sob and Diohine are two studied villages of the Niakhar Population, Health and Environmental Observatory (OPSE) implemented by the Research Institute for Development (IRD) and its partners in Senegal since the 1960s. For this purpose, we have described two watersheds centered on these two villages respectively. The both watersheds are oriented NNE-SSW and the respective areas are 115 and 96 km2 (Fig. 1). Their outlets, chosen at the national road RN1 on the left and right of the village of Diouroup, are about 7 km from the entrance to the Sine-Saloum estuar. The topography of the region is relatively flat, with just some circle lowlands, the elevation does not exceed 20 m, and the Sob watershed is the highest. The climatic zone is sudanian, reputed with an annual rainfall of 600 mm. The soils consist mainly of Dior soil, the most widespread, Deck and Deck-Dior soils, with Tann soil often in the lowlands. The Dior soil has a coarse sandy texture to sandy-silty with less than 40 % clay in the first 40 cm; Deck soil corresponds to soil with sandy-silty to silty-sandy texture on the surface and more clayey at the bottom; Deck-Dior soil is with a texture very sandy-silty (with more than 15 % of clay) to silty; and Tann soil is salted or acidified soils entirely non-fertile. The structure of the deep horizon is massive with however a polyhedral substructure. The main activities of the population are agriculture, breeding, small gardening market, and more and more cattle fattening.
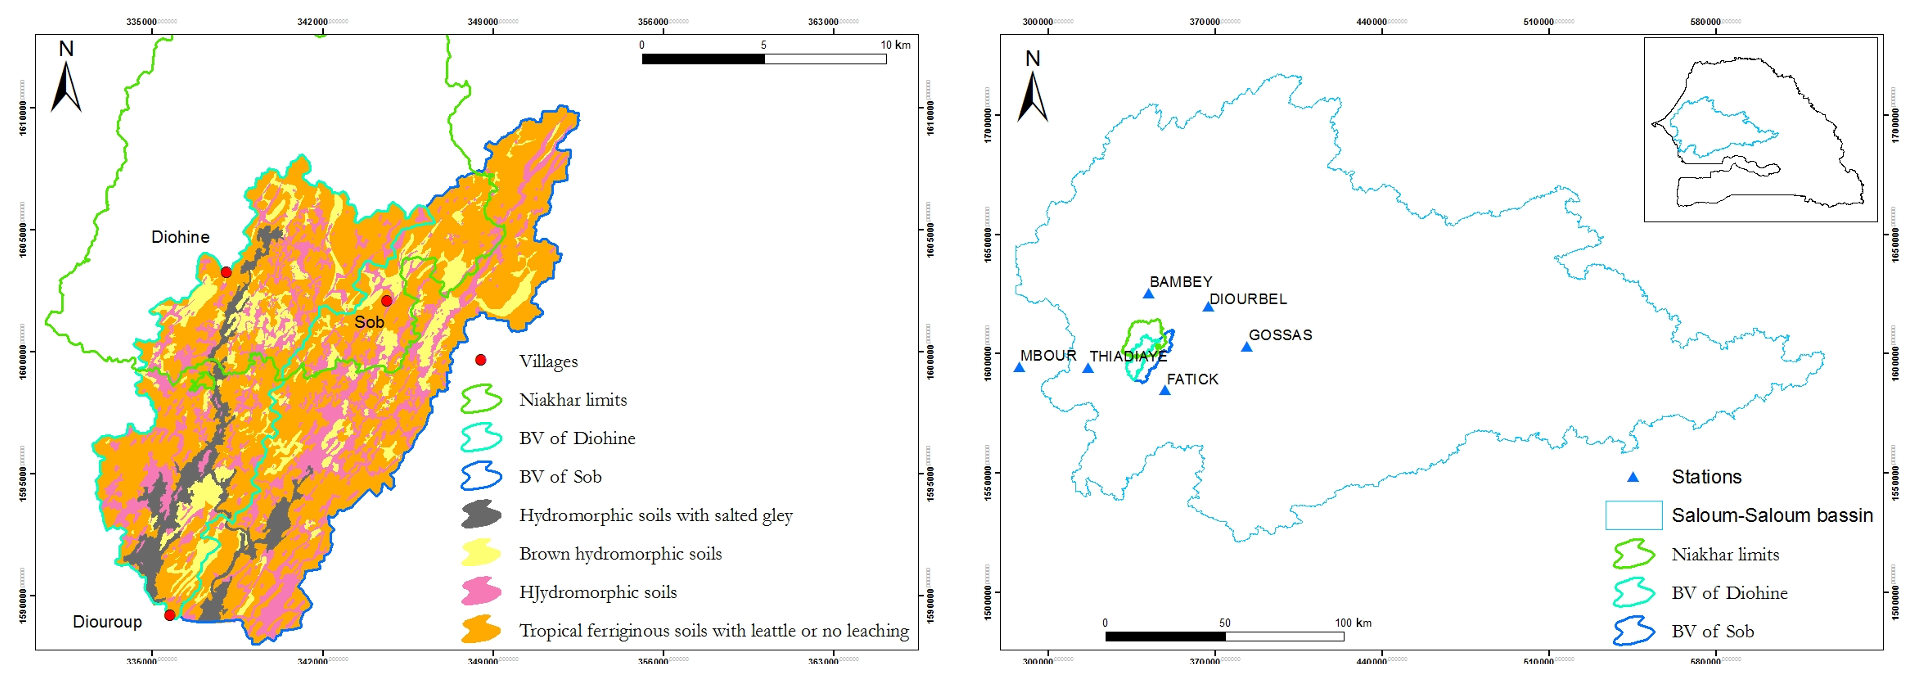
Figure 1Location of the Sob and Diohine watersheds in the Niakhar Population Health and Environment Observatory (OPSE), and location of the 6 studied rainfall stations.
3.1 Data used in the study
To investigate the rainfall pattern and climate variability in the watersheds of Sob and Diohine, two types of data were used. The first data base concerns the range of monthly rainfall data from 1950 to 2015 for 6 stations Fatick, Diourbel, Gossas, Bambey, Thiadiaye and Mbour. The daily rainfall concerned only Fatick, Diourbel, Bambey and Gossas stations. The choice of these stations whose data are provided by the National Agency of Civil Aviation and Meteorology (ANACIM), is focus on the quality of data (continuous and homogeneous) and proximity to the two studied basins.
The second database is dealing with in situ water quality measurements done in June 2018 on a sample of 78 wells equally distributed on Sob and Diohine watersheds. On each well, the static level (NS), the pH, the Conductivity and the Salinity were measured in situ and a GPS survey carried out systematically for the spatialization of the data. The NS of a well or borehole is the depth to water from the ground to the surface of the water before pumping. Conductivity, pH and salinity were measured in situ by the following equipment respectively: LAQUAtwin conductivity EC-22 measured in mS, LAQUAtwin-pH-22 pH meter and LAQUAtwin-Salt-22 salt-meter measured in percent. All these measurements are associated with field observations through an exploration of the two basins up to the outlet and interviews with rural populations to collect primary data on their perceptions on the trends and variability of rainfall and water resources of the area.
3.2 Method implemented
3.2.1 Standardized Precipitation Index (SPI)
SPI index is used to examine the nature of the trends and enables the determination of the dry and wet years in the record (Hadgu, 2013). Standardized precipitation is defined as the difference in precipitation from the mean for a specified period divided by the standard deviation. This index has the advantage of being able to determine the water deficit at both the scale of the seasons and the year (Elbouqdaoui et al., 2006). It is given by the following formula:
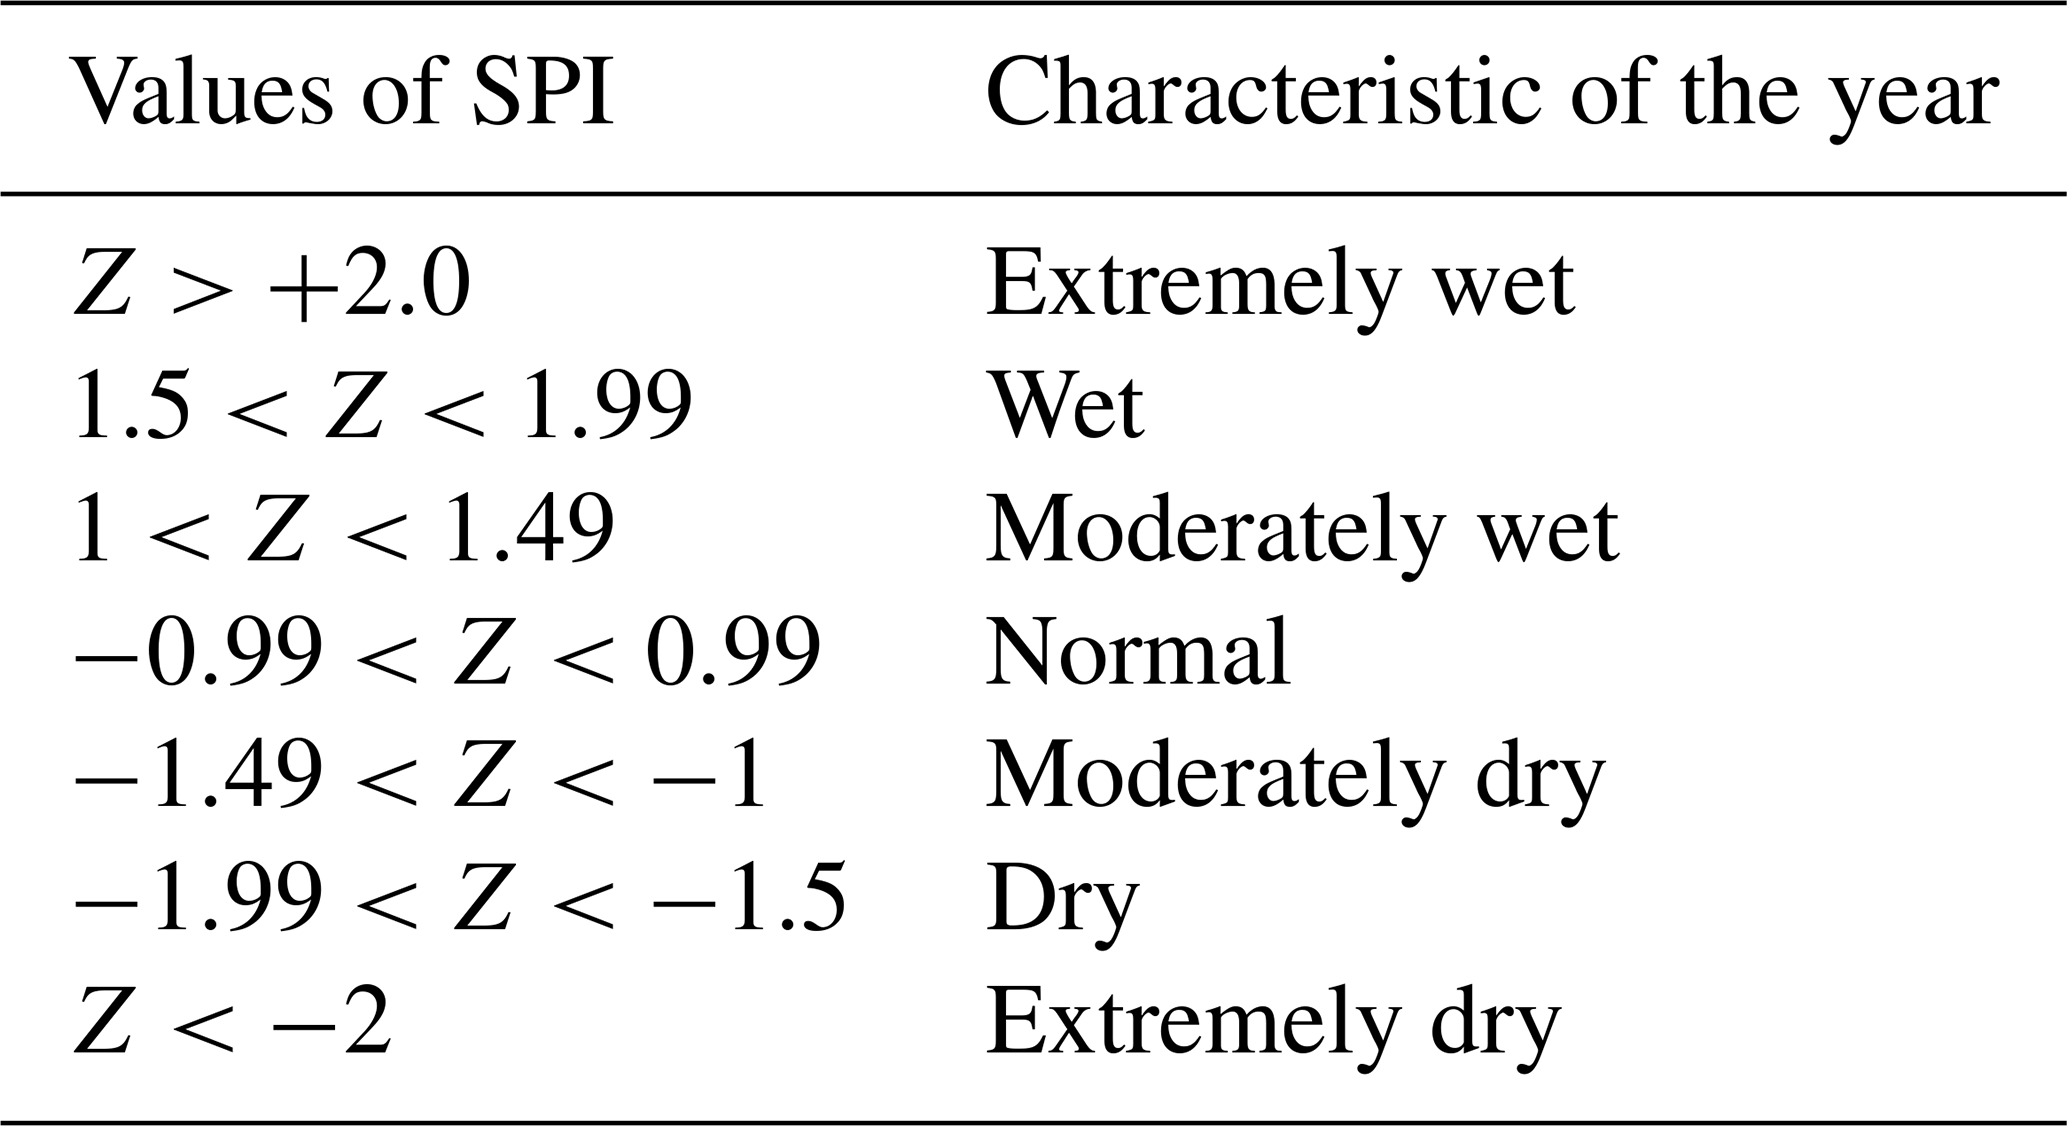
Where Pi is the rainfall totals of a given year, the mean of the range, σ is the standard deviation of annual precipitation of the observed period. This index measures meteorological drought and is negative for droughts and positive for wet conditions. The intervals of the index values for identifying rainfall anomalies are indicated in Table 1 (Elbouqdaoui et al., 2006; Shah et al., 2015).
Table 1The intervals of the SPI index values for identifying rainfall anomalies (from Shah et al., 2015).
3.2.2 Coefficient of variation
The annual coefficient of variation (CV) is calculated to assess the variability of each year. The annual coefficient of variation allows the comparison between weakly or abundantly watered stations. CV is the ratio between annual standard deviation σ and annual mean rainfall .
The CV is used to classify the degree of variability of rainfall events as less (CV <20), moderate (20< CV <30) and high (CV >30) according to Asfaw et al. (2018).
4.1 A rainfall break in 1970
The rainfall evolution at the studied stations highlights the rainfall anomaly that has been observed in the region since the rainfall break in 1970. For all the stations, the meteorological drought is persistent and the rainfall pattern from 1950 to nowadays is very similar for each one (Table 2, Fig. 2). Just few humid years occurred at Fatick and Mbour since 2009. However, we could not say anything for Gossas and Thiadiaye since the serial data ended before 2009 for these two stations.
Table 2Rainfall anomalies for the studied stations from 1950 to 2009 for Gossas, from 1950 to 2011 for Thiadiaye, and from 1950 to 2016 for Bambey, Fatick, Diourbel and Mbour.
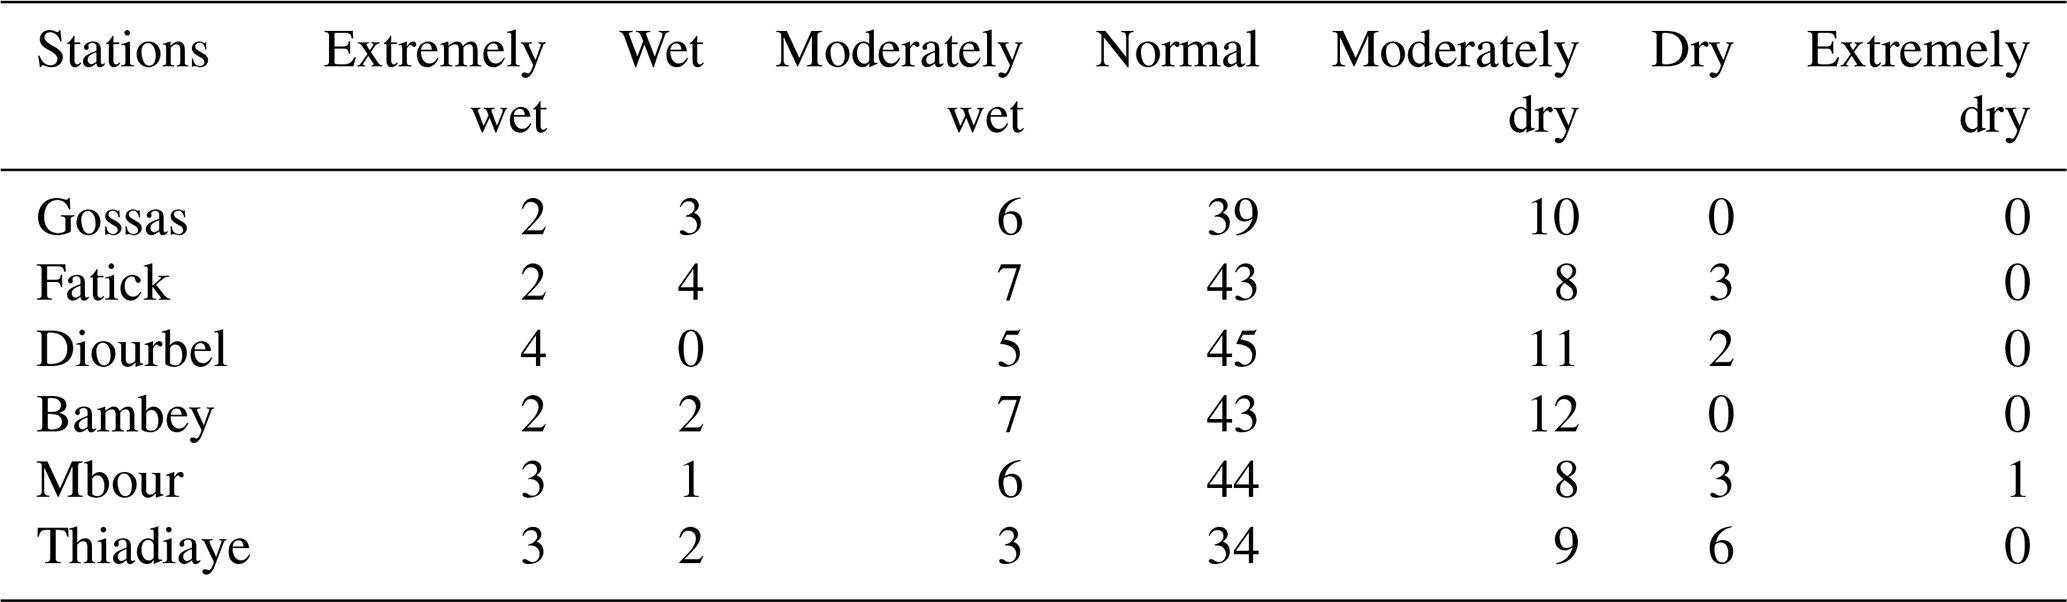

Figure 2Standard precipitation index (SPI) of the 6 studied rainfall stations, from 1950 to 2009 for Gossas, from 1950 to 2011 for Thiadiaye, and from 1950 to 2016 for Bambey, Fatick, Diourbel and Mbour.
The intervals of the SPI index values allow to identify rainfall anomalies, that is finely very similar for the six stations. At last, the serial data shows a resumption of rainfall over the last decade but with rainfall that is still far from normal. To conclude, we identify two homogeneous rain periods: one wet period until 1969, and one dry period from 1970 until 2008. More data are needed to qualify the recent period from 2009, which seems wetter than previously.
4.2 Increase of annual variability and reduction of rainy days per year
The evolution of the annual coefficient of variation for all the studied stations shows a strong variability of the average annual rainfall, mainly during the last dry homogenous period (Table 3): less it rains, more it is yearly variable. Indeed, the variability is more pronounced over the 1970–2009 sequence, as shown in Fig. 3. The wettest period, 1950–1969, generally has the lowest coefficients of variation, whereas the period 1970–2009 shows high coefficients of variation. The period 1970–2009 in addition to be the dry sequence is very variable, which demonstrates particularly drastic climatic conditions that characterized this period.
Table 3Evolution of the coefficient of variation of the 6 studied rainfall stations for the two homogeneous climatic period of 1950–1969 and 1970–2009 (the geographical location is qualified by North, South, East and West, related to the 2 studied watersheds of Sob and Diohine; example: Gossa station with EE-N is at the extreme East and the North of the studied watershed).
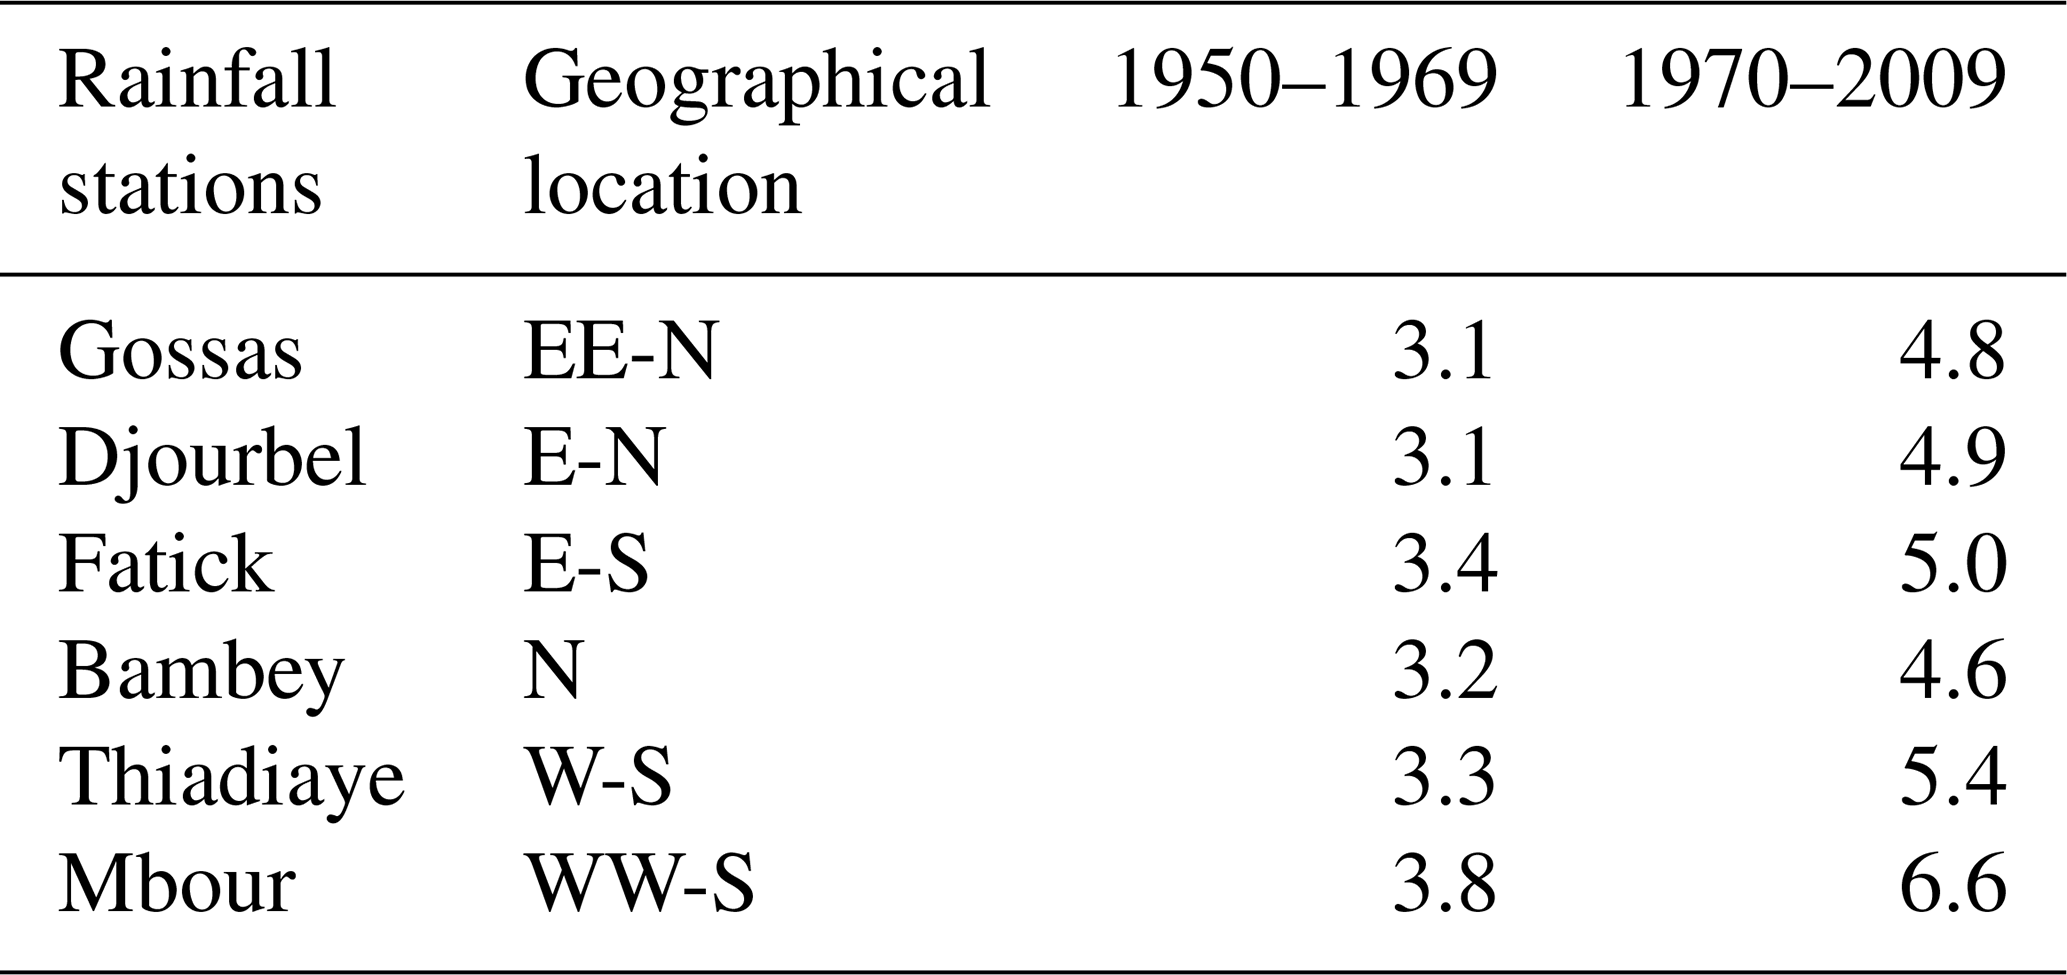
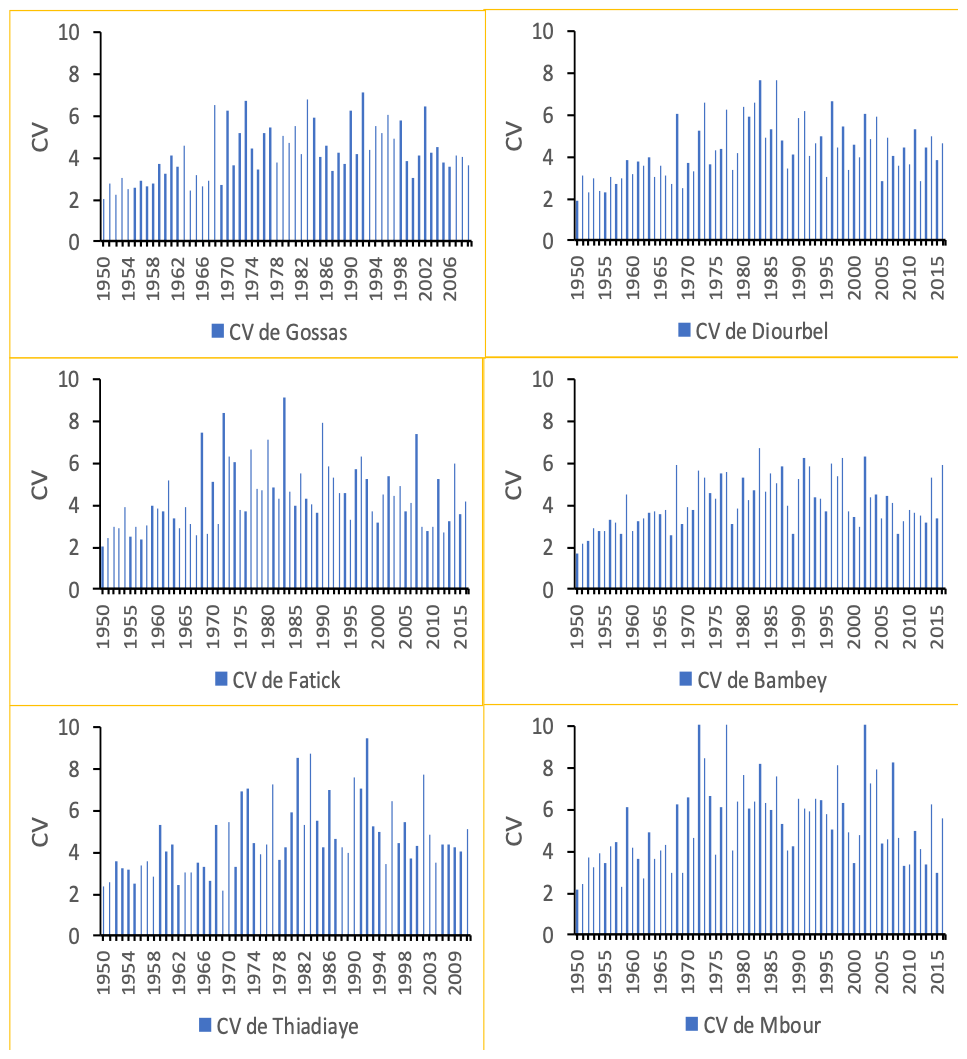
Figure 3Evolution of the coefficient of variation for the 6 studied rainfall stations, from 1950 to 2009 for Gossas, from 1950 to 2011 for Thiadiaye, and from 1950 to 2016 for Bambey, Fatick, Diourbel and Mbour.
Moreover, this variability increases along an east-west positive gradient, and a smoothly positive gradient from the North to the South. In resume, more the station is at the West (near the coast such as Mbour) and more in the South, more the annual variability is important (Table 2).
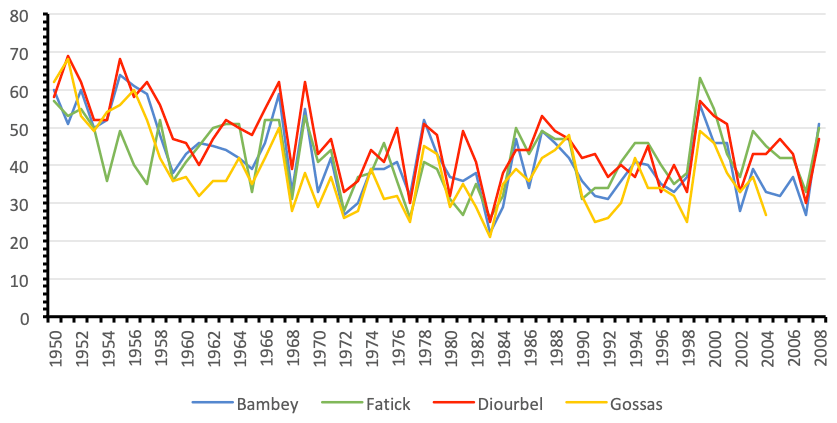
Figure 4The evolution of the number of rainy days per year at Gossas, Fatick, Bambey and Diourbel stations from 1950 to 2008.
Moreover the annual variability, the number of rainy days per year has also changed between the two homogeneous climatic periods. From 1950 to 1968, the number of rainy days has constantly decreased during the whole dry period until a certain threshold relatively constant from 1970 to 2009 (Fig. 4). Gossas has the lowest average number of rainy days with 34 d yr−1, and Diourbel has the highest average with 43 d yr−1, while Fatick and Bambey have respectively an average of 43 and 38 d yr−1. This can have dramatic consequences on agricultural crop cycles and on the water quality of rivers and groundwater recharge.
4.3 Rainfall amount per period and geographical trend
The first important result of the local evolution of this long serial rainfall data leads to affirm that in the region we should consider at least two homogeneous climatic period with a break in 1970. For the recent period, our data until 2016 seems to announce on a new positive break which could be in 2009. Then we could consider a wet period from 1950 to 1969 and a dry period from 1970 to 2009 (Fig. 5). However a need of at least 6 years more of rainfall records is requested to be sure to conclude on that issue.
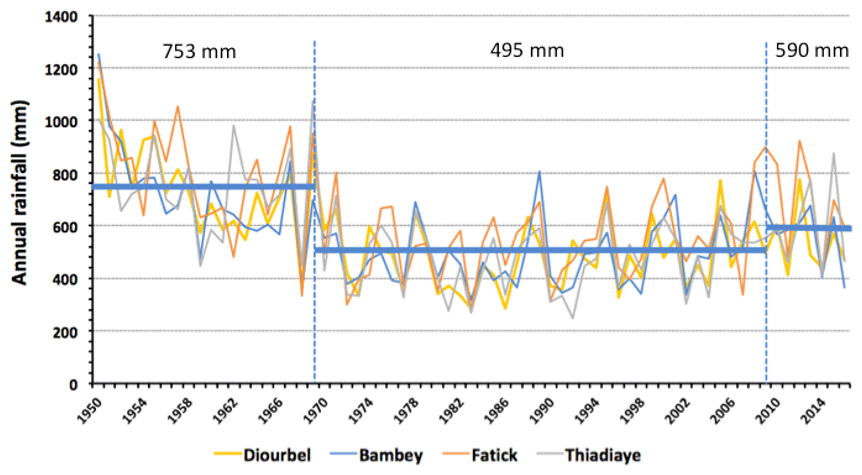
Figure 5Evolution of the annual rainfall of the 4 climatic stations around the Diohine and Sob watersheds (from the East to West: Diourbel and Bambey in the North, Fatick and Thiadiaye in the South) to identify three homogeneous climatic period (1950–1969, 1970–2009 and 2010–2016), with the mean annual rainfall (in mm) for each considered period.
Due to the small geographical trend from East to West and from North to South, we can consider the mathematical average of the 4 nearest rainfall stations from the OPSE (Diourbel, Bambey, Fatick and Thiadiaye) to estimate the average annual rainfall amount occurring on this area, since our studied area is well-centered between these 4 rainfall stations (Fig. 1).
Then the annual rainfall amount has changed in average from 753 to 495 mm yr−1, which represents a drastic loss of rainfall water by 34 %. From 2010, the annual rainfall in the region would be better with an average around 590 mm yr−1. But more than 10 years of measurements will be needed to confirm.
4.4 Drought impact on the quality of groundwater resources
Salinization has become a major constraint in the sylvopastoral area of Niakhar. And it concerns both water resources and soils. In situ measurements, observations and interviews with the rural populations allow to tackle the extent of the groundwater degradation in Sob and Diohine watersheds.
The current situation is highlighted by the high rate of abandonment of wells in most villages. This water problem has led to the specialization of wells in terms of uses: some wells are reserved for the population, others for domestic use and livestock, and others for the brick building in banco. In addition, there is an early drying of some wells, or a drop in the static level of wells that can no longer meet the water needs of populations in the middle of the dry season. Our survey of the static level in 78 wells indicated an average of static level around 4 to 5 m depth (Fig. 6). The water level in the wells is less deep in the Diohine watershed than in the Sob watershed. Here, we have to notice that the elevation of Sob watershed is smoothly upper. Globally, it seems that the static level of the groundwater is following the topographic slope. However, in details, the highest static levels are out of the lowland areas.

Figure 6Distribution of static levels (NS) of wells in the Sob and Diohine watersheds.
The measurements of water salinity in the wells are not correlated to the static levels. The salt concentration ranges from 0 % to 3 % (Fig. 7). The highest salt concentrations have been measured in the Sob watershed at Yenguele II, a village near Niakhar with 3.1 %. However, we notice a high rate of abandonment of the wells in the two basins because of the aquifers' salinization so that the cattle no longer drink them. Wells, which have the softest waters, are in downstream of the two basins.
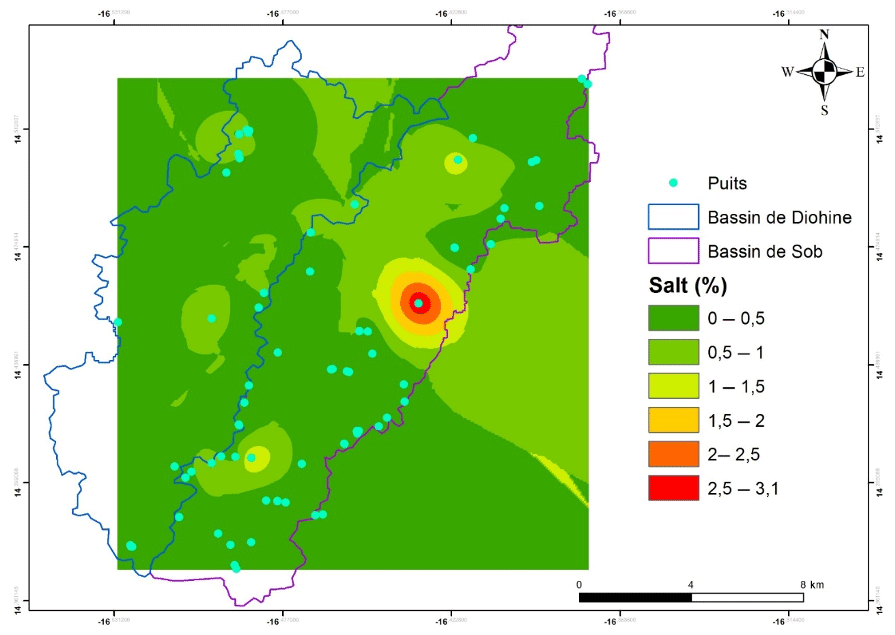
Figure 7Percentage of water salinity distribution in wells distributed in Sob and Diohine watersheds, one-shot measurements campaign in June 2018.
There are no old measurements on wells to determine some changes in groundwater quality. But in the opinion of the local people, it is a long time process, specially from 1984 within both climatic drought and big tidal events. From this date, the wells have begun to be salty until they are abandoned because even the animals do not drink the water anymore. Nowadays, many new constructed wells directly capture salt water and are immediately abandoned. In addition to this degradation of the aquifers, the local people underlined an early drying up of the lowlands, river beds and pools which nevertheless drain large volumes of water each year. Moreover, crystalline salt is exploited in the Diohine valley downstream to Diouroup in the dry season, while towards the outlet of the Sob Basin salt crusts on lowland soils were visible in June. This situation shows the intensity of lowlands salinization mainly in downstream of the both basins. And it should be noted that these places are far from the Yenguele II area where the saltiest well is measured.
The analysis of the standardized precipitation index (SPI) combined to the rain annual coefficient of variation and to the number of rainy days per year allow to conclude that in the whole studied area, the annual evolution of the rainfall is homogeneous on the studied period (1950–2016). We confirm a large and fundamental climatic break around 1969. Indeed, 1970 marked the beginning of a long dry period within the rainfall data series. This drought has increased the annual variability of the rainfall and decreased the number of rainy days per year. From 2010, it seems that the annual rainfall amount would have increased a little bit. But this positive trend should be confirmed in the next years.
The interviews of local people done in June 2018 within 100 persons, make us confirm that this long drought period has impacted the hydrological pattern in the region. The particularly random nature of the rainfall highlights the vulnerability of water resources in this area. In Sob and Diohine watersheds, the long and pronounced drought period and population growth have exacerbated the strong pressure on water resources and the salinization became one of the limiting factors for the water use. We hypothesize the pronounced groundwater recharge deficits and the increased of water use for agricultural development in the region have primed and accelerated the water salinization in wells and probably the lowering of the piezometric level. Nowadays, we don't have any old hydrological measurements to confirm this statement. From the local people, it seems the process of degradation of the aquifers continues to progress from a large tidal event of 1984. And the small increase of annual rainfall amount noted in the last decades does not seem to turn off. More and more, the recent dug wells capture salt water while the old wells are abandoned because of the strong salt water content. Many villages in these two basins now only have salty and brackish tablecloths for their domestic, pastoral and market garden uses. We noticed that the few wells that produce fresh water dry up because supply is far below demand. Our measurements showed also a non-uniform salt concentration between wells inside a same concession. The spatial variability is significant and seems to indicate several causes of the saline water pollution in the wells.
On the other hand, the long drought has also led to wind revitalization that has led to a silting up of the lowlands by the eolian dust and probably contributed to the salty pollution of soil surfaces. The salt crusts are also visible into the riverbeds and in the lowlands leading to hypothesize a saline pollution by hydraulic lift through capillary process. It is clear that the long drought enhanced also the evaporation process, facilitating the capillary process and the salt soil crusting. The current long dry period, from 1970 to 2009, brought many favorable factors for soil degradation largely linked to the salt dynamics. Indeed, the soil and water salinization are effective. But currently we don't have any clue to discuss about the origin of this salt and about the salinization process in the region.
Nowadays, people harvest salt in the Diohine valley before the outlet, which is very far from the estuary while salt crusts are visible in the Sob valley around Diouroup. This situation is indicative of the degradation of the hydrological conditions of the Sob and Diohine watersheds. The potential of the lowlands is strongly affected by evaporative salt concentrations in the dry season; it is a constraint for rice cultivation, which has disappeared due to soil salinization. In this context, it is essential to know the volumes of water flowing through these two rivers and to identify the origins of the salt deposited in the lowlands and its relationship with salinization of aquifers by future advanced studies.
Our study confirmed that the agricultural region of Senegalese peanut basin has been strongly marked by the climate break in 1970 in the rainfall distribution. The dry period is effective in the whole Niakhar region from 1970 to 2009, characterized by an increase of the annual rain variability and a decrease of the number of rainy days per year. Then the climatic water pressure on the water demand has been drastic. But unfortunately, there are no hydrological measurements and data in the region to evaluate the climatic impact of the surface and groundwater resources.
Basically, from the local people interview, the degradation of water resources is nowadays one of the major constraints of the watersheds of Sob and Diohine in the sylvopastoral area of Niakhar due mainly to the soil and water salinization we confirmed by our one-shot field measurements in June 2018. From local people, it seems that the salinization of sols and surface waters has been accelerated by a large tidal event in 1984.
Moreover we hypothesize that the pressure on the hydrosystems exerted by the increase of water demand largely driven by the population growth has breaking off the balance between the needs of the population and available water resources, increasing the salinization process while water needs continue to increase. The water scarcity is now a fundamental concern in this area, a limiting and constraining factor for the activities of the population. The rainfall increase noted in the last decade, does not seem to be enough to reverse the trend and to ensure both the rise of the piezometric level of the aquifers and the desalinization of surface and ground waters.
If we consider the future growing needs of water because of the population increase, because of the agricultural pressure for both livestock breeding and local farming market, how to match with a sustainable water supply for the rural population in this region?
All the rainfall data are provided by the National Agency of Civil Aviation and Meteorology (ANACIM), these data are not publicly accessible. The original data for the water quality have been provided as Supplement.
The supplement related to this article is available online at: https://doi.org/10.5194/piahs-383-391-2020-supplement.
Conceptualization was done by WF, ANF and DO; methodology has been done by WF and DO, data curation by WF and the formal analysis by WF and DO; writing of the original draft preparation has been done by WF; and the writing for review and editing was done by WF, ANF, DO, FD and OR; visualization was done by AK. All authors have read and agreed to the published version of the manuscript.
The authors declare that they have no conflict of interest.
This article is part of the special issue “Hydrological processes and water security in a changing world”. It is a result of the 8th Global FRIEND–Water Conference: Hydrological Processes and Water Security in a Changing World, Beijing, China, 6–9 November 2018.
This research was carried out under the umbrella of the PhD Scholarship from the French Embassy in Senegal with the support of Campus-France, and the funding support from IRD, LMI IESOL, the research unit Eco&Sols and the international research unit UMI0236 RESILIENCES. The study got technical support from the Faidherbia-Flux Program, “a new highly instrumented collaborative Observatory in a semi-arid agro-silvo-pastoral system of Western Africa (Niakhar-Senegal)”, and the People-Health-Environment Observatory of Niakhar (OPSE, from IRD).
Authors wish to thank researchers and technicians from Faidherbia-Flux Programme, specially Ibou Diouf, and from the OPSE, specially Laurence Fleury and Robert Diatte for their help on field and discussion. Special thanks for Luc Descroix for his scientific recommendations. And the reviewers are also thanked for the time dedicated and their comments.
This research has been supported by the French Embassy in Senegal, the IRD, the LMI IESOL, the research unit Eco&Sols, and the international research unit UMI0236 RESILIENCES.
Asfaw, A., Simane, B., Hassen, A., and Bantider, A.: Variability and time series trend analysis of rainfall and temperature in northcentral Ethiopia: A case study in Woleka sub-basin, Weather and Climate Extremes, 19, 29–41, 2018.
Becker, C., Diouf, M., and Mbodj, M.: L'Evolution démographique régionale du Sénégal et du bassin arachidier (Sine-Saloum) au vingtième siècle, 1904–1976, in: African population and capitalism: historical perspectives, edited by: Cordell, D. D. and Gregory, J. W., The University of Wiscousin Press, Madison, USA, 76–94, 1987.
Daulenay, V., Deschamps-Cottin, M., Bertaudière, V., Vila, B., Oliveau, S., Dos Santos, S., Soumare, A., and Lalou, R.: Dynamique démographique et dynamique du parc agroforestier à Faidherbia albida (Del.) A Chev. en pays Serer (Sob, Sénégal), Proceeding in XXVIth International Population Conf., 2 October 2009, Marrakech, Morocco, available at: https://www.researchgate.net/publication/242201196 (last access: 28 July 2020), 2009.
Descroix, L., Mahé, G., Lebel, T., Favreau, G., Galle, S., Gautier, E., Olivry, J.-C., Albergel, J., Amogu, O., Cappelaere, B., Dessouassi, R., Diedhiou, A., Le Breton, E., Mamadou, I., and Sighomnou, D.: Spatio-temporal variability of hydrological regimes around the boundaries between Sahelian and Sudanian areas of West Africa: A synthesis, J. Hydrol., 375, 90–102, 2009.
DGPRE: Plan d'action de gestion intégrée des ressources en eau (PAGIRE) projet de mise en œuvre du PAGIRE dans le bassin arachidier (PAGIRE-BA) étude d'évaluation et de suivi des ressources en eau de surface, R3-rapport sur la modélisation des ressources en eau et les normes de conception des ouvrages, Ministère Ressources en Eau, Dakar, Sénégal, 2014.
Elbouqdaoui, K. Haida, S., Aboulabbes, O., Benaabidat, L., Zahraoui, M., and Ozer, A.: Evolution du régime pluviométrique et hydrométrique du bassin versant du Srou (Moyen Atlas, Maroc), Geo-Eco-Trop, 30, 41–56, 2006.
Gac, J. and Kane, A.: Le fleuve Sénégal: I. Bilan hydrologique et flux continentaux de matières particulaires à l'embouchure. Senegal river. Part I. Water budget and flux of carried load through the estuary, Bull. Sciences Géologiques, ULP, Université de Strasbourg, Strasbourg, France, 99–130, 1986.
Hadgu, G.: Trend and variability of rainfall in Tigray, Northern Ethiopia: Analysis of meteorological data and farmers perception, J. Agric. Res., 1, 88–100, 2013.
Lericolais, A.: La détérioration d'un terroir Sob, en pays Sérèr (Sénégal), Etudes rurales, no. 37/39, Terroirs Africains et Malgaches, 113–128, EHESS, Paris, France, 1970.
Lericolais, A.: La mort de l'arbre à Sob, en pays Sereer (Sénégal), in: Tropiques Lieux et Liens, ORSTOM, Paris, France, 187–197, 1989.
Orange, D.: Hydroclimatologie du Fouta Djalon et dynamique actuelle d'un vieux paysage latéritique (Afrique de l'Ouest), Mém. Sci. Géol., 93, 206 pp., Université de Strasbourg, Strasbourg, France, 1992.
Pontié, G., Guigou, B., and Lericollais, A.: La gestion des terres dans le Sine, in: Paysans Sereer: dynamique agraire et mobilité au Sénégal, edited by: Lericollais, A., IRD, Paris, France, 146–194, 1999.
Sagna, P., Ndiaye, O., Diop, C., Diongue Niang, A., and Sambou, P. C.: Les variations récentes du climat constatées au Sénégal sont-elles en phase avec les descriptions données par les scenarios du GIEC? Pollution Atmosphérique, 227, https://doi.org/10.4267/pollution-atmospherique.5320, 2015.
Servat, E., Paturel, E., Lubès-Niel, H., Kouamé, B., Masson, J. M., Travaglio, M., and Marieuet, B.: De différents aspects de la variabilité de la pluviométrie en Afrique de l'Ouest et Centrale non sahélienne, Revue des Sciences de l'Eau, 12, 363–387, 1999.
Shah, R., Bharadiya, N., and Manekar, V.: Drought Index Computation Using Standardized Precipitation Index (SPI) Method For Surat District, Gujarat, Aquat. Pr., 4, 1243–1249, https://doi.org/10.1016/j.aqpro.2015.02.162, 2015.