the Creative Commons Attribution 4.0 License.
the Creative Commons Attribution 4.0 License.
 | 16 Sep 2020
PREMHYCE: An operational tool for low-flow forecasting
Pierre Nicolle
François Besson
Olivier Delaigue
Pierre Etchevers
Didier François
Matthieu Le Lay
Charles Perrin
Fabienne Rousset
Dominique Thiéry
François Tilmant
Claire Magand
Timothée Leurent
Élise Jacob
In many countries, rivers are the primary supply of water. A number of uses are concerned (drinking water, irrigation, hydropower, etc.) and they can be strongly affected by water shortages. Therefore, there is a need for the early anticipation of low-flow periods to improve water management. This is strengthened by the perspective of having more severe summer low flows in the context of climate change. Several French institutions (Inrae, BRGM, Météo-France, EDF and Lorraine University) have been collaborating over the last years to develop an operational tool for low-flow forecasting, called PREMHYCE. It was tested in real time on 70 catchments in continental France in 2017, and on 48 additional catchments in 2018. PREMHYCE includes five hydrological models: one uncalibrated physically-based model and four storage-type models of various complexity, which are calibrated on gauged catchments. The models assimilate flow observations or implement post-processing techniques. Low-flow forecasts can be issued up to 90 d ahead, based on ensemble streamflow prediction (ESP) using historical climatic data as ensembles of future input scenarios. These climatic data (precipitation, potential evapotranspiration and temperature) are provided by Météo-France with the daily gridded SAFRAN reanalysis over the 1958–2017 period, which includes a wide range of conditions. The tool provides numerical and graphical outputs, including the forecasted ranges of low flows, and the probability to be under low-flow warning thresholds provided by the users. Outputs from the different hydrological models can be combined through a simple multi-model approach to improve the robustness of forecasts. Results are illustrated for the Ill River at Didenheim (northeastern France) where the 2017 low-flow period was particularly severe and for which PREMHYCE provided useful forecasts.
- Article
(2769 KB) - Full-text XML
- BibTeX
- EndNote


1.1 Why anticipating low flows?
In many countries, rivers are the primary supply of water. In France in 2013, 73 % of total withdrawals (38 km3) came from rivers (Banque National des Prélèvements en Eau, Chataigner and Michon, 2017). A number of uses are concerned (thermal power plant cooling, hydropower, drinking water, irrigation, industry, navigation) and can be strongly affected by water shortages in rivers (Bousquet et al., 2003). Furthermore, uses should be compatible with maintaining the quality of aquatic life, through environmental constraints like minimum environmental flows (Acreman and Dunbar, 2004).
There is a need for the early anticipation of low-flow periods to improve water management and to take more timely measures to mitigate the socio-economic and ecological impact of water shortages (Chiew and McMahon, 2002; Karamouz and Araghinejad, 2008). Extreme droughts which occurred in France in 1976, 2003, and more recently in 2011, 2015 and 2017 underline the need for forecasting systems, which is strengthened by the perspective of having more frequent and severe low flows in summer in the context of climate change.
In 2011, the French Agency for Biodiversity (formerly ONEMA) and the Ministry for the environment launched a research project to compare and evaluate the ability of various hydrological models to produce low-flow forecasts useful for real-time decision making. This project led to the development of a low-flow forecasting tool that includes the tested hydrological models.
1.2 Hydrological tools for low-flow forecasting
There are a few existing approaches and tools for low-flow forecasting. A detailed review can be found in Nicolle et al. (2014). More recently, a few works have been carried out on this topic. Some examples are commented here:
-
conditioning methods for input scenarios for seasonal streamflow forecasting, as tested by Crochemore et al. (2017). These authors investigated the impact of conditioning methods on the performance of seasonal streamflow forecasts, to identify forecast attributes leading to improvement or deterioration using these methods.
-
investigation of the skill of seasonal ensemble low-flow forecasts in the Moselle River (Demirel et al., 2015). The authors compared three data-driven and conceptual hydrological models for low-flow forecasting, and assessed the effect of ensemble seasonal forecasts on low-flow forecasts quality.
-
proposing a framework for low-flow forecasting in Mediterranean streams (Risva et al., 2018). The authors provided a simple and effective tool for low-flow forecasting up to six month ahead, which needs limited data, based on the improvement of the linear reservoir concept that represents streamflow recession.
In France, a few operational tools have been recently developed, indirectly or directly linked to low-flow forecasting. One can mention:
-
the Aqui-FR project (Habets et al., 2015) that aims integrating hydrogeological models to monitor and forecast groundwater resource at medium range to seasonal scale, on the main aquifers of France.
-
E-tiage, which is an online service to help end-users for water management. It allows monitoring river streamflow over past days and forecast streamflows on the Adour-Garonne and Charentes catchment (south-west part of France).
1.3 Objectives of the study
The objectives of the article are to present the main characteristics of the low-flow forecasting tool and the results obtained in operational conditions over the 2017 summer period on a case study.
2.1 Catchment set and data
2.1.1 Selection of catchments
The catchment set was built in cooperation with a variety of institutions involved in low-flow management, on the regulatory or operational sides (environment directions at regional and department levels, regional irrigation managers, etc.). They provided lists of target catchments, where human influences were requested to be limited, given the current version of the tool does not account for upstream influences. This resulted in the selection of 118 catchments, mainly located in north-east, north-west, south-west, and centre of France (see Fig. 1). The catchments show various hydrological regimes ranging from oceanic to Mediterranean or mountainous. Table 1 shows the main characteristics of the catchment set, with catchment sizes ranging from 9 to 111 000 km2, median elevation ranging from 52 to 1794 m and historical streamflow data covering periods from 4 to 60 years.
Table 1Summary of the main characteristics of the 118 catchments.
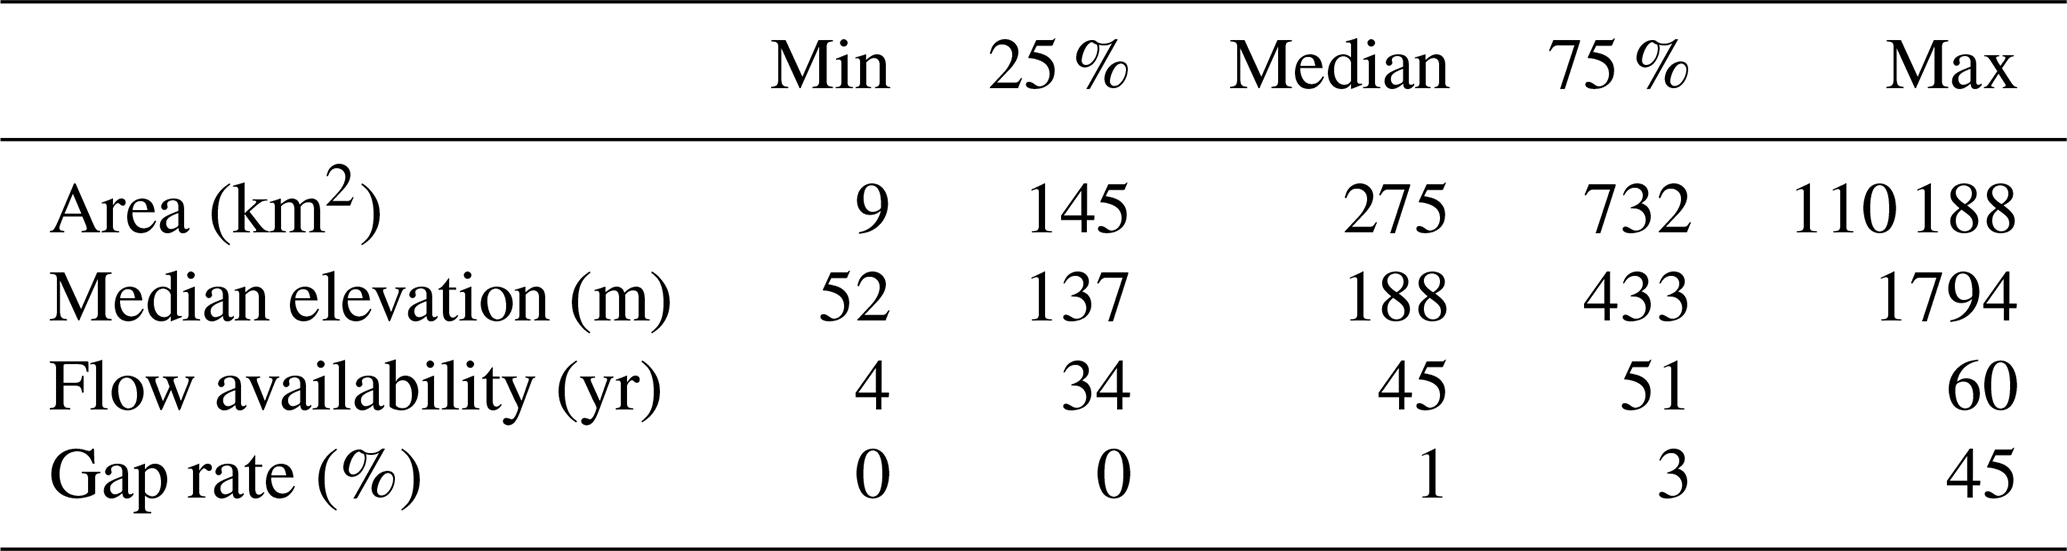
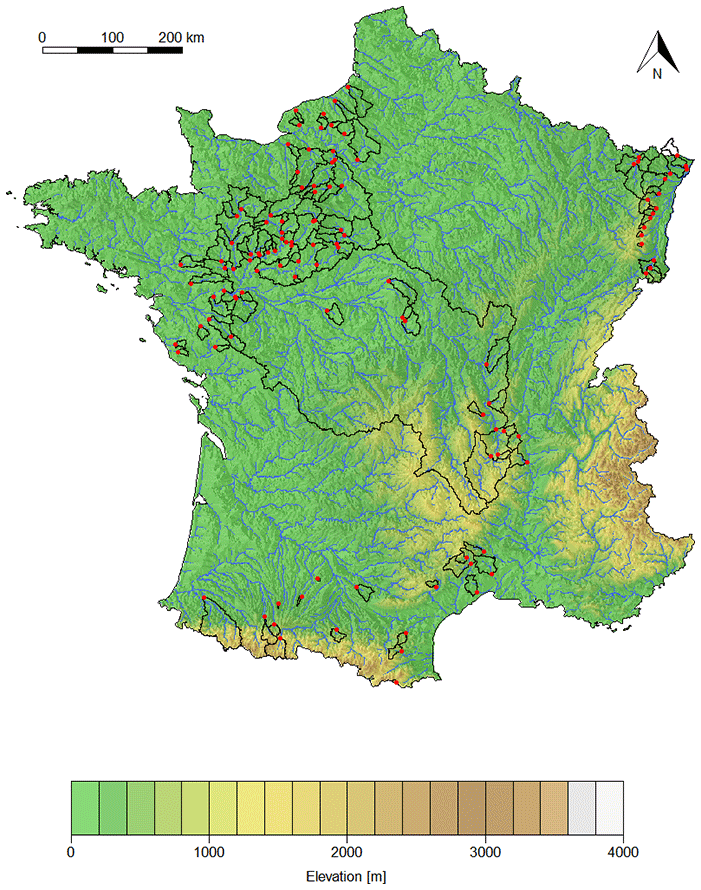
Figure 1Location of the 118 catchments in France. Each outlet is shown by a red dot.
2.1.2 Data
Daily streamflow records were retrieved from the French national discharge archive (HYDRO database, available at http://www.hydro.eaufrance.fr, last access: 20 November 2018). Daily precipitation and temperature data originate from the gridded (8 km × 8 km) SAFRAN climate reanalysis developed by Météo-France (Vidal et al., 2010). Potential evapotranspiration (PE) was computed using the formula proposed by Oudin et al. (2005). The climatic series are continuously available on the 1959–2018 period over France. This period includes severe droughts conditions (e.g. in summers 1976, 1989, 2003, 2005, 2011, 2015 and 2017).
Table 2Percentiles of the distribution of a few climatic and hydrological characteristics of the 118 catchments. Interannual variability values correspond to coefficients of variation calculated on the 1958–2009 period for P and PE, and on streamflow available period for Q. Q50, Q80 and Q90 are respectively the 50th, 80th and 90th exceedance percentiles of the flow duration curve.
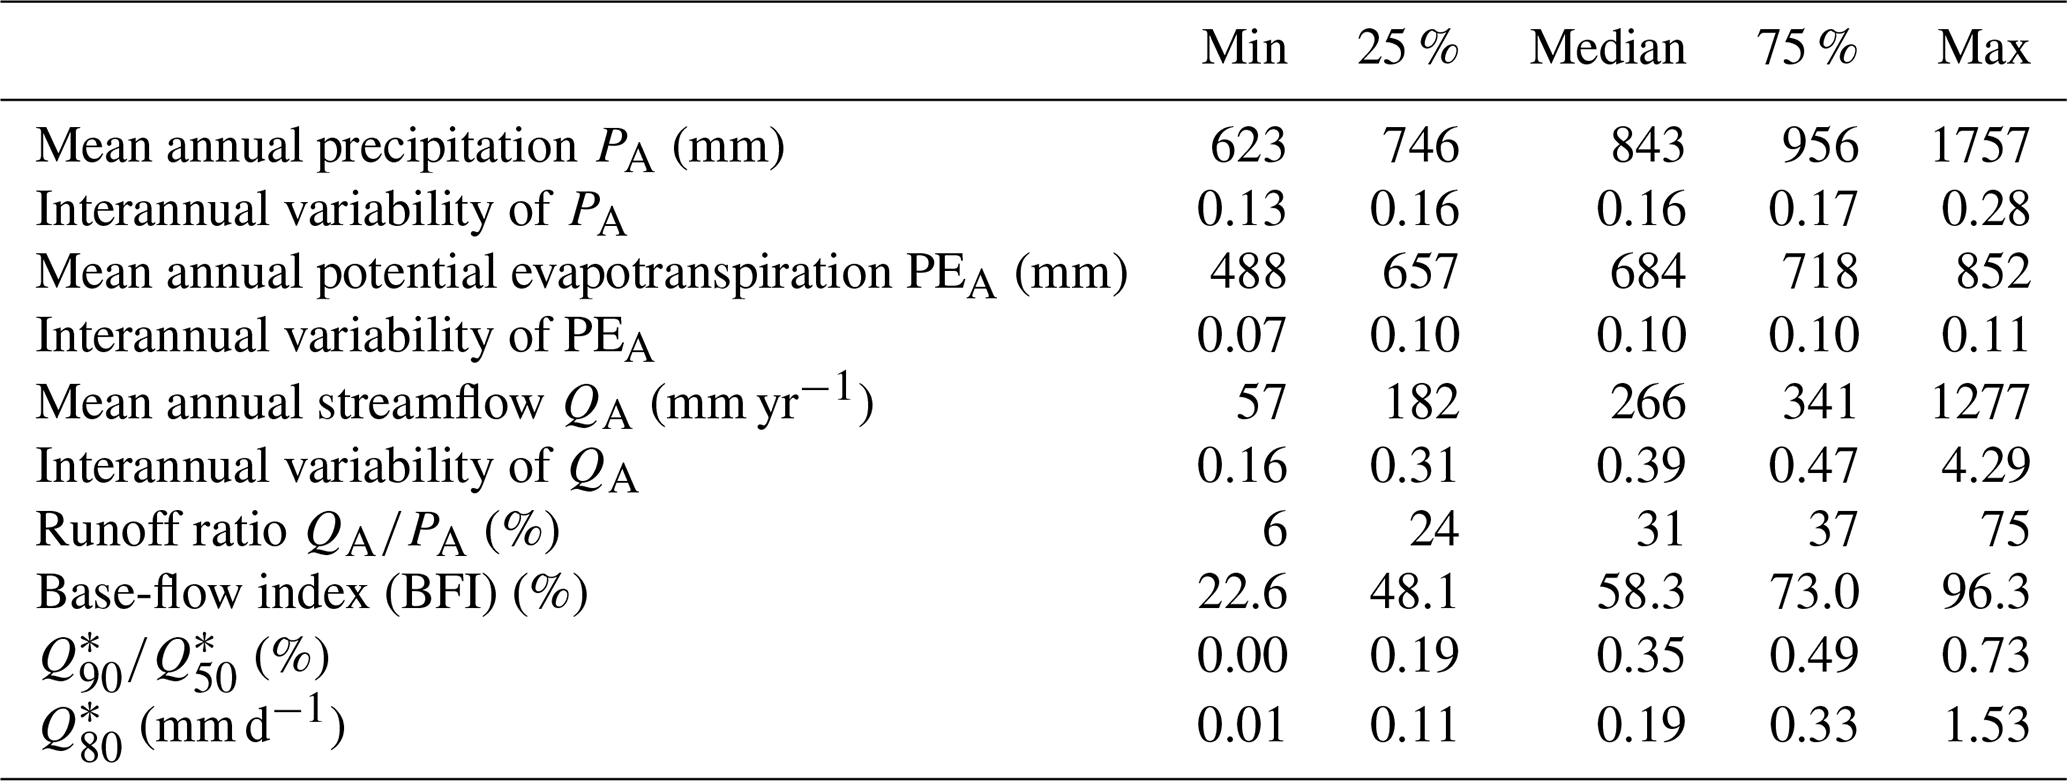
Table 2 displays the ranges of climate and flow characteristics of the catchment set. Hydroclimatic conditions in France are quite variable in terms of mean annual precipitation, PE and streamflow. There is also a strong interannual variability, especially for streamflow. On average, 31 % of rainfall become runoff for the catchment set, but this ratio varies between 6 % and 75 %.
2.2 Ensemble low-flow forecasting using hydrological models
Models are expected to forecast streamflow from time steps t+1 to t+L (with L the lead time), knowing both observed meteorological inputs and streamflow until time step t and making assumptions (i.e. choosing scenarios) for the future meteorological inputs from t+1 to t+L. Streamflow observations can be used within an assimilation scheme and/or a statistical correction procedure.
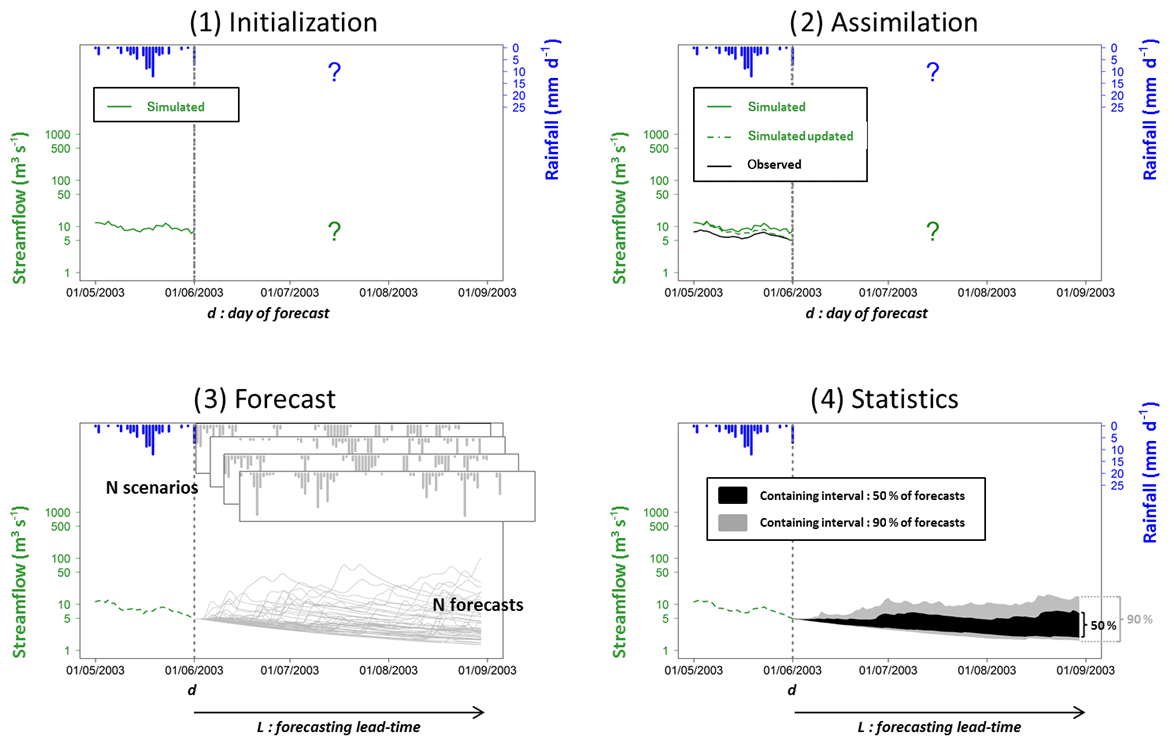
Figure 2 presents the successive steps of the forecasting method for low-flow forecasting with hydrological models:
-
internal states of hydrological models are initialized using climatic observations of past conditions until the day of forecast;
-
last streamflow observation(s) can be assimilated, typically by correcting model internal states or by applying streamflow post-processing (e.g. model error correction);
-
several meteorological scenarios are used as model input to provide an ensemble of streamflow forecasts from t+1 to t+L;
-
streamflow forecast are statistically analyzed to provide confidence intervals of possible future streamflows over the time horizon.
This approach is quite classical. The originality in the case of PREMHYCE is that it is applied in a multi-model framework. This has two potential advantages: to improve the resulting forecasts and to better account for structural uncertainty.
2.3 Input forecasting scenarios
The PREMHYCE operational tool adopts the classical ESP approach (Day, 1985) in terms of future meteorological inputs. For a given catchment, let us consider that N years of past historical climatic observations are available. In real time, one wishes to make a forecast on a calendar day t of a year Y within the test period, i.e. to forecast flows between calendar days t+1 and t+L. The observed meteorological data available between days t+1 and t+L in the years 1 to N (i.e. N scenarios) are used as input scenarios to the model, considering that they are likely meteorological conditions for this period of the year. Here, 57 years (1959–2016) of daily climate data from the SAFRAN reanalysis were used for the tests during the 2017 year and 58 scenarios (1959–2017) for the 2018 year.
A zero-precipitation scenario (i.e. precipitation equal to 0 for the L next days) is also used to provide the worst-case streamflow forecast. It is associated to a daily interannual average of potential evapotranspiration.
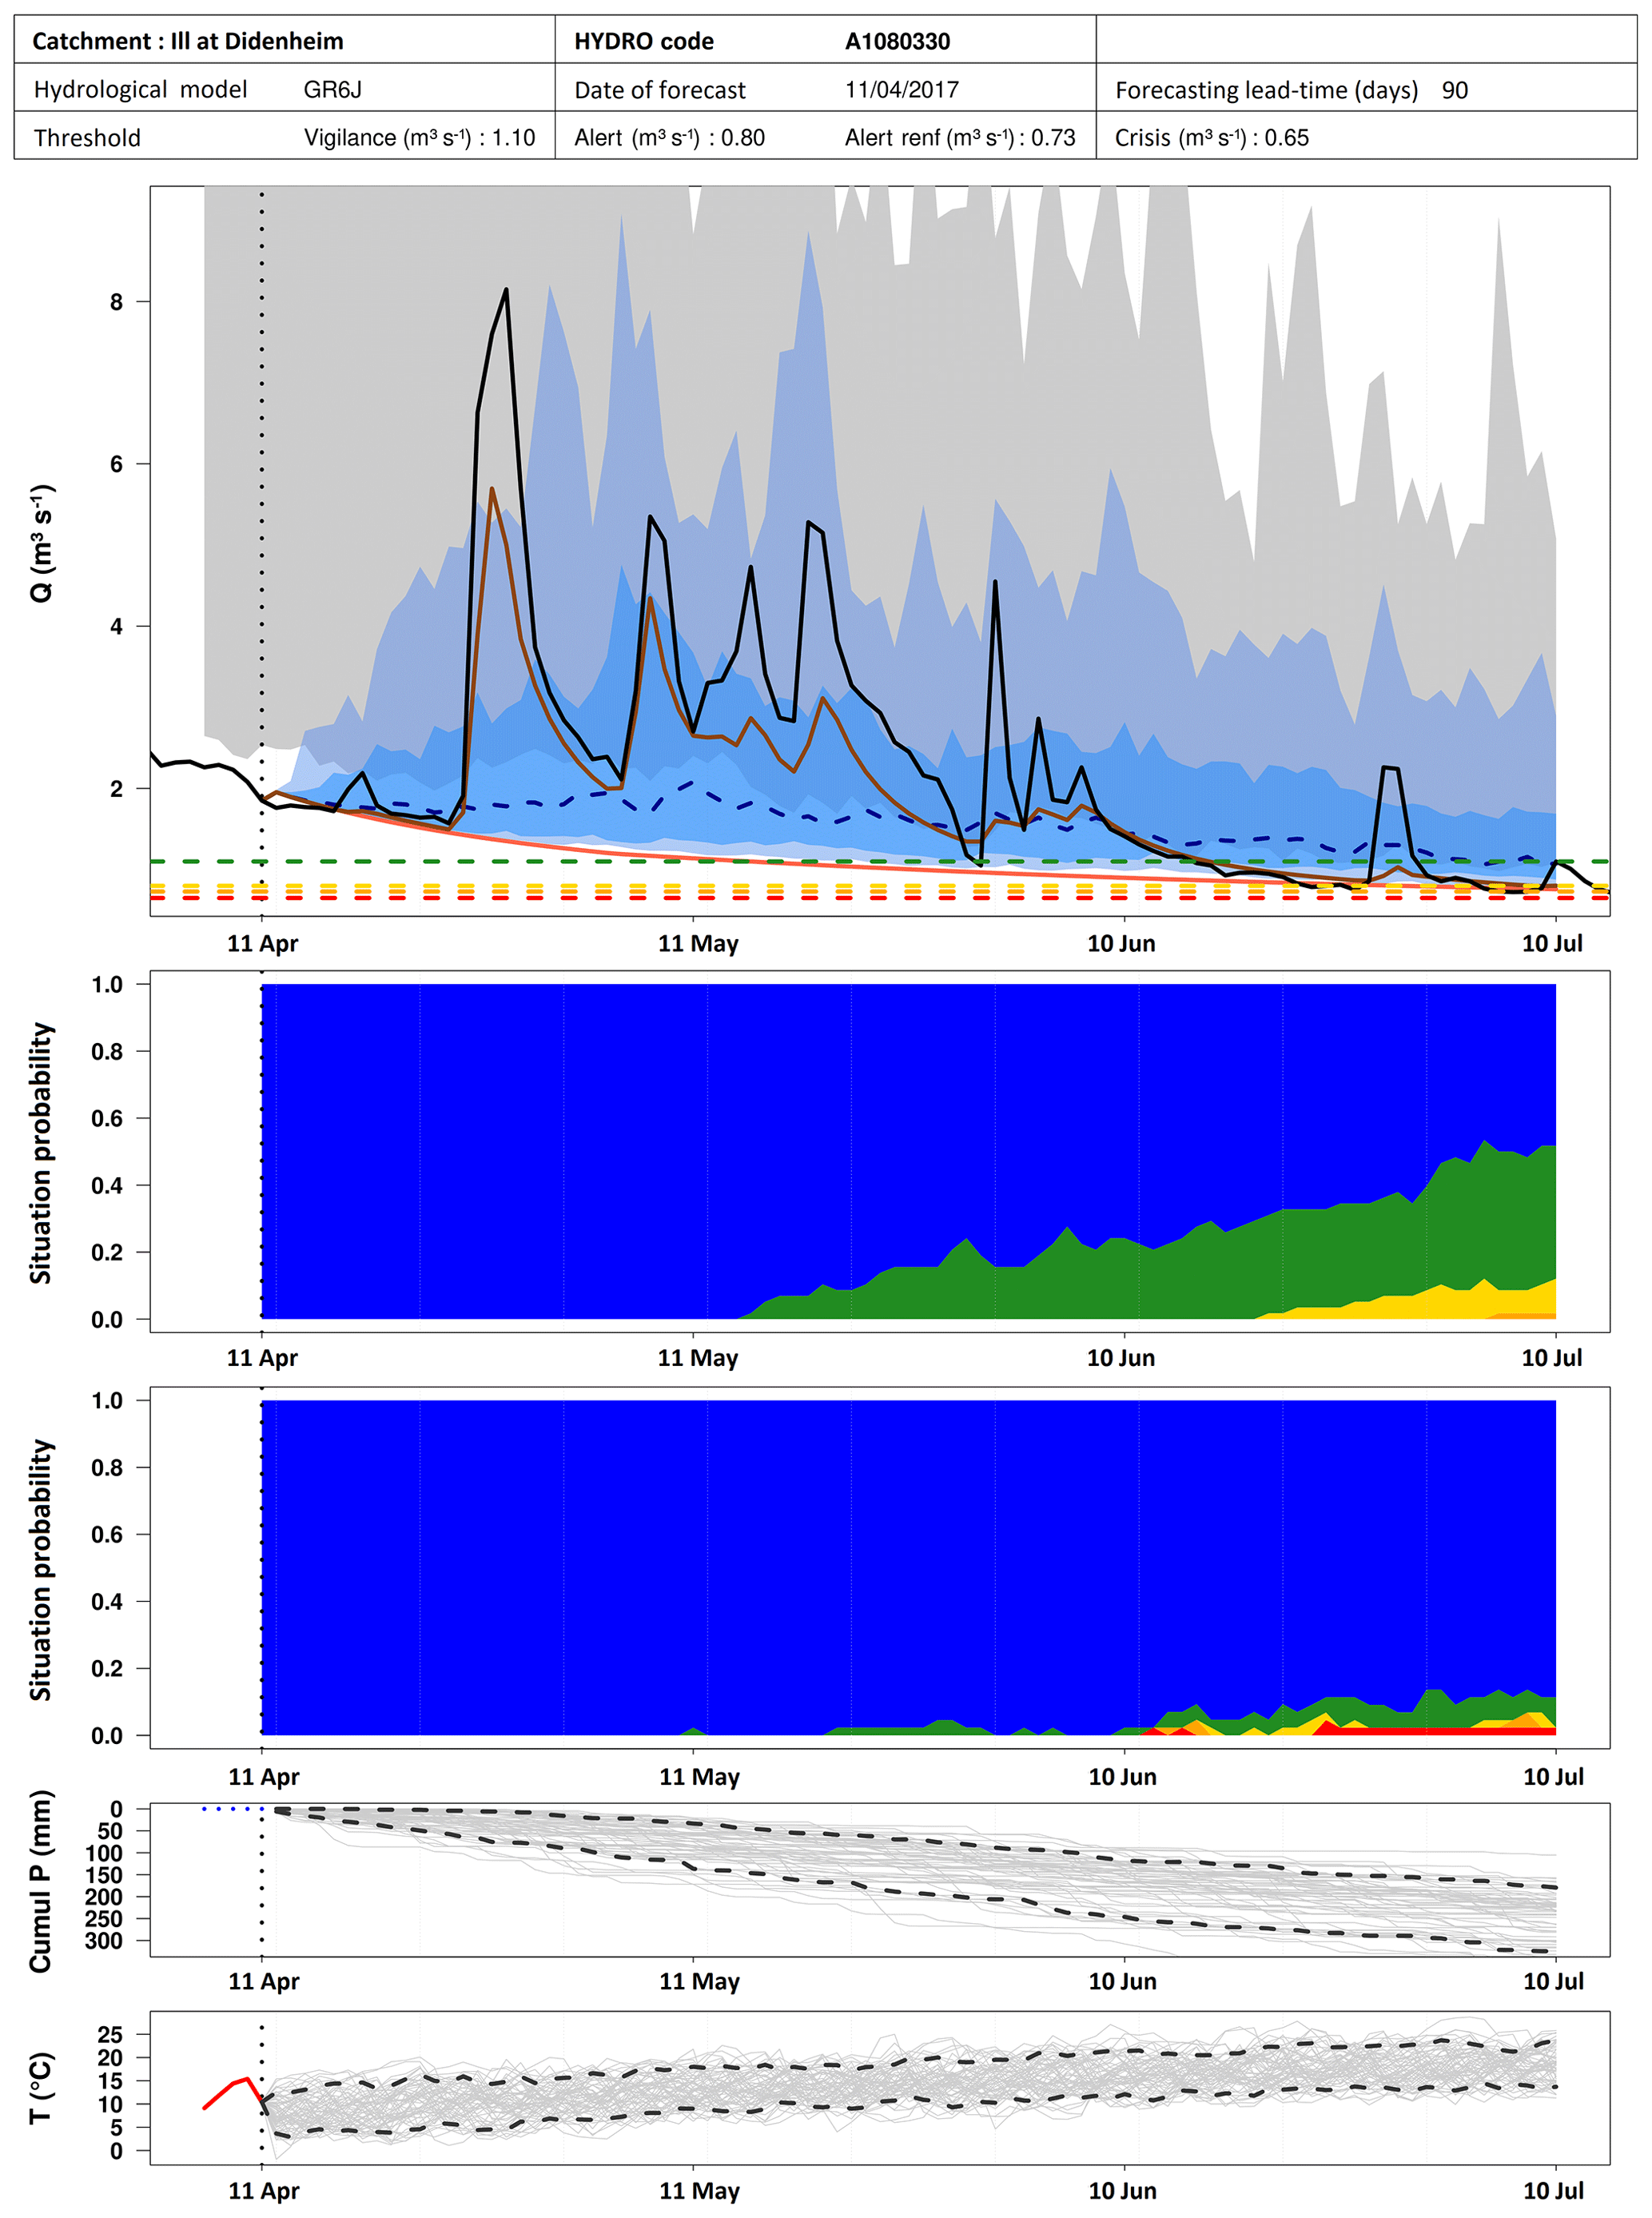
Figure 3Example of streamflow forecast synthesis plot provided by PREMHYCE on 11 April 2017 for the Ill River at Didenheim with GR6J.
3.1 Platform presentation
PREMHYCE is a low-flow forecasting platform that aims at providing low-flow forecasts at a daily time step for the next 90 d to end-users. It is based on the airGR package (Coron et al., 2017a, b) and includes five hydrological models: Gardenia (BRGM), GR6J (Inrae), Mordor (EDF, currently implemented under a simplified form for technical reasons, here called IrMo), Presages (Lorraine University) and the Safran-Isba-Modcou (SIM) modelling suite (Météo-France). More detailed information on these models and their practical implementation for forecasting are given by Nicolle et al. (2014). Note that the SIM model is run by Météo-France independently from the platform and only the SIM outputs are uploaded into the PREMHYCE tool. This platform is currently hosted by a server at Inrae and allows data exchange via FTP protocol.
The tool includes two main modules:
-
An off-line module for the calibration of hydrological models, to estimate models parameters and evaluate models reliability. The module functions allow to:
-
import the catchment database (observed time series of streamflows, precipitation, PE and temperature);
-
calibrate the hydrological models using these time series;
-
copy the calibration database to a real-time database.
-
-
An online real-time low-flow forecasting module, to produce forecasts every day. The module functions allow to:
-
update the real time database using last observed data until the day of forecast;
-
update hydrological models internal states until the day of forecast;
-
compute streamflow forecasts up to 90 d ahead using historical scenarios;
-
provide synthetic graphical results.
-
3.2 Model calibration
The model parameters can be either calibrated within the platform or specified by the user. As a physically-based model, SIM has been set up all over France and its parameters are not further tuned for the PREMHYCE objectives. Note that SIM is the only model for which no calibration against observed flow data at the catchment outlet is performed. The spatially distributed parameters used in this model are estimated regionally.
Users provide a list of catchments that have to be in the French HYDRO database. For each catchment, up to four operational streamflow thresholds can be also provided, which will be used to interpret the severity of future forecasted low flows.
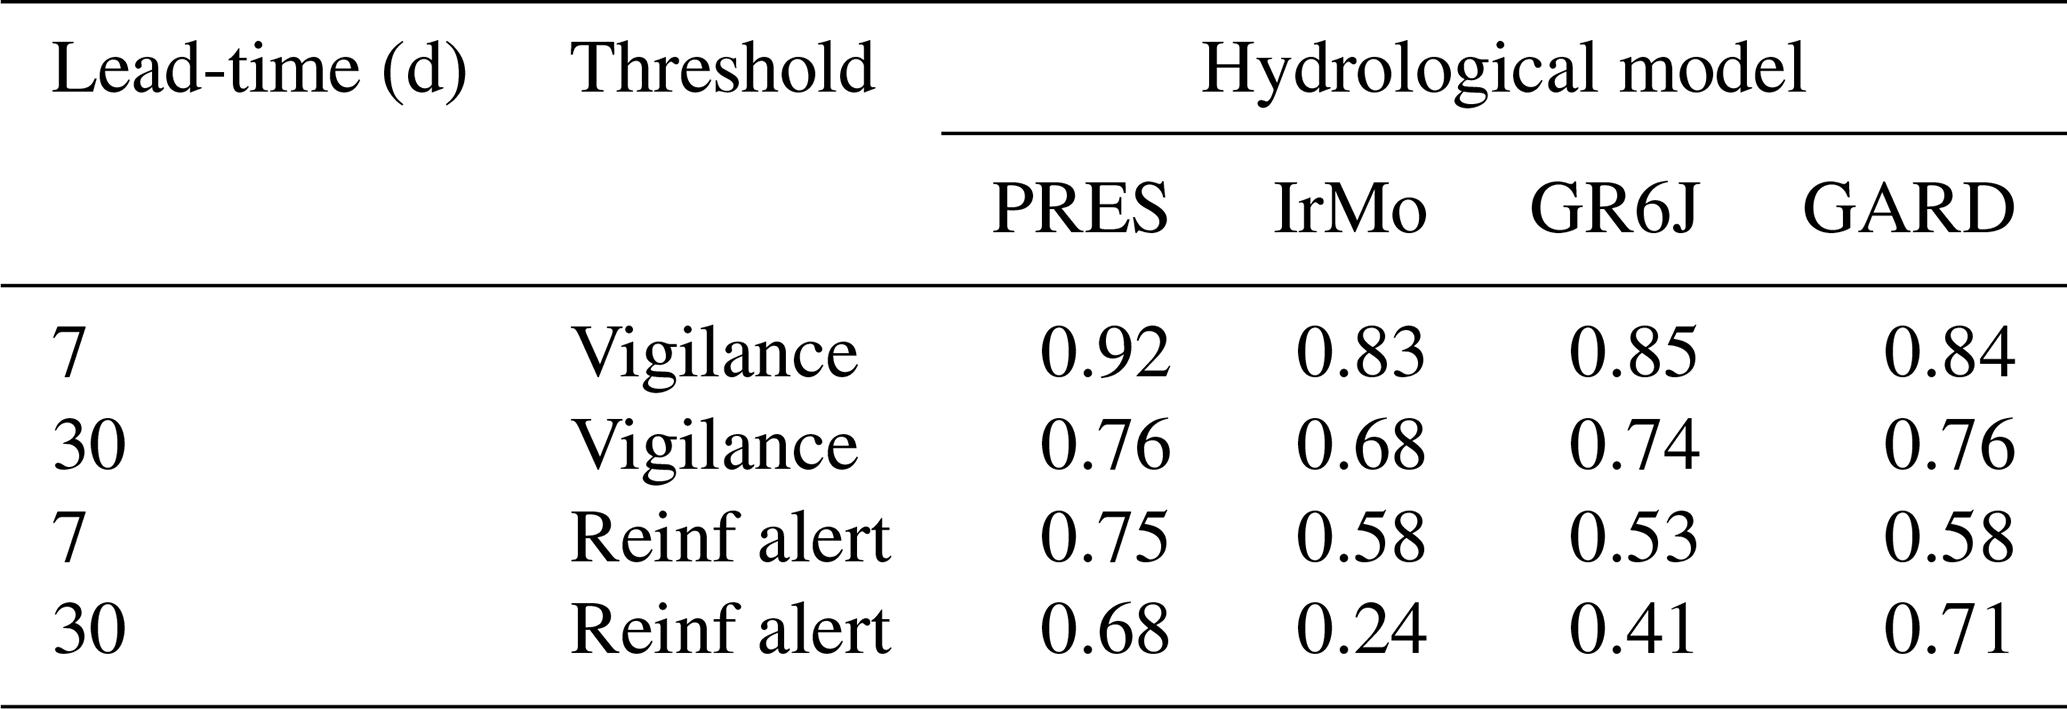
Table 3Probability of detection to be under the vigilance and reinforced alert threshold for each model and for the 7 and 30 d lead-times for the Ill River at Didenheim.
Models are calibrated using a gradient-type method for the GR6J, IrMo and Presages models. Two objective functions (KGE, Gupta et al., 2009; NSE, Nash and Sutcliffe, 1970) can be used with three prior transformations of streamflow (Q, , ln(Q)). A compromise can be sought between several parameter sets obtained by these various functions. Gardenia is calibrated using the Rosenbrock method with the NSE objective function calculated on ln(Q).
3.3 Real-time daily operation for low-flow forecasting
The tool can be run every day to provide low-flow forecasts at the daily time step. Given the computing constraints associated with the SIM model, the SIM streamflow forecasts are provided only once a month.
Several operations are made every day to provide low-flow forecasting.
The last observed data until the day of forecast are first used to update model internal states. A data import process has been implemented to retrieve meteorological and hydrological data.
Every day, Météo-France provides real-time gridded SAFRAN data (precipitation, temperature) for the day before forecasting, as daily data for the day of forecast is not yet available. Every month, Météo-France provides the gridded SAFRAN reanalysis of these meteorological data for the month before, to consolidate real-time SAFRAN data. These data are averaged at the catchment scale for each catchment.
Users can provide the last observed streamflows up to the day before forecasting, as daily streamflow for a catchment at the day of forecast is not yet available. These observed streamflow data are used within assimilation schemes or post-correction procedures for low-flow forecasting. If observed data is not available during the seven last days, models do not use assimilation schemes or post-correction procedure.
The database containing the streamflow and meteorological data is updated on a daily basis and initial models states are computed with these data at the day of forecast.
The forecasts are then computed by applying the ESP method described above.
3.4 Results
For each model, the PREMHYCE tool provides streamflow forecasts for each scenario and for the no precipitation scenario, for the next 90 d, under numerical or graphical formats. Figure 3 shows an example of synthesis plot provided by the tool for a forecast issued on 11 April 2017 for the Ill River at Didenheim with the GR6J model. It represents:
-
Quantiles (0.1, 0.25, 0.5, 0.75 and 0.9) of the distribution of streamflow forecasts for the next 90 d (blue envelop curve and blue dashed line).
-
Streamflow forecasted with the no precipitation scenario (orange line).
-
Quantile 0.1 and 0.9 of the natural variability of observed streamflow (grey envelop curve), defined for a given calendar day d as the distribution of available streamflows in the historical years for this day. It is used as a benchmark to compare the streamflow forecasts.
-
Probability for streamflow forecasts to be under each threshold provided by user for the next 90 d (i.e. number of scenarios under each threshold).
-
Probability for the natural variability of observed streamflow to be under each threshold provided by user for the next 90 d.
-
Cumulative precipitation of each meteorological scenario for the next 90 d.
-
Temperature of each meteorological scenario for the next 90 d.
Here are also represented observed streamflow (black line), and simulated streamflow by GR6J using observed meteorological P and PE (brown line), that are normally not available in real-time.
In 2017, the PREMHYCE tool was launched every day from the 1 March to the 1 October. Here, results will not include the SIM model, which was only supplied once a month.
We chose to present the results of low-flow forecasts for the Ill River at Didenheim. The Ill River is located in the north-east part of France. Catchment area is 660 km2 and mean annual streamflow is 6700 L s−1. Daily streamflow data are available over the 1974–2018 period. Operational threshold provided by users are 1100 L s−1 for vigilance, 800 L s−1 for alert, 730 L s−1 for reinforced alert and 650 L s−1 for crisis. They correspond respectively to the percentiles 8 %, 4 %, 2 % and 1 % of the daily flow duration curve. The year 2017 has been particularly severe in terms of duration and severity of low flows: streamflow remained under the vigilance threshold during 71 d over the March-October period, and 23 d under the crisis threshold.
The quality of low-flow forecasts is evaluated using the probability of detection (POD). It is based on the contingency table for low flows considering a threshold (Schaefer, 1990), and is computed considering the number of Hits and Correct misses as follow:
Here, an event is considered well forecasted if more than 50 % of members are below the low-flow threshold.
Table 3 presents the probability of detection (POD) for the vigilance and reinforced alert threshold for each model and for the 7 and 30 d ahead lead-times. All the models show a good ability to detect vigilance threshold at 7 d ahead, between 0.83 for IrMo and 0.92 for PRESAGES. This ability decreases when lead-time increases, whatever the model and the threshold. Models have more difficulties to anticipate cross of thresholds early, which is an expected result. Surprisingly, Gardenia presents a better POD for 30 d lead-time than for 7 d lead-time. This may come from the post-correction method used, which is different from the three other models. More investigations are needed to better understand this result.
POD also decreases for the lower threshold (i.e. reinforced alert), whatever the model or lead-time. Models have more difficulties to detect extreme low-flows. This could be due to the use of meteorological input scenarios, bearing in mind that 2017 is among the driest year on record and that the use of ESP always tends to provide meteorological scenarios that are statistically wetter for severe low-flow periods, leading to an overestimation of low-flows.
Hydrological models present the same trends, but significant differences can be observed for the reinforced alert threshold where PRESAGES seems to be slightly better.
Models reliability has been evaluated using the containing ratio (see Nicolle et al., 2014). For this catchment, models appear to be quite reliable, especially Presages and IrMo for the 7 d lead-time. For Gardenia and GR6J, reliability is improved for the 30 d lead-time.
Models are able to forecast the cross of threshold 35 d in advance on average (at least 50 % of ensemble members below 80th percentile of the streamflow distribution), even if there are some differences between models. Overall, comparing hydrological models to the natural variability of streamflow shows the interest of using hydrological models: streamflow ensemble forecast from hydrological models provide sharper and more accurate ensemble. Moreover, using natural variability of streamflow as an ensemble forecast does not allow detecting the crossing of thresholds: most of the observed streamflows in the past years are superior to the thresholds. The representation of soil humidity conditions by hydrological models at the day of forecast is essential to improve low-flow forecasts, although this representation remains less important than having reliable meteorological input scenarios for longer lead-time.
Improving forecasting input scenarios seems to be the most promising line of action, in order to increase the efficiency of hydrological forecasts at longer lead-times. Low-flow forecasting is less efficient when users need it the most, i.e. when the conditions are particularly dry, because the ESP method tends to overestimate real conditions by construction. Using conditioning methods to constrain input scenarios could be an interesting way to improve low-flow forecasting, as well as using ensemble forecasts from meteorological models. The use of seamless inputs scenarios combining both ESP and ensemble forecasts (typically from Météo-France or the European Centre for Medium-Range Weather Forecasts – ECMWF) could also be implemented.
The results shown on the Ill River are only an example. The relative merits of the models are different among catchments. A more thorough analysis is needed to get a more general evaluation on all the catchments where the PREMHYCE was run.
The PREMHYCE project has implemented several hydrological models for low-flow forecasting in a common structure. Results on the 2017 low-flow periods showed the interest of using such a tool to help end-users decisions.
There is ongoing work to improve low-flow forecasting by integrating short-term or mid-term meteorological forecasts as inputs, and by taking into account human influences such as dam or irrigation. The tool will also give the possibility to combine streamflow forecasts in a multi-model approach. The operational prototype currently tested by operational users will be more widely spread to practitioners in the coming months.
Readers can access streamflow observations used in this study at the HYDRO database website (http://www.hydro.eaufrance.fr/) and climatic data from the Météo-France portal (https://publitheque.meteo.fr/). Hydrological and climatic data were processed into a joint database by Delaigue et al. (2020), with synthesis files available at https://doi.org/10.15454/UV01P1.
PN wrote the first draft of the article. PN and FT performed the computations. PN, FB, OD, PE, DF, MLL, CP, FR, DT and FT contributed the methodological developments, modelling experiments and results analysis. All authors discussed the results and contributed to the final manuscript.
The authors declare that they have no conflict of interest.
This article is part of the special issue “Hydrological processes and water security in a changing world”. It is a result of the 8th Global FRIEND–Water Conference: Hydrological Processes and Water Security in a Changing World, Beijing, China, 6–9 November 2018.
The authors thank Météo-France for providing meteorological data and the national hydrometeorological forecasting centre (SCHAPI) for providing streamflow data. The Regional Directions for the Environment (DREAL) are also thanked for providing streamflow data and their feedback on the project. The comments of an anonymous reviewer helped to improve the manuscript.
The PREMHYCE project was funded by the French Office for Biodiversity (OFB) and the Direction for FreshWater and Biodiversity of the French Ministry for the Ecological Transition (MTES).
Acreman, M. C. and Dunbar, M. J.: Defining environmental river flow requirements – a review, Hydrol. Earth Syst. Sci., 8, 861–876, https://doi.org/10.5194/hess-8-861-2004, 2004.
Bousquet, S., Gaume, E., and Lancelot, B.: Évaluation des enjeux socio-économiques liés aux étiages de la Seine, Houille Blanche, 145–149, https://doi.org/10.1051/lhb/2003066, 2003.
Chataigner, J. and Michon, J.: Prélèvements quantitatifs sur la ressource en eau (données 2013) (Note de synthèse Bulletin no. 2), BNPE, Agence française pour la biodiversité, 2017.
Chiew, F. H. S. and McMahon, T. A.: Global ENSO-streamflow teleconnection, streamflow forecasting and interannual variability, Hydrol. Sci. J., 47, 505–522, https://doi.org/10.1080/02626660209492950, 2002.
Coron, L., Perrin, C., and Michel, C.: airGR: Suite of GR Hydrological Models for Precipitation-Runoff Modelling, available at: https://webgr.Inrae.fr/en/airGR/ (last access: 27 July 2020), 2017a.
Coron, L., Thirel, G., Delaigue, O., Perrin, C., and Andréassian, V.: The Suite of Lumped GR Hydrological Models in an R package, Environ. Model. Softw., 94, 166–171, https://doi.org/10.1016/j.envsoft.2017.05.002, 2017b.
Crochemore, L., Ramos, M.-H., Pappenberger, F., and Perrin, C.: Seasonal streamflow forecasting by conditioning climatology with precipitation indices, Hydrol. Earth Syst. Sci., 21, 1573–1591, https://doi.org/10.5194/hess-21-1573-2017, 2017.
Day, G.: Extended Streamflow Forecasting Using NWSRFS, J. Water Resour. Plan. Manag., 111, 157–170, 1985.
Delaigue, O., Génot, B., Lebecherel, L., Brigode, P., and Bourgin, P. Y.: Database of watershed-scale hydroclimatic observations in France, Université Paris-Saclay, INRAE, HYCAR Research Unit, Hydrology group, Antony, https://doi.org/10.15454/UV01P1, 2020.
Demirel, M. C., Booij, M. J., and Hoekstra, A. Y.: The skill of seasonal ensemble low-flow forecasts in the Moselle River for three different hydrological models, Hydrol. Earth Syst. Sci., 19, 275–291, https://doi.org/10.5194/hess-19-275-2015, 2015.
Gupta, H. V., Kling, H., Yilmaz, K. K., and Martinez, G. F.: Decomposition of the mean squared error and NSE performance criteria: Implications for improving hydrological modelling, J. Hydrol., 377, 80–91, https://doi.org/10.1016/j.jhydrol.2009.08.003, 2009.
Habets, F., Ackerer, P., Amraoui, N., Augeard, B., Besson, F., Caballero, Y., Dreuzy, J.-R. D., Moigne, P. L., Longuevergne, L., Martin, E., Morel, T., Regimbeau, F., Rousseau, M., Rousseau-Gueutin, P., Thiery, D., Soubeyroux, J.-M., Vergnes, J.-P., and Viennot, P.: Aqui-FR, un système multi-modèle hydrogéologique à l'échelle nationale, Géologues, 187, 105–109, 2015.
Karamouz M. and Araghinejad S.: Drought Mitigation through Long-Term Operation of Reservoirs: Case Study, J. Irrig. Drain. Eng., 134, 471–478, https://doi.org/10.1061/(ASCE)0733-9437(2008)134:4(471), 2008.
Nash, J. E. and Sutcliffe, J. V.: River flow forecasting through conceptual models, part I. A discussion of principles, J. Hydrol., 10, 282–290, https://doi.org/10.1016/0022-1694(70)90255-6, 1970.
Nicolle, P., Pushpalatha, R., Perrin, C., François, D., Thiéry, D., Mathevet, T., Le Lay, M., Besson, F., Soubeyroux, J.-M., Viel, C., Regimbeau, F., Andréassian, V., Maugis, P., Augeard, B., and Morice, E.: Benchmarking hydrological models for low-flow simulation and forecasting on French catchments, Hydrol. Earth Syst. Sci., 18, 2829–2857, https://doi.org/10.5194/hess-18-2829-2014, 2014.
Oudin, L., Hervieu, F., Michel, C., Perrin, C., Andréassian, V., Anctil, F., and Loumagne, C.: Which potential evapotranspiration input for a lumped rainfall–runoff model?: Part 2-Towards a simple and efficient potential evapotranspiration model for rainfall–runoff modelling, J. Hydrol., 303, 290–306, https://doi.org/10.1016/j.jhydrol.2004.08.026, 2005.
Risva, K., Nikolopoulos, D., Efstratiadis, A., and Nalbantis, I.: A Framework for Dry Period Low Flow Forecasting in Mediterranean Streams, Water Resour. Manag., 32, 4911–4932, https://doi.org/10.1007/s11269-018-2060-z, 2018.
Schaefer, J. T.: The Critical Success Index as an Indicator of Warning Skill, Weather Forecast., 5, 570–575, https://doi.org/10.1175/1520-0434(1990)005<0570:TCSIAA>2.0.CO;2, 1990.
Vidal, J.-P., Martin, E., Franchistéguy, L., Baillon, M., and Soubeyroux, J.-M.: A 50-year high-resolution atmospheric reanalysis over France with the Safran system, Int. J. Climatol., 30, 1627–1644, https://doi.org/10.1002/joc.2003, https://doi.org/10.1002/joc.2003, 2010.
- Abstract
- Introduction
- Material and methods
- The low-flow forecasting tool PREMHYCE
- Case study: 2017 low-flow forecasts for the Ill River at Didenheim
- Discussion and conclusion
- Data availability
- Author contributions
- Competing interests
- Special issue statement
- Acknowledgements
- Financial support
- References