the Creative Commons Attribution 4.0 License.
the Creative Commons Attribution 4.0 License.
 | 16 Sep 2020
A new approach to aquatic ecosystem monitoring of the Ob river
Aleksandr Andreevich Tskhai
Aleksandr Vasilievich Puzanov
Nelley Mikhailovna Kovalevskaya
Vladimir Viktorovich Kirillov
An integrated approach to aquatic ecosystem monitoring is being developed for the Ob river. The novelty of the approach is in transition to high-performance computing (HPC) under processing of remote sensing data and modeling of aquatic ecosystem degradation. Classes of optically complex surface waters of the Gulf of the Kara Sea – the Ob Bay are studied on the basis of the fuzzy cluster analysis of water objects emission. A ten-year dynamics of concentrations of optically active substances was estimated using the neural network simulation. The application of the structural-dynamic model allowed explaining the long-term trend in the development of the ecosystem of the Novosibirsk reservoir, the largest one in the Ob river basin.
- Article
(16140 KB) - Full-text XML
- BibTeX
- EndNote


It includes (1) effective neural models for processing satellite data on ecosystem component characteristics; (2) advanced algorithms for big remote sensing data management; (3) original structural-dynamic adaptive models of biogeochemical cycles of transformation of limiting elements able to reconstruct the development of hydrobionts communities when the data are incomplete and uncertain. Only such components ensure the implementation of the new approach to real-time environmental monitoring.
Generalization, standardization, serialization of data, etc. are an inevitable in the technological development of remote sensing. For subsequent application of remote sensing data from various sources additional tools are required. To study the distribution of chlorophyll a (CHL) and the absorption of dissolved organic matter (DOM), we integrate satellite data from RapidEye (5 m: 4 August 2015), Terra/ASTER (15 m: 7 July 2015, 16 July 2015, 4 August 2015) and Landsat-8 (30 m: 31 July 2015).
Based on bands of RapidEye (RedEdge and Green) satellites, heuristic models demonstrate the highest determination coefficient for defining of CHL concentrations using the in-situ data (Figs. 1, 2).
The models for CHL concentration determination with the use of Terra / ASTER data suggest concurrent application of Green and NIR data (Figs. 1, 3). The use of Landsat-8 data gives similar results for CHL estimates (Figs. 1, 4). Landsat-8 data-based models for evaluation of DOM absorption is distinguished by the efficiency of the CoastalBlue range corresponding to the DOM absorption maximum (Bukanova, 2014).
The obtained regression relationships are evidence of the necessity to consider simultaneously the data on the following ranges: for CHL concentrations – Green and RedEdge (or Red), for DOM absorption coefficient – CoastalBlue and Green.
Classification of the brightness space of features on the basis of the fuzzy cluster analysis of water objects emissivity is an important tool for the preliminary analysis of images of optically complex waters (Moore et al., 2014; Erlov, 1976). A characteristic curve in the brightness characteristic space corresponds to each cluster. In this case, the same raster element i(i=1, N) can belong to several (or all) clusters . Such a fuzzy clustering is formalized through the property matrix U=(uij) consisting of property levels uij:
High turbidity of the most water area under study corresponds to the 6th, 7th and 8th classes of optical classification.
The Novosibirsk reservoir- the largest in Western Siberia, was used for calibration of the aquatic ecosystem model (Tskhai and Ageikov, 2020). This reservoir was constructed on the Ob river in 1957 (the reservoir site is located upstream of the Novosibirsk). It is used mainly for energy production, navigation, and water supply. The average depth is 8.2 m; water storage and water-surface area at the normal pool level are 8.8 and 1070 km2, respectively; and the active storage is 4.4 km3.
The lake-like part of the reservoir is where the quality of water flowing into the lower pool is determined. At normal pool level, the lake-like part of the reservoir contains 73 % of the total amount of the reservoir water. With the reservoir drawdown, the share of the lake-like part increases to 90 %.
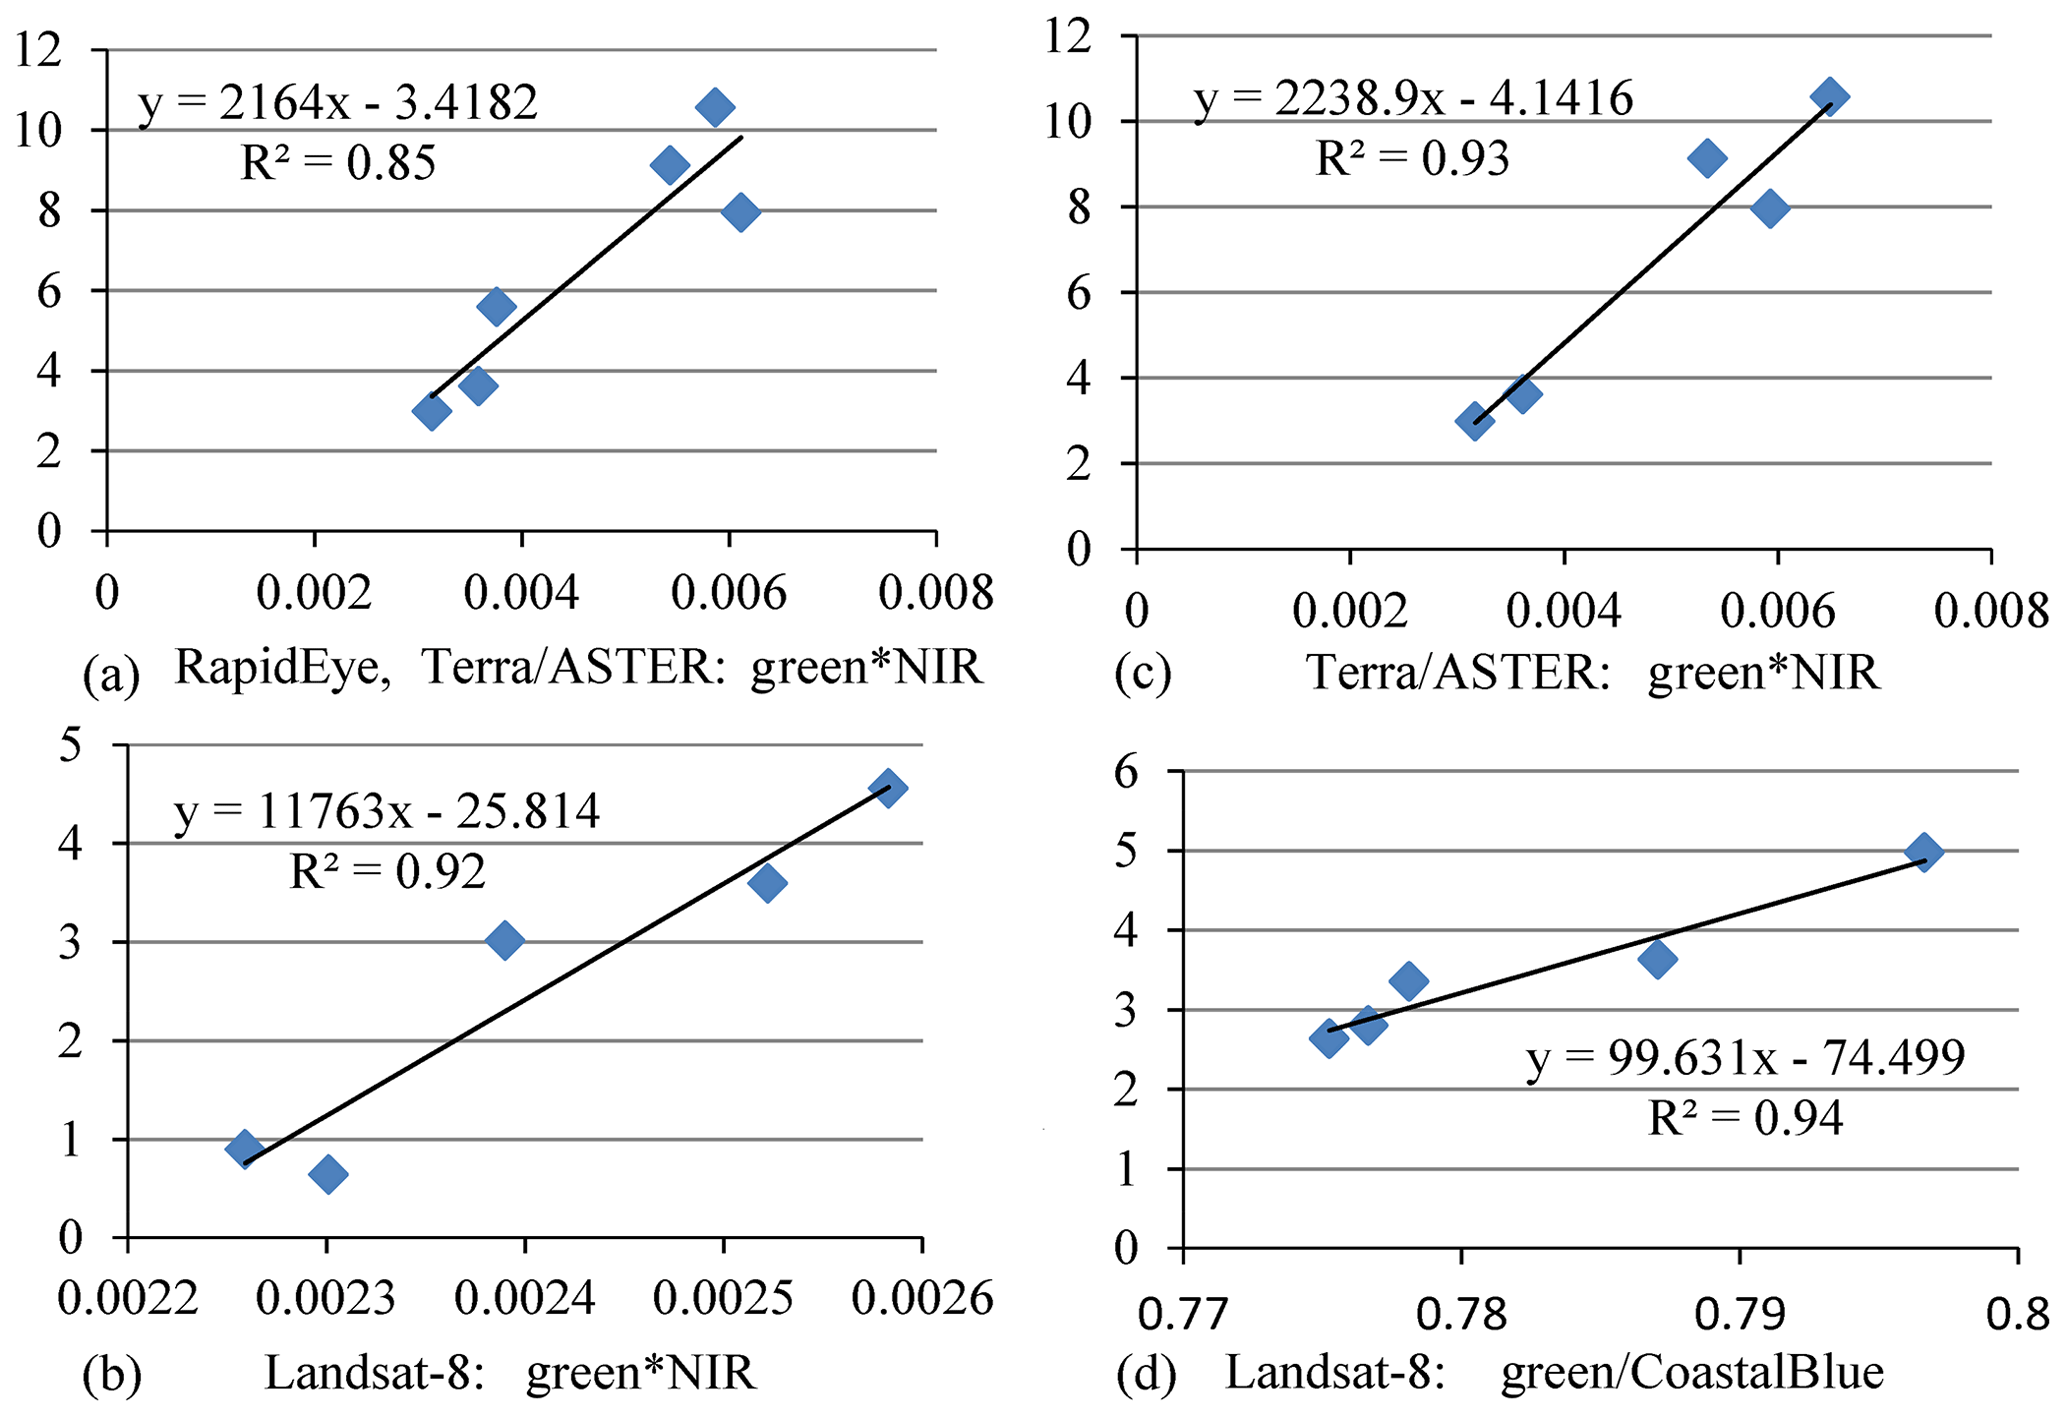
Figure 1Regression dependences of in-situ data and satellite observations: (a–c) CHL concentrations, mg m−3, (d) DOM absorption coefficient, 1 m−1.

Figure 2CHL distribution according to RapidEye data, mg m−3 (4 August 2015).

Figure 3CHL distribution according to Terra/ASTER data, mg m−3 (16 July 2015).
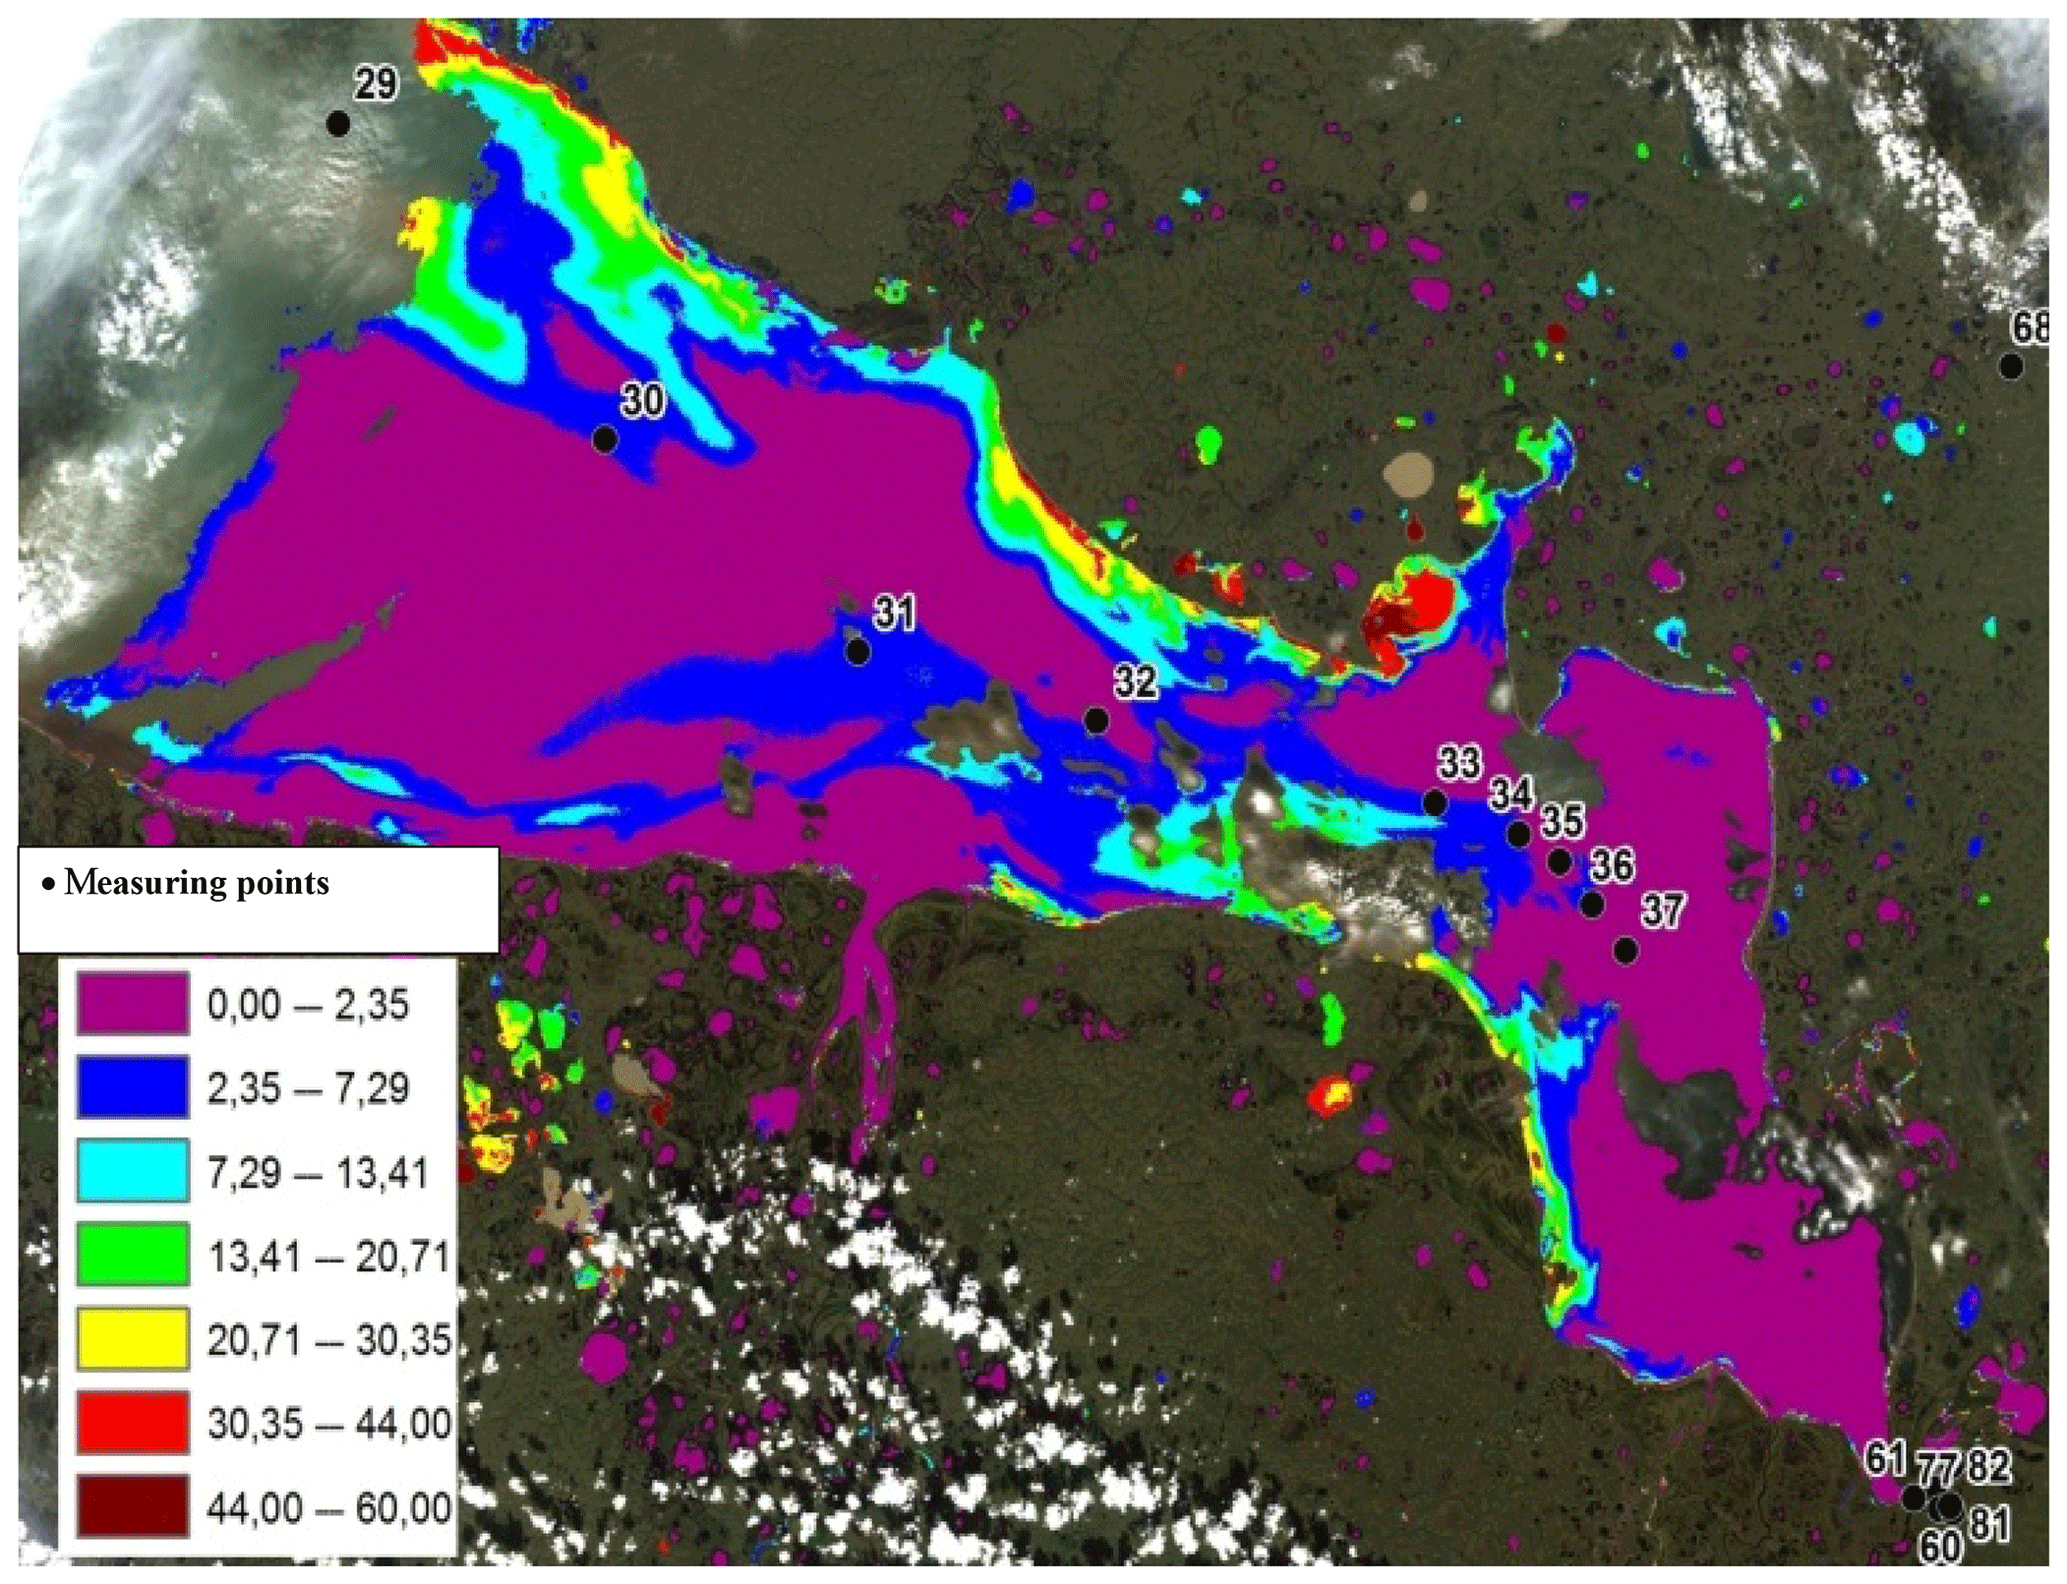
Figure 4CHL distribution according to Landsat-8 data, mg m−3 (31 July 2015).
In different parts of the water area, CHL concentrations vary greatly (Fig. 5). The noted earlier tendency (Gaevsky et al., 2009) in phytoplankton decrease is observed as it moves from the Ob delta towards the Kara Sea (Fig. 6). This is used for the neural model validation as a confirmation of the zonal CHL distribution depending on a salinity gradient and a biogenic element concentration (Sukhanova et al., 2010) in case of desalinated and frontal zones as well as a shallow shelf occurrence.
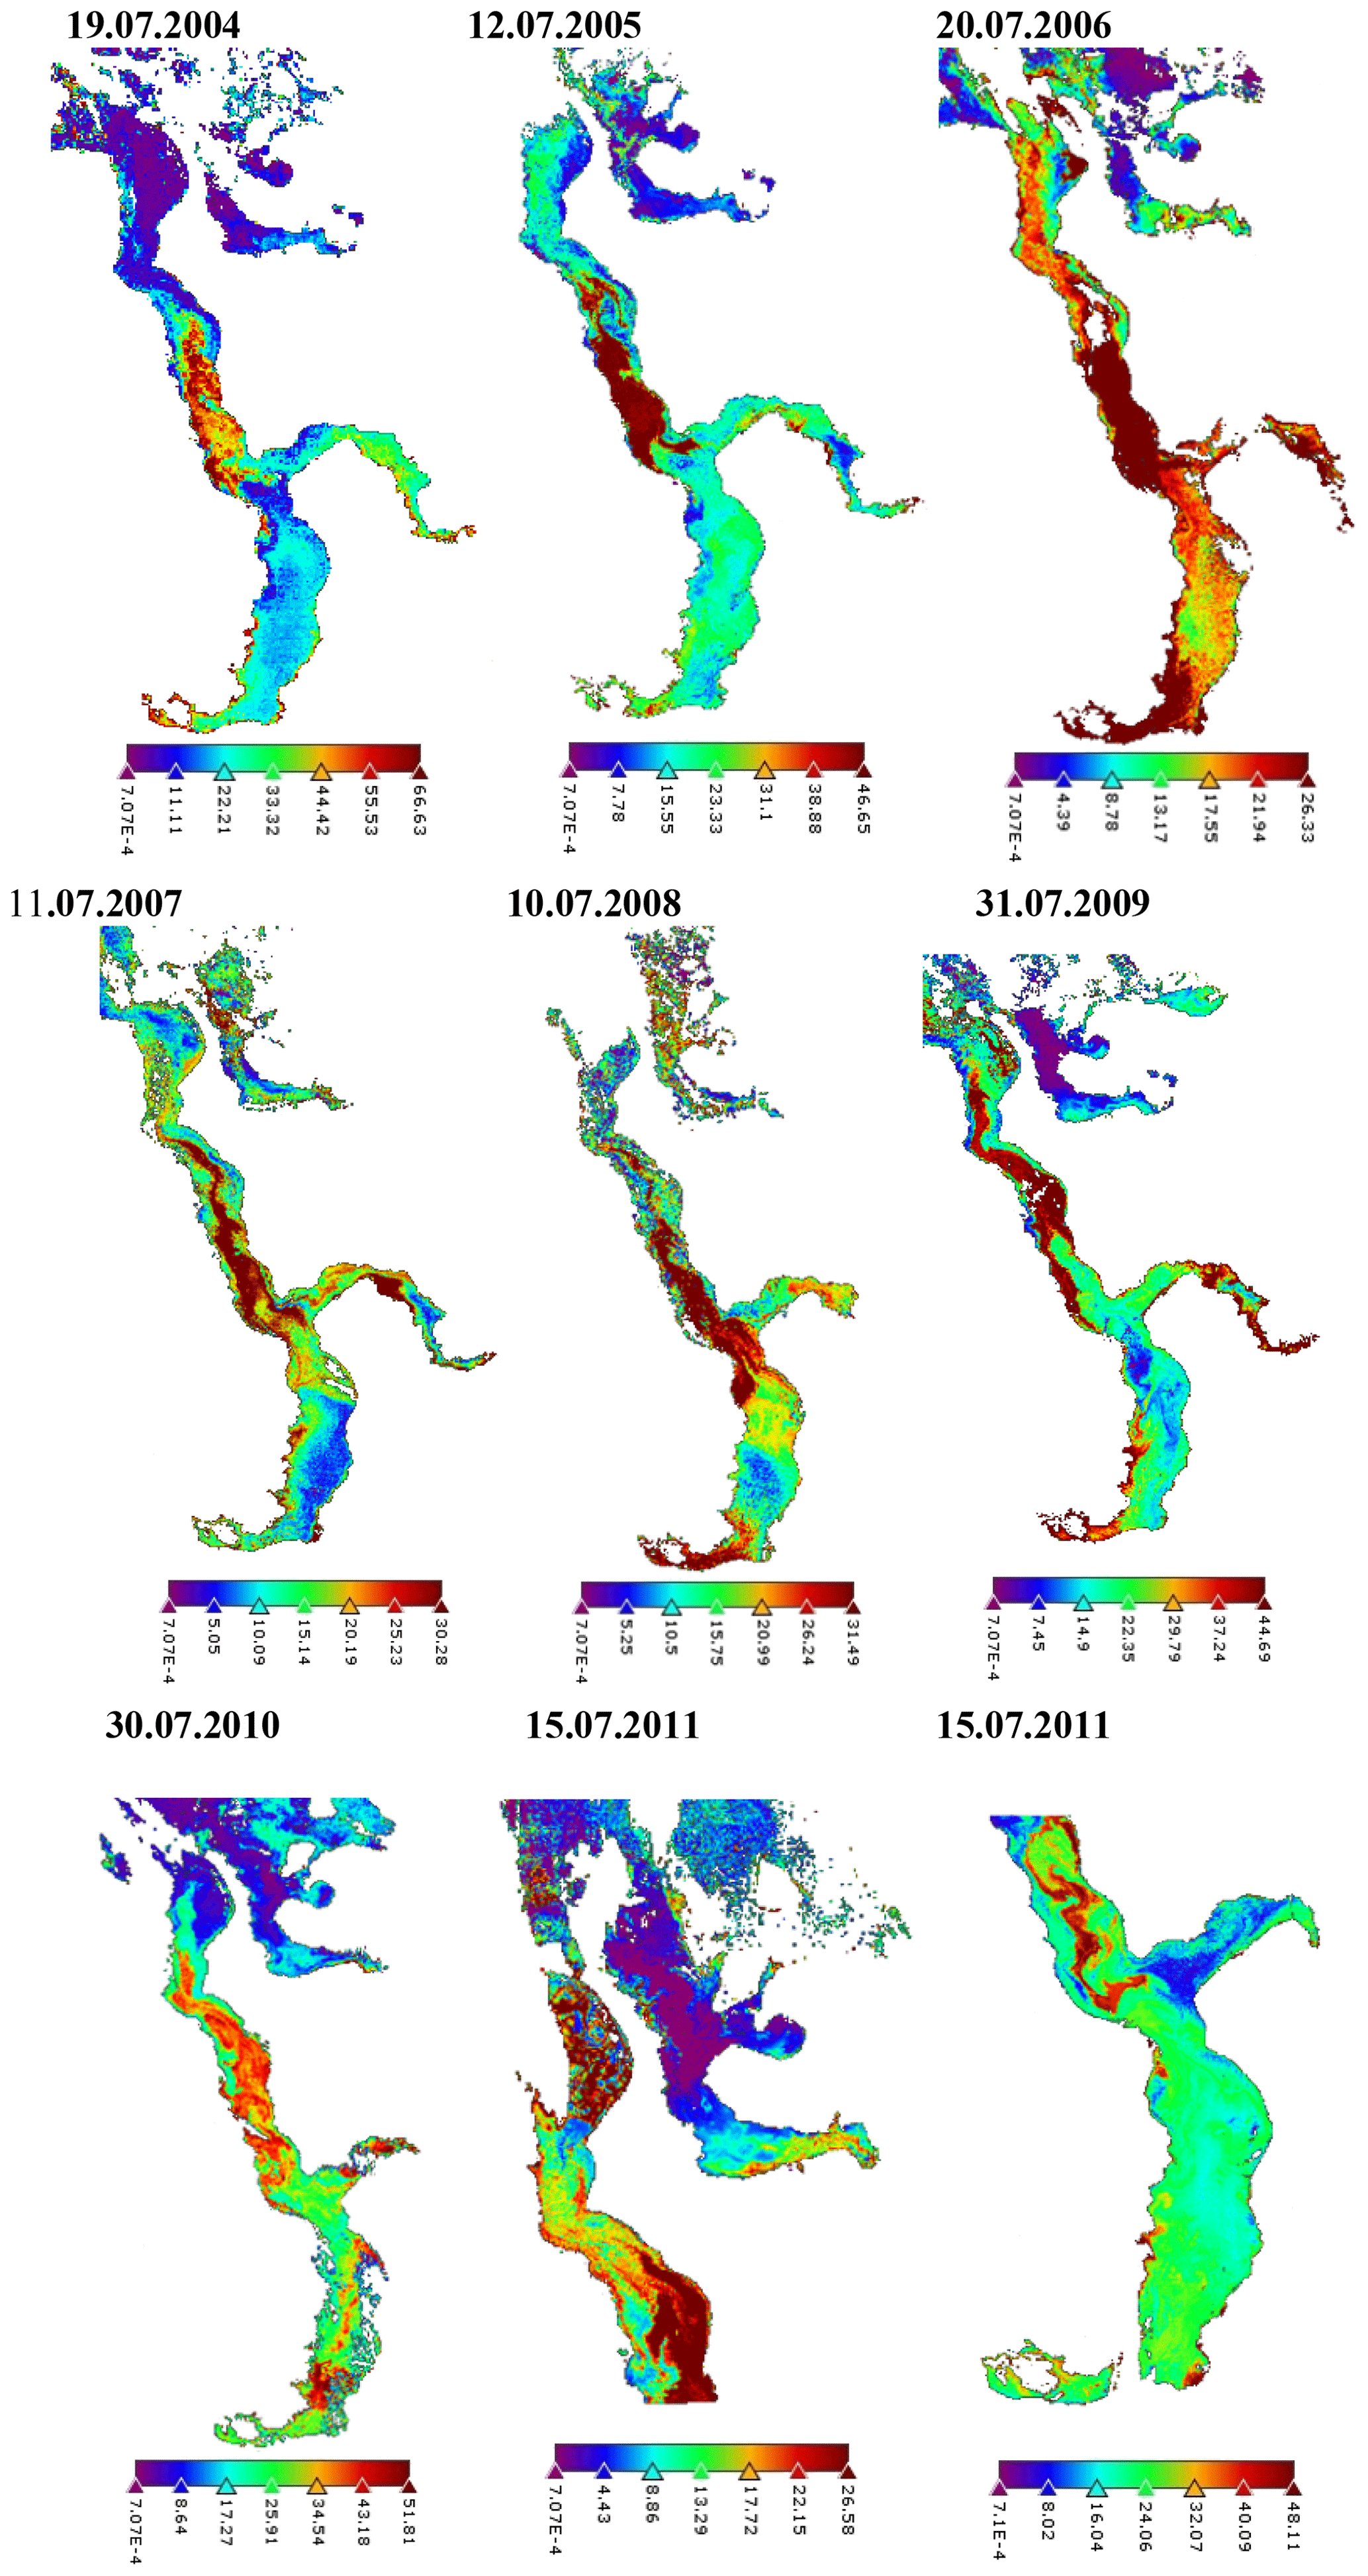
Figure 5CHL distribution, mg m−3 (2004–2011).
A common feature of optical properties of these waters is the influence of river water propagation, biological processes and gravitational deposition of solid matter (SM). The CHL content in the frontal zone is much lower than in the river. However, the structure of CHL concentration fields in this zone is characterized by extreme complexity at dynamic changes in the frontal zone's size (Flint and Poyarkov, 2015). Maximal values of SM model concentrations are observed in the mouth of the Ob, Taz and Gydan Bays.
Maximum of DOM absorption falls on the main water stream from the Ob, Taz and Gydan catchments. The Taz water area is characterized by the least absorption coefficient. These waters extend for several kilometers to the north. The cooler and denser waters of the Taz Bay flowing along the right bank meet relatively warm regional stream generating a perturbance zone.

Figure 6Averaged CHL concentrations in the Ob Bay (green – river, red – middle, blue – sea parts).
However, large gradients of SM and DOM in the studied water area lead to significant contrasts of transparency associated with a turbidity level in the mouth of the Ob, Taz and Gydan Bays. Huge inflow of SM and DOM with river waters brings to a large contrast between the first optical depth (0.1–11 m) and turbidity (0.4–89.4 FNU).
The dynamics study of model values (2003–2011) shows that SM concentrations and DOM absorption increase in the mouth and middle part of the Ob and Gydan Bays,
Calculations with the use of the aquatic ecosystem model (Fig. 7) of the 5th generation (Tskhai and Ageikov, 2020). demonstrate a clear increase in phytoplankton content during summer-autumn in case of several succeeding low-water years. Interestingly, it occurs starting from the 3rd year; curves of the first two years do not reflect such a difference (Fig. 8). The calculations confirm the revealed long-term trends in increasing bloom intensity and allow us to expect a probable shift of its peak to the earlier time in case of several succeeding low-water years. Moreover, all this ensures the assessment of changes in water body eutrophication depending on hydrological conditions.
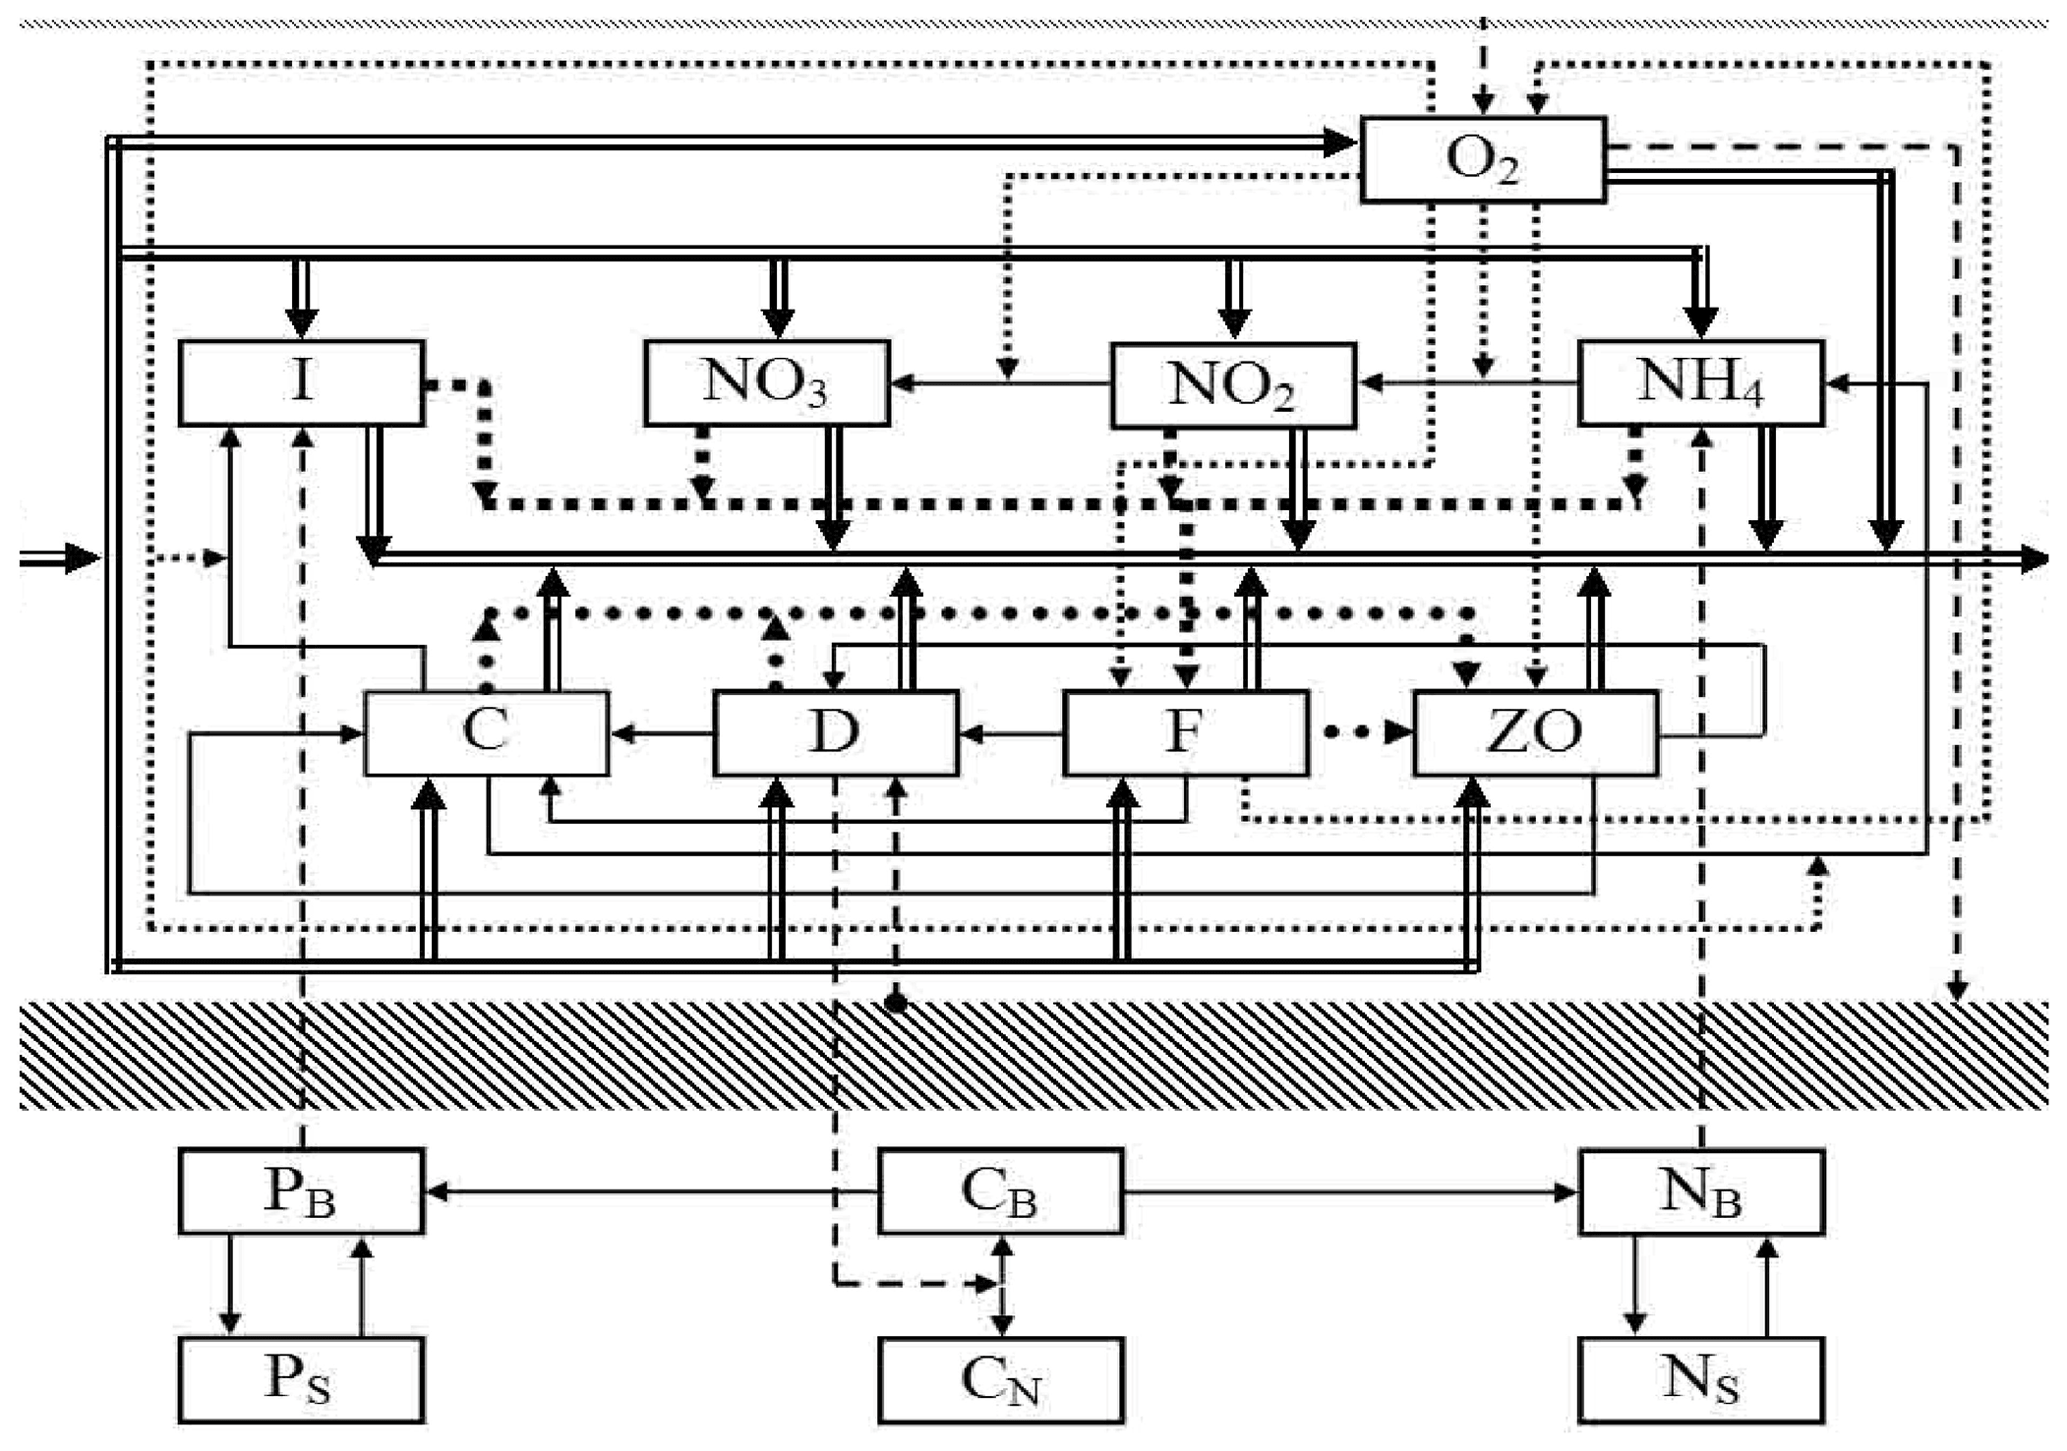
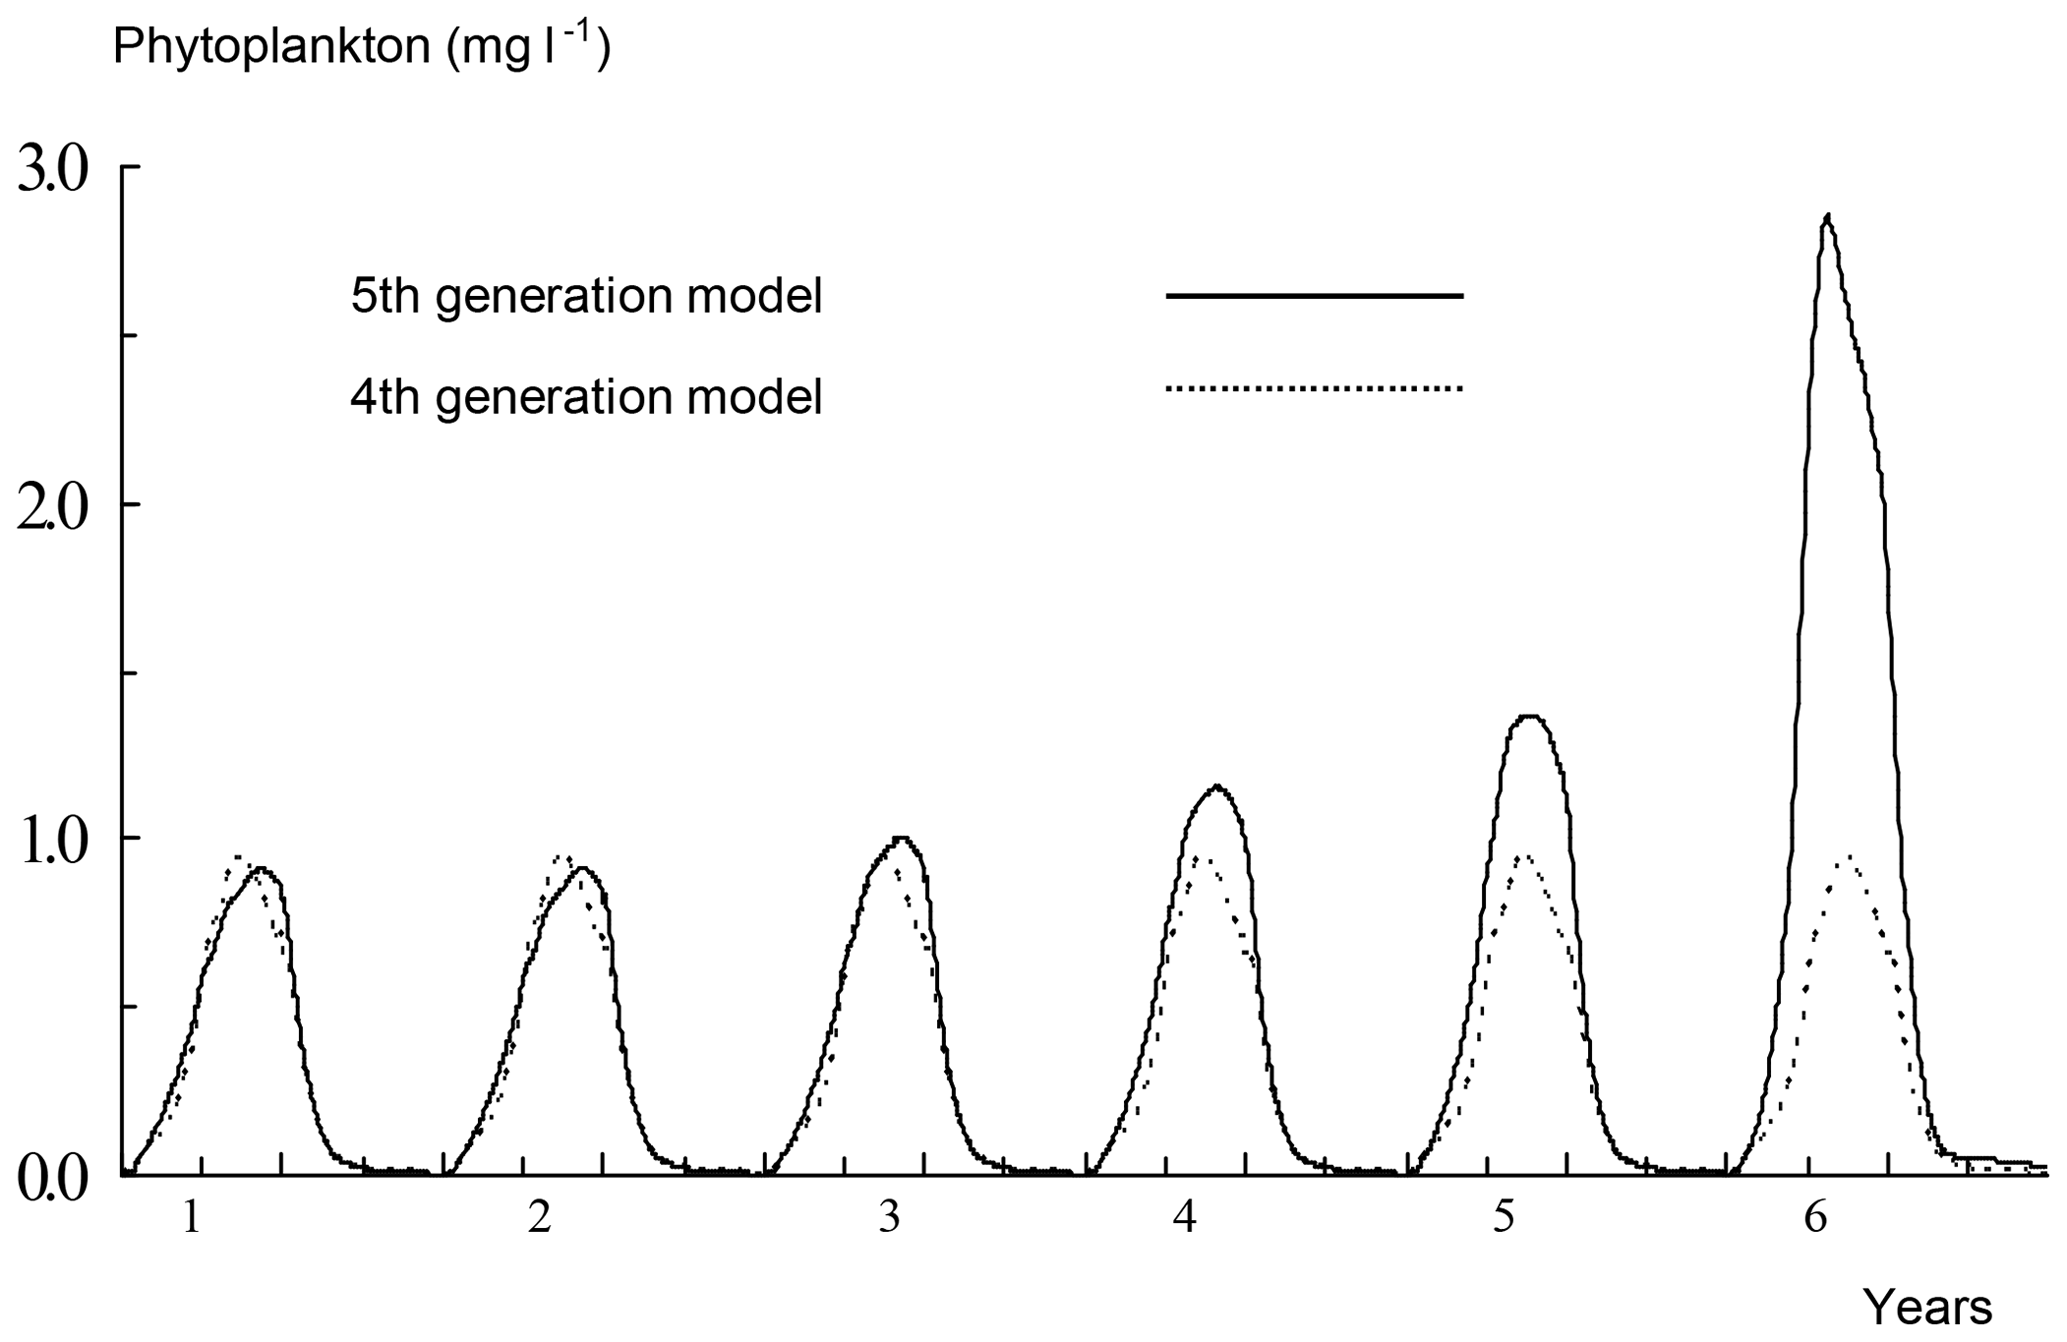
Figure 8Modeling of inter-annual variability of phytoplankton content in the Novosibirsk reservoir (1981).
High-performance processing of satellite information made it possible to obtain regular time series of MERIS data (2003–2011) processed by the open software environment BEAM-VIASAT/ESA. The method for fuzzy features clustering in the brightness space is applied to define the distribution of main optical classes on the basis of NS-algorithms for optically complex surface waters.
The use of efficient information technologies in satellite data processing allowed:
-
to specify optical classes of water and to present changes in optically active substances as well as in primary hydro-optical characteristics for almost a ten-year period;
-
to present spatial details of the structure of the estuary frontal zone in the Ob Bay site of sea and river waters mixing;
-
to reveal inter-annual variability of CHL, SM and DOM in the mouth, middle part, estuary, adjacent shelf of the Ob and Gydan Bays.
-
to approximate the distribution of CHL and SM concentrations by a logonormal function, whereas DOM - by a bimodal function; to obtain the features of their relative stability; to develop the aquatic ecosystem model of the 5th generation for establishment of long-term trends;
-
to prove the preference of using these ranges (Green, RedEdge) CHL, (CoastalBlue, Green) DOM.
-
to confirm proposals that the CHL content in the frontal zone of the Ob Bay is much lower than in its river part.
The satellite data used in research is derived from the results of the ESA CoastColour Project – MERIS Case2 Water Processing – http://www.coastcolour.org (last access: 16 July 2020). The modeling data availability is via reference to the publications on these studies upon on reasonable request.
AAT developed the model of development for aquatic ecosystem and wrote the article. AVP and VVK selected the research place and provided planning and administrative support. NMK executed the satellite data processing and analysis.
The authors declare that they have no conflict of interest.
This article is part of the special issue “Hydrological processes and water security in a changing world”. It is a result of the 8th Global FRIEND–Water Conference: Hydrological Processes and Water Security in a Changing World, Beijing, China, 6–9 November 2018.
The study was carried out within the Research Program of IWEP SB RAS and funded by the Russian Foundation for Basic Research and the government of Altai Krai, of the Russian Federation (grant no. 18-41-220002).
Bukanova, T. V.: Trends in eutrophication of the South-Eastern Baltic Sea according to satellite data: Diss. PhD, AB IO RAS, Kaliningrad, Russia, 142 p., 2014 (in Russian).
Erlov, N. G.: Marine optics, 2nd ed., Elsevier Sci. Ltd, New York, USA, 231 p., 1976.
Flint, M. V. and Poyarkov, S. G.: Comprehensive research on the Kara Sea ecosystem (128th cruise of Research Vessel “Professor Shtokman”), Oceanology, 55, 657–659, https://doi.org/10.1134/S0001437015040074, 2015.
Gaevsky, N. A., Semenova, L. A., and Matkovsky, A. K.: Trophic status of waters of the ecosystem of the Ob-Taz estuary region in terms of phytoplankton, Bull. Ecol. Forest. Landsc. Stud., 10, 170–179, 2009 (in Russian).
Moore, T. S., Dowell, M. D., Bradt, S., and Verdu, A. R.: An optical water type framework for selecting and blending retrievals from bio-optical algorithms in lakes and coastal waters, Remote Sens. Environ., 143, 97–111, https://doi.org/10.1016/j.rse.2013.11.021, 2014.
Sukhanova, I. N., Flint, M. V., Mosharov, S. A., and Sergeeva, V. M.: Structure of the phytoplankton communities and primary production in the Ob river estuary and over the adjacent Kara sea shelf, Oceanology, 50, 743–758, 2010.
Tskhai, A. A. and Ageikov, V. Yu.: Simulating Variations in Reservoir Eutrophication Level by Reproducing Biogeochemical Cycles, Water Resour., 47, 147–155, https://doi.org/10.31857/S0321059620010149, 2020.