the Creative Commons Attribution 4.0 License.
the Creative Commons Attribution 4.0 License.
 | 16 Sep 2020
Climate change impact on water resources in Klong Yai River Basin, Thailand
Chaiwat Ekkawatpanit
Weerayuth Pratoomchai
Chatchapol Khemngoen
Patchanok Srivihok
There is a 95 % scientific consensus that human activities contributed to climate change and altered hydrological processes. This study focused on a regional scale climate change impact assessment on water resources in the Klong Yai River basin in Thailand using multiple Global Climate Models (GCMs) under 3 scenarios of greenhouse gas emission called the Representative Concentration Pathway (RCPs), i.e., low (RCP2.6), intermediate (RCP4.5), and high (RCP8.5) scenarios. According to the projections, surface air temperature will increase relative to the reference period (1991–2000). Maximum surface air temperature is projected to increase around 0.3–1.35 ∘C. Precipitation in the near future (2017–2026 and 2027–2036) shows an increasing trend. The projected precipitation and temperature were used in the SWAT model for the Klong Yai River basin in order to assess the amount of inflow into reservoirs under the climate change conditions. Despite the future projections still have an uncertainty, but it is useful as a guideline for managing of our water resources and planning.
- Article
(6733 KB) - Full-text XML
- BibTeX
- EndNote


Greenhouse gas concentration change in the atmosphere is a major cause of climate change and climate variation (Stocker et al., 2013; Hanson and Cramer, 2015). Since the industrial revolution, human added amount of greenhouse gases into the atmosphere by burning fuel fossil, deforestation and other activities (Alcamo, 2007). The average global temperature has increased 0.6 ∘C in the past three decades and 0.8 ∘C in the past century due to greenhouse gas emissions (Hansen et al., 2006). In Thailand, Limjirakan and Limsakul (2012a), A collected the observed data and analysed the trend of temperature change. The results showed the increase in minimum and maximum temperature of 0.26 ∘C per decade and 0.23 ∘C per decade respectively. Moreover, Limjirakan and Limsakul (2012b) collected temperature and evaporation data over the whole country. The statistical analysis result showed that the mean annual temperature is increasing with the 95 % of confidence level.
This research aims at evaluating the effect of climate change towards water resources assessment in Klong Yai River basin in the near future (2017 to 2036). 3 GCMs out of the total 10 GCMs that showed good performance to represent/mimic past climate patterns in the study were selected for assessing climate change impacts. This study was conducted under 3 climate change sceanrios, i.e., RCP2.6, RCP4.5, and RCP8.5. For the estimate of inflow into the reservoirs in the basin, SWAT model, which is a commonly used hydrological model, was applied to simulate the hydrological components in the future.
The Klong Yai River basin covers about 1800 square kilometers of watershed area as shown in Fig. 1. It is the sub-basin of the East coast watershed. The Northern part of the basin is the mountain range whereas the south is adjacent to the gulf of Thailand. River delineation lie along the north-south direction based upon the topography. There are 3 reservoirs in the Klong Yai River basin, namely Dok Krai reservoir (storage capacity of 72.5 million cubic meter), Nong Pla Lai reservoir (storage capacity of 164.7 million cubic meter) and Klong Yai reservoir (storage capacity of 8.5 million cubic meter). The annual precipitation was varied from 1300 to 2000 mm yr−1 and the annual stream flow was approximately 577 Mm3.
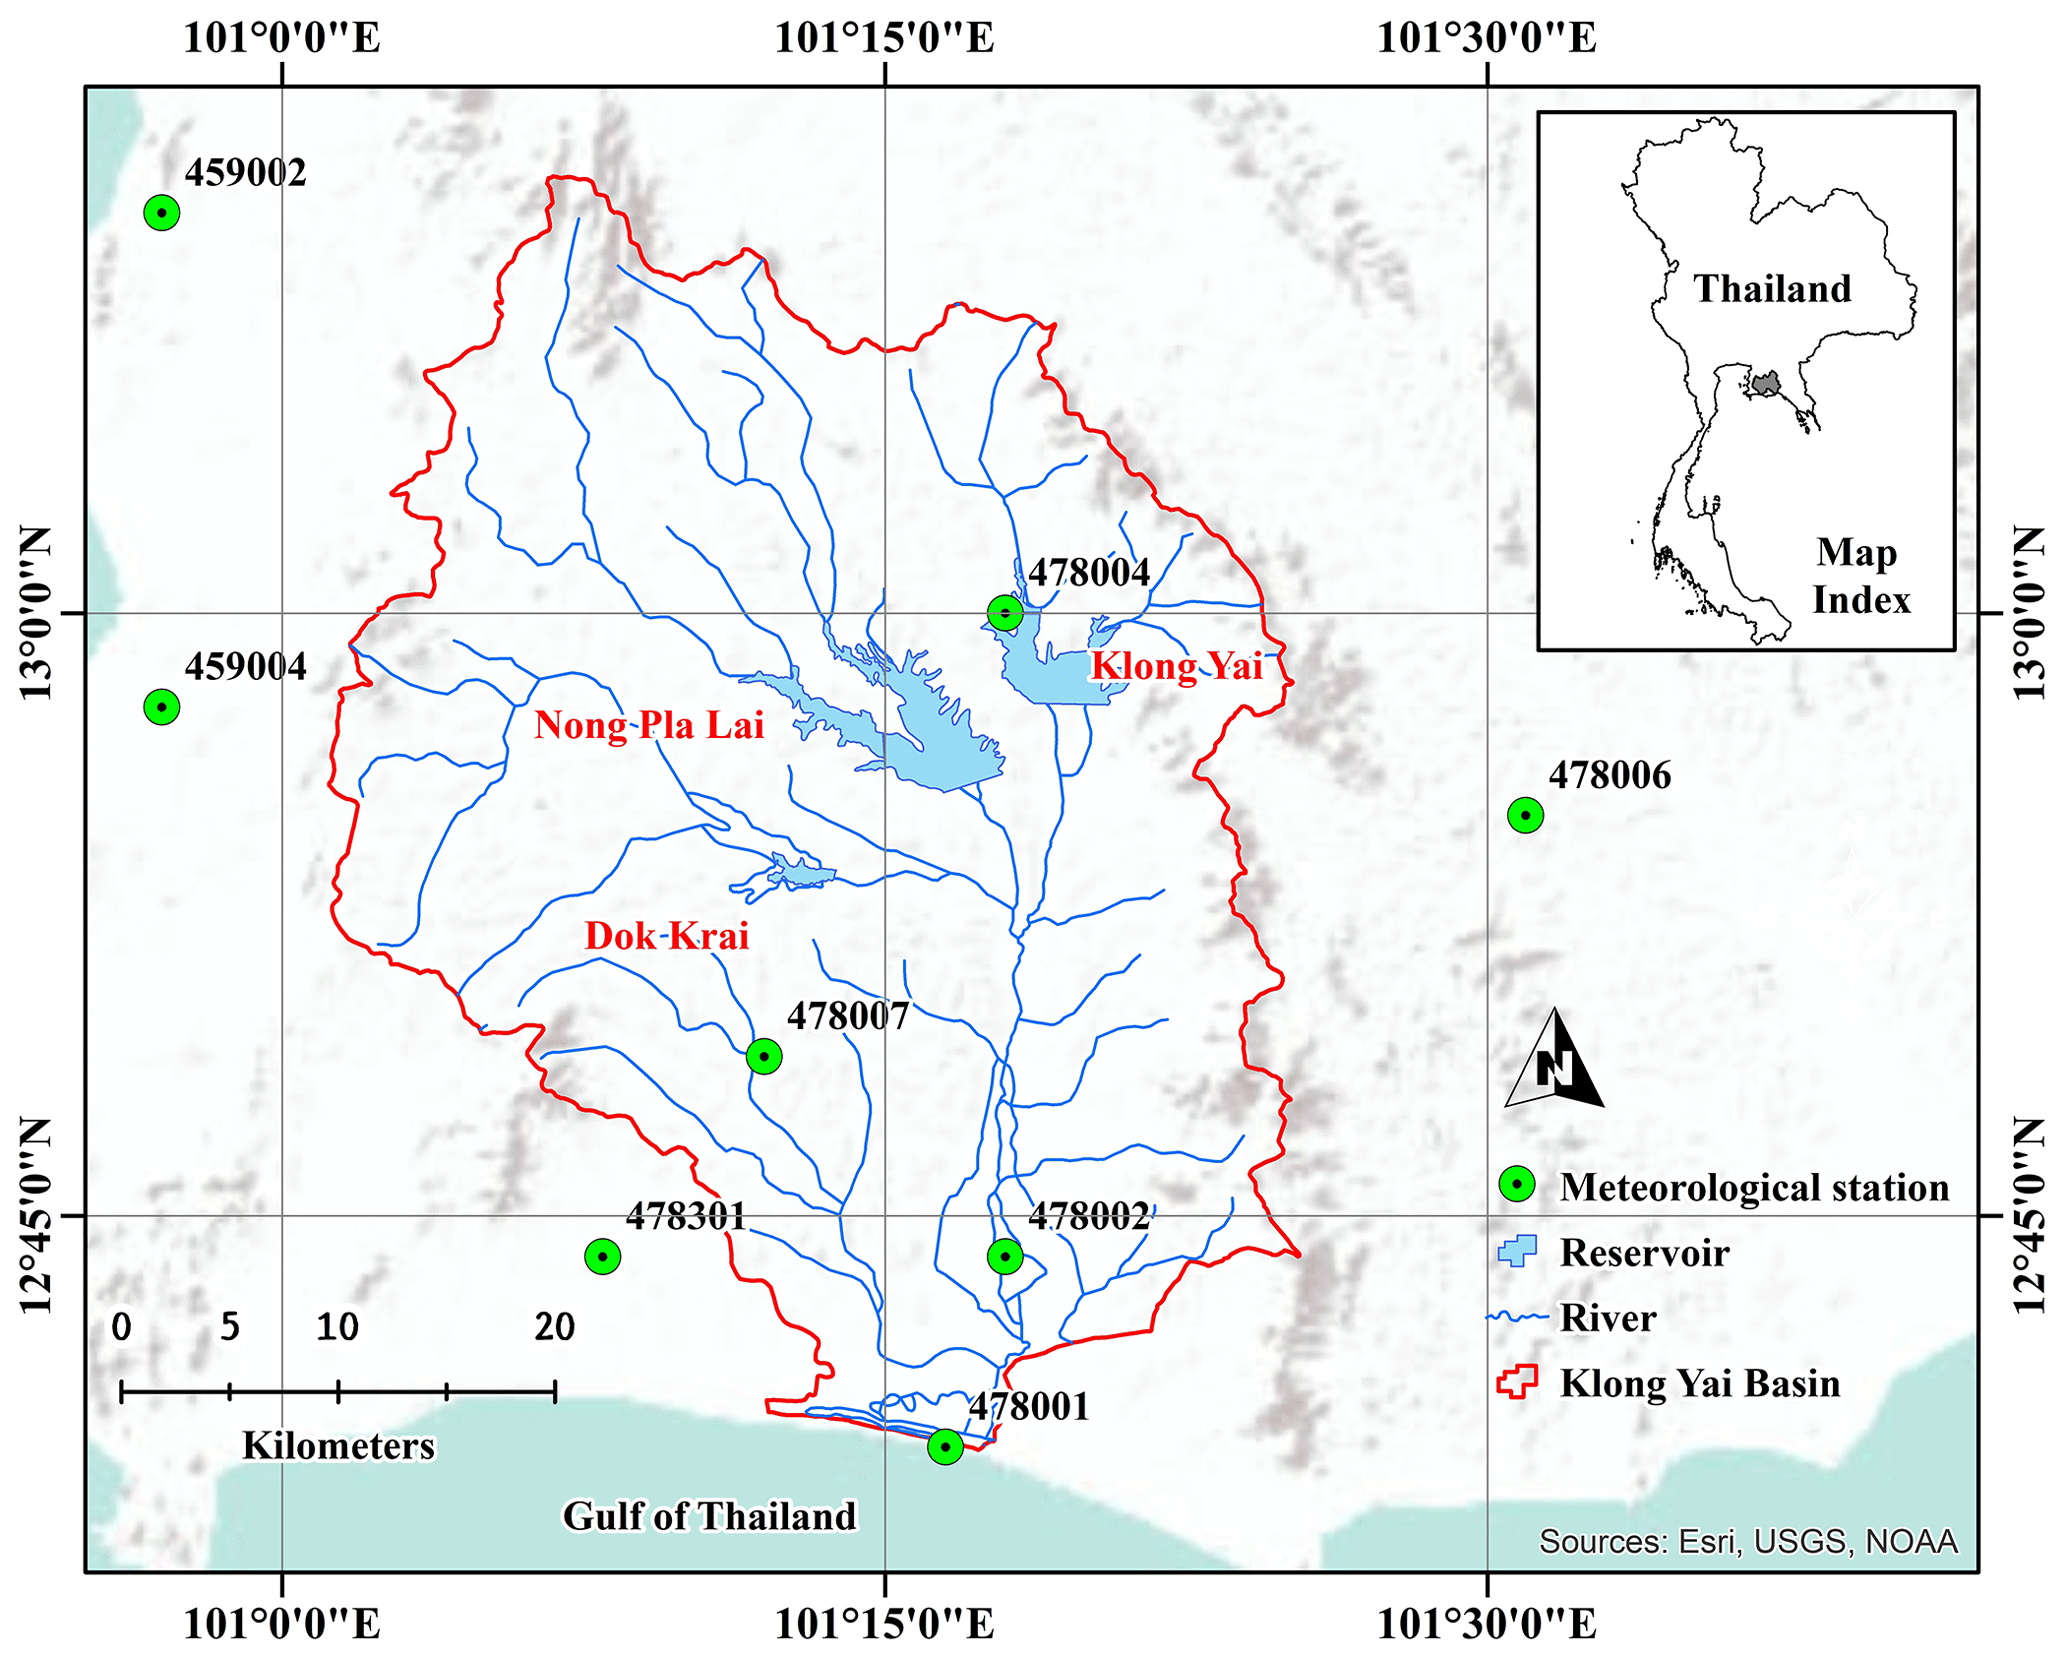
Figure 1Location of the Klong Yai River basin in Thailand.
Performance based concept is used for the GCMs selection. It was a comparison between 1991–2000 GCM results and 1991–2000 observed data for rainfall and temperature in mean monthly basis. A GCMs that shows good performance to mimic observed climate patterns will be chosen (Lee and Wang, 2012; Watanabe, 2014).
In this study, rainfall is the most sensitive patterns and considered as a critical criterion for the GCMs selection. Table 1 shows the list of GCMs that use in the study. Since the improper of horizontal resolution of original GCMs and hydrological aspects of the study area; therefore, downscaling and bias correction are mandatory.
A simple 4-point linear interpolation and a so called shifting and scaling technique were applied for downscaling and bias correction (e.g. Lehner et al., 2006; Hanasaki et al., 2013). This is one of the simplest and most popular techniques for correcting biased GCMs data. Hanasaki et al (2013) also expressed this method in mathematical terms for surface air temperature and precipitation (rainfall) as shown in Eqs. (1) and (2):
where T is temperature, P is precipitation, obs is 10 year actual record data in the study area (1991–2000), baseline is data obtained from GCMs in 1991–2000, and future is data obtained from GCMs in 2017–2026 and 2027–2036.
Table 1List of the 10 GCMs used in this study.
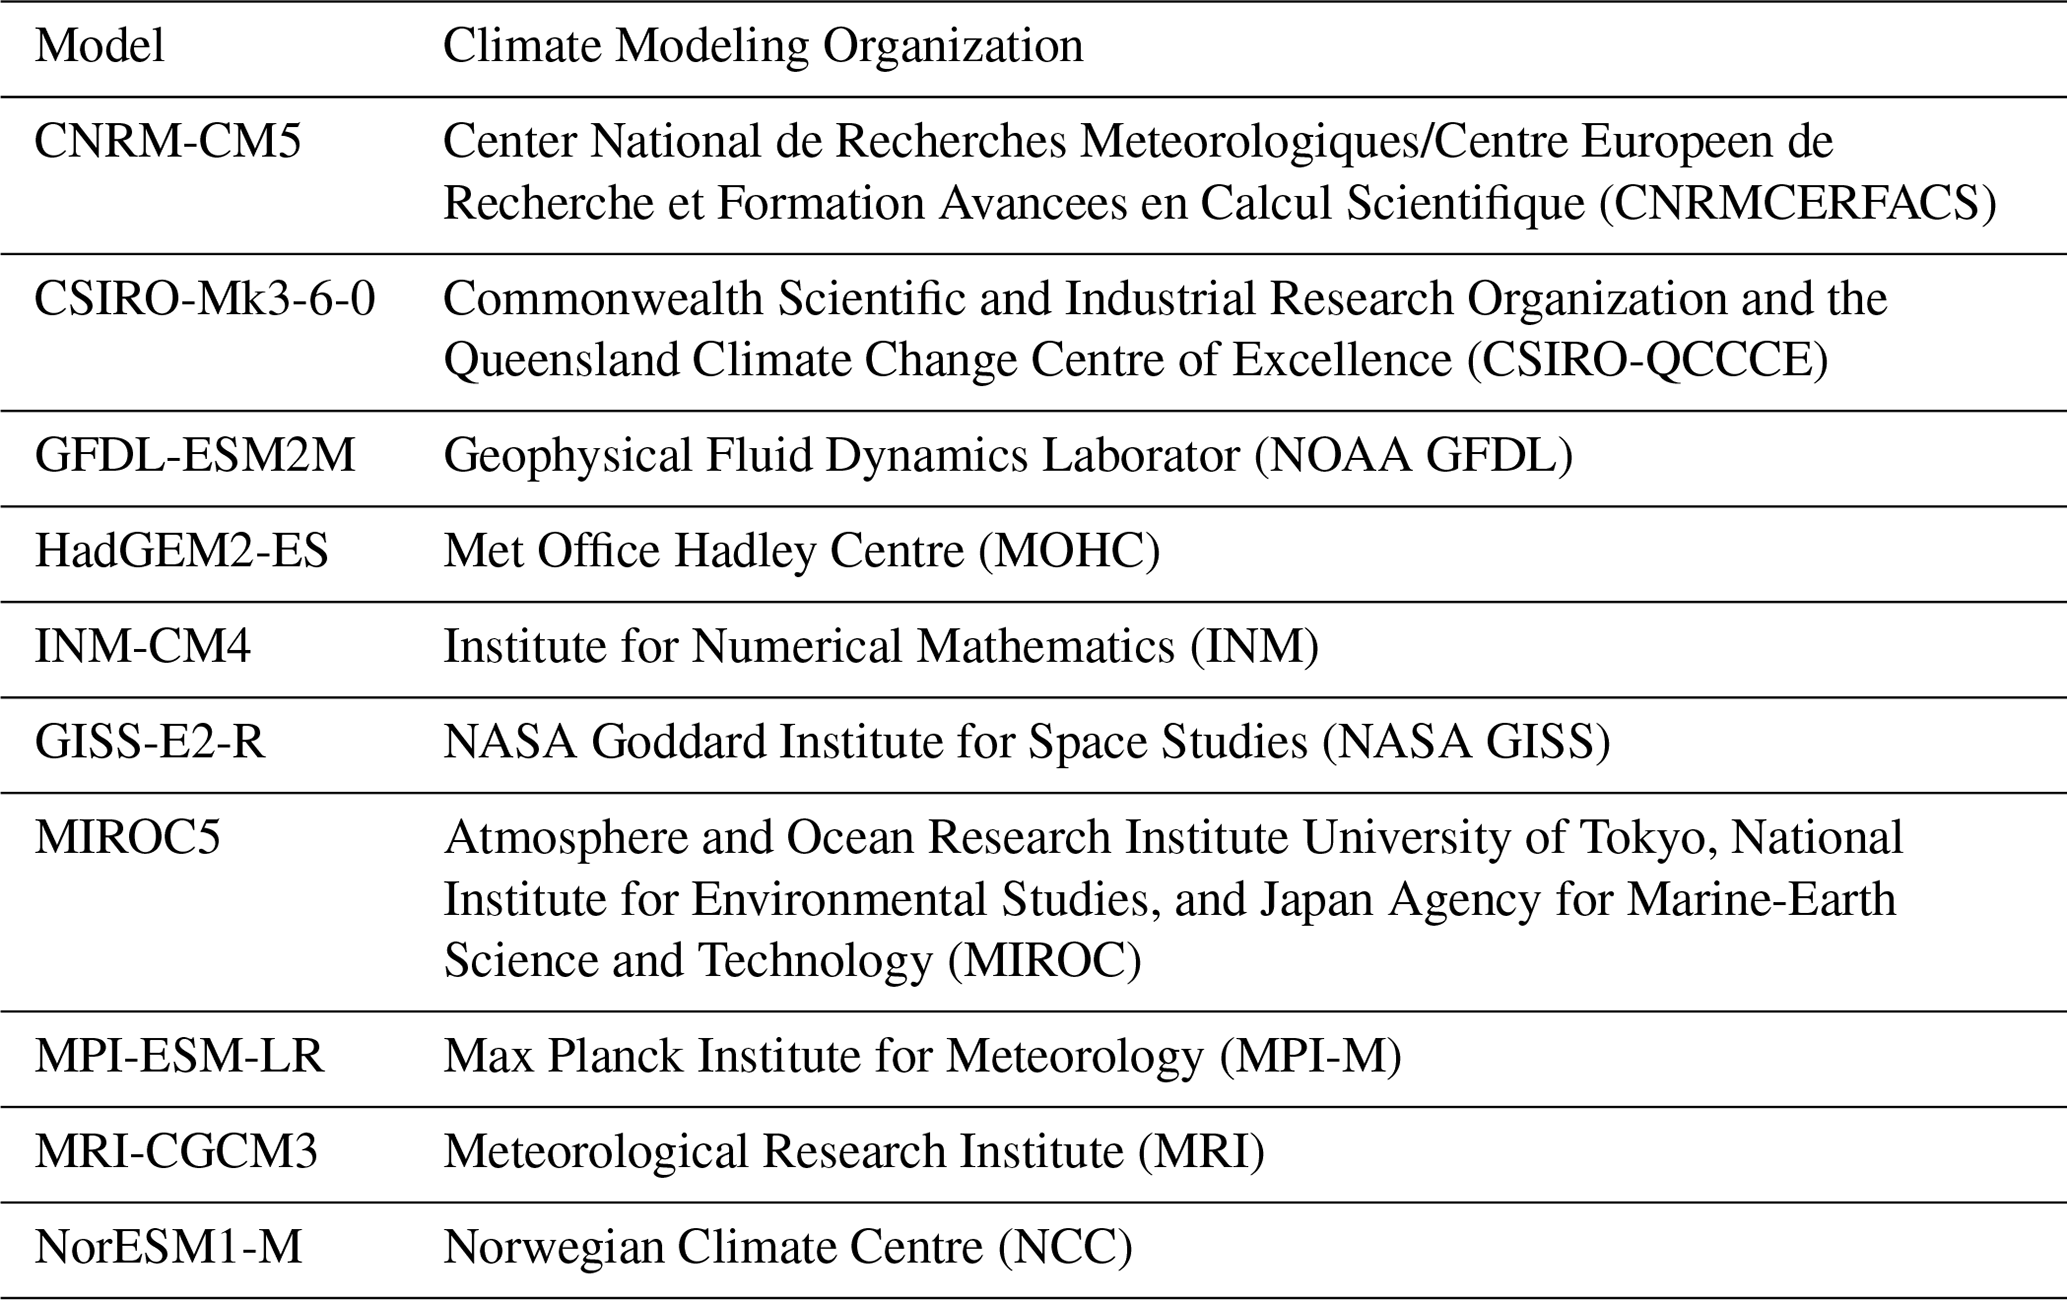
Source: Coupled Model Intercomparison Project 5 (CMIP5).
This study aims at evaluating the future inflow into the reservoirs changes using the application of Soil and Water Assessment Tool or SWAT model. It is a physically semi-distributed hydrological model which was developed by Arnold et al. (1998). This model requires input data from physical features of a watershed such as Digital Elevation Model (DEM) or topography, weather data, soil data, land use land cover, and model parameters. SWAT model can simulate many processes related to soil and water, for example, surface and sub-surface runoff, soil erosion and sedimentation, impact of soil and land use changes on water resources. However, streamflow simulation was the main focus in this study. Surface runoff was calculated using the SCS curve number method. The potential evapotranspiration was based on Penman-Monteith method (Monteith, 1965). The hydrological cycle that simulated by the SWAT model was based on the water balance concept as expressed in Eq. (3):
where SWt is the final soil water content (mm), SW0 is the initial soil water content on day i (mm), t is the time (d), Rday is the amount of precipitation on day i (mm), Qsurf is the amount of surface runoff on day i (mm), Ea is the amount of evapotranspiration on day i (mm), wseep is the amount of water entering the vadose zone from the soil profile on day i (mm), and Qgw is the amount of return flow on day i (mm).
The streamflow or river-runoff was simulated and calibrated with observed data to find out the appropriate model parameters that able to represent the basin characteristics. This study was simulated during 2007–2016 and location of gauging stations is shown in Fig. 1. The criteria to evaluate model performance were coefficient of determination (R2) (Polanco et al., 2017) and graphical comparison of observed and simulated stream flow.
where Qobs, Qavg, Qsim and are the observed, averaged observed, simulated, and average simulated streamflow and n is the length of the time series.
5.1 SWAT model calibration
The SWAT model was simulated in 10 years (2007–2016) and compared the simulate result with the observed inflow into the Dok Krai, Nong Pla Lai and Klong Yai reservoirs as shown in Fig. 2 and Table 2. The simulation results were closed to the observation for each reservoir and the summarized of mean annual inflow of the model simulation and observation were also shown in Table 2. The result showed the similarity of annual inflow between simulation and observation.
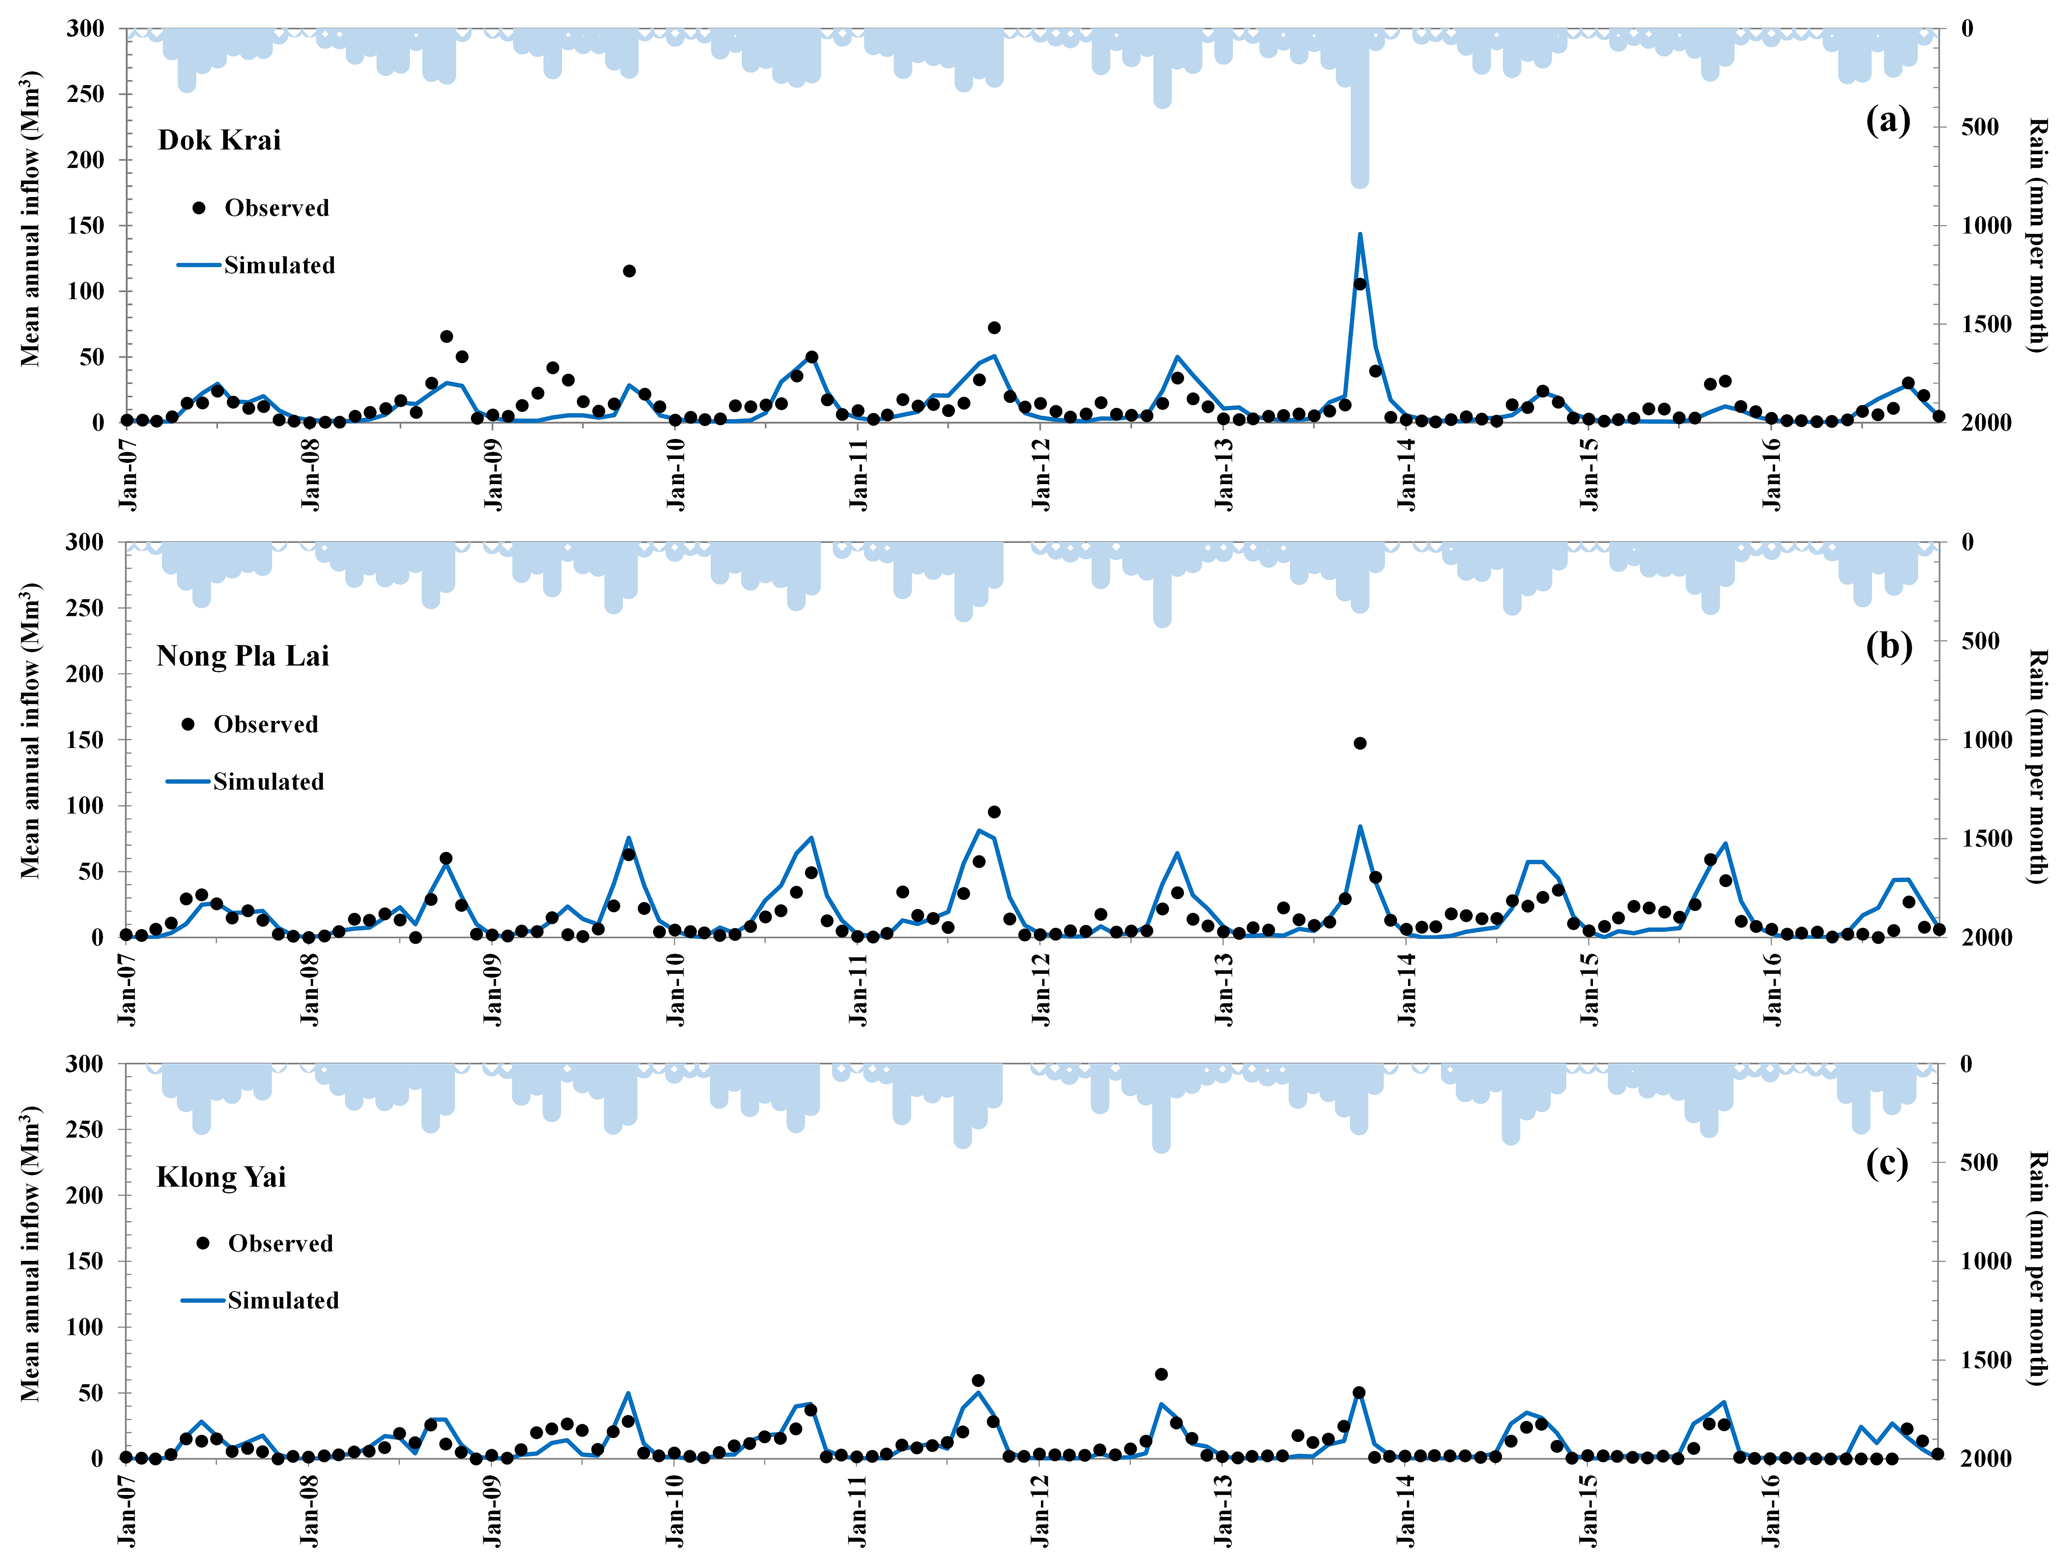
Table 2Calibration results of SWAT model for reservoirs over Klong Yai River basin.
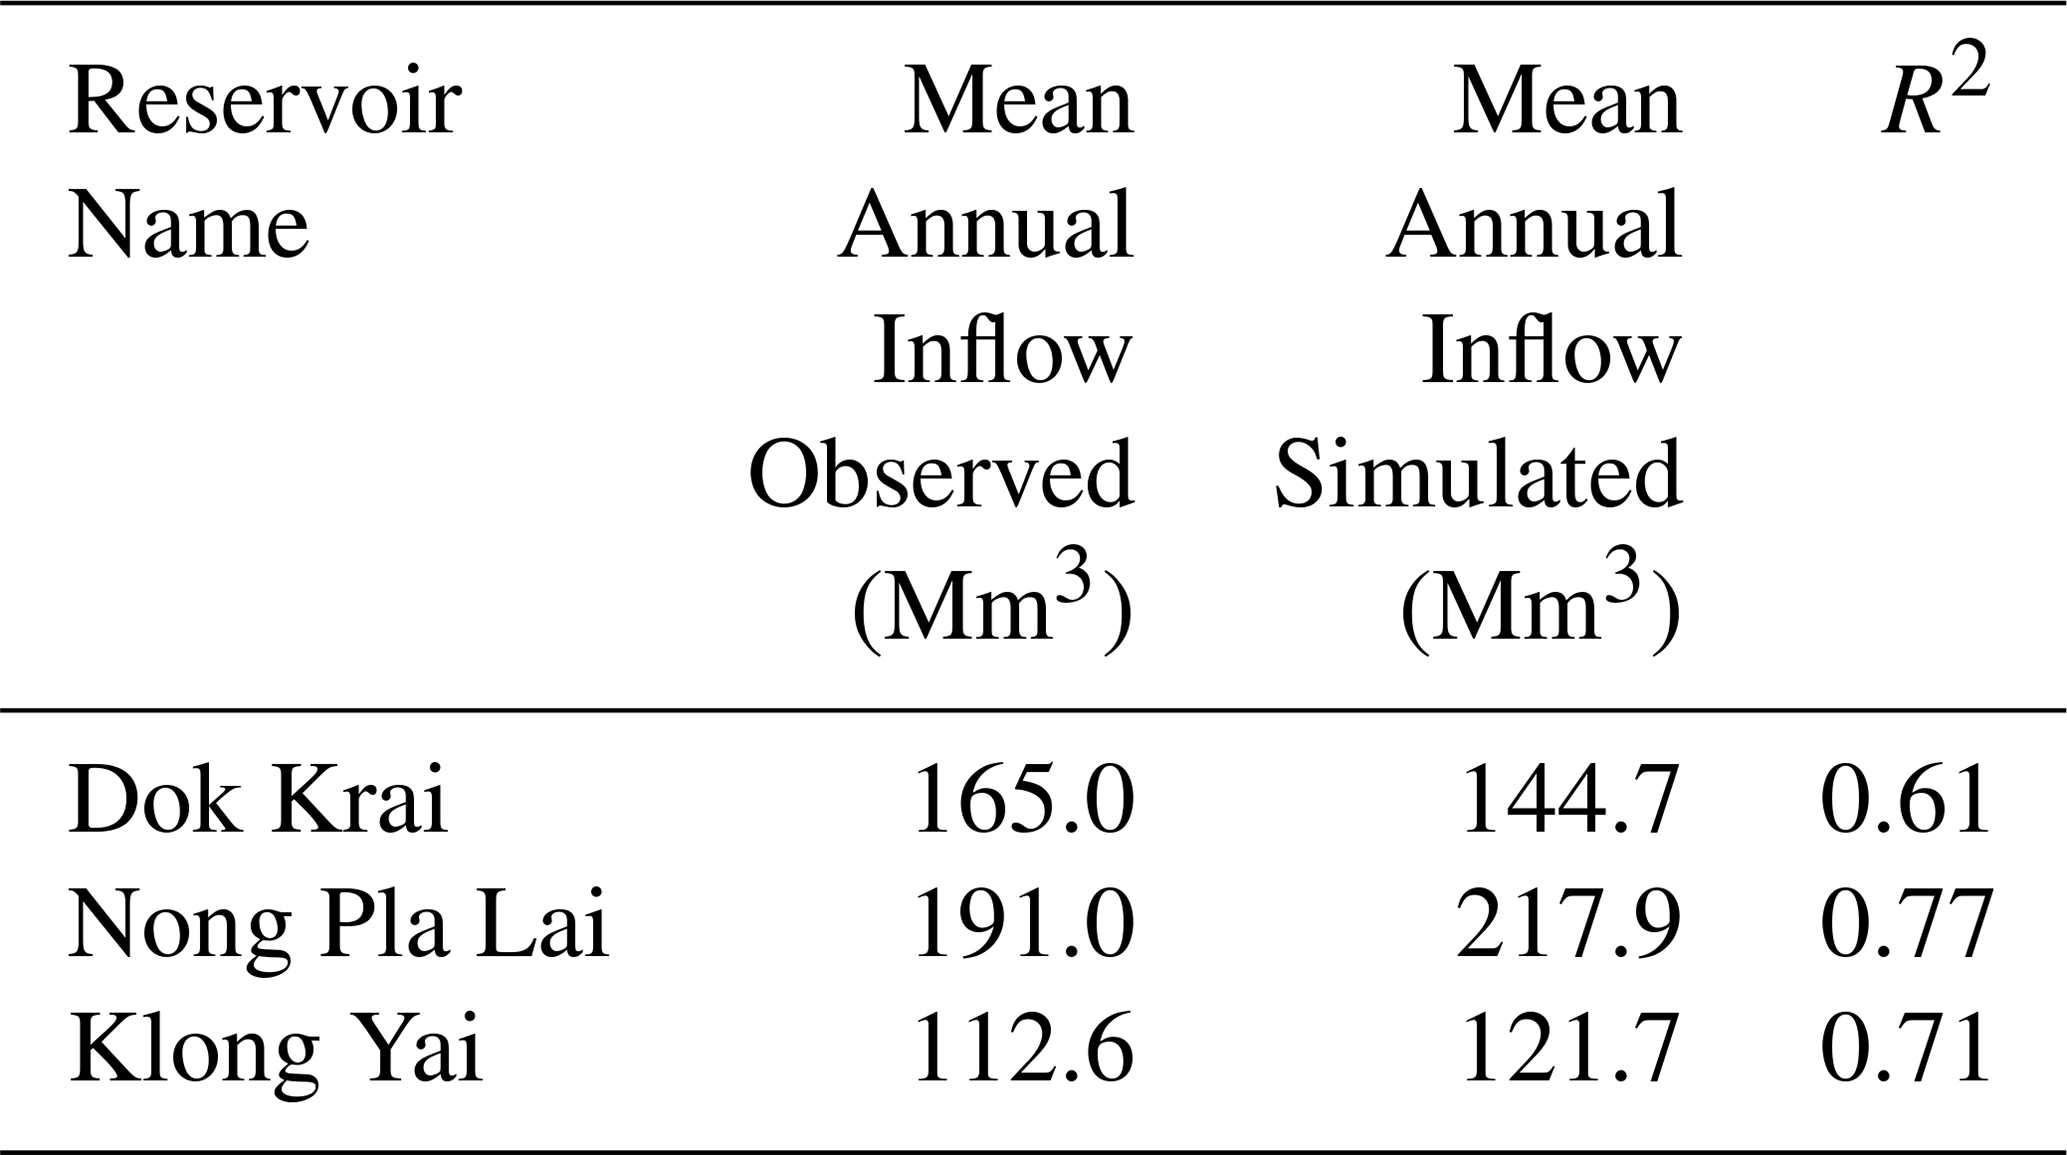
Source: Royal Irrigation Department (RID).
5.2 GCMs selection
For the GCMs selection, 10 CMIP5 GCMs of historical monthly rainfall and temperature data during period 1991–2000 are compared with observed data for selecting the suitable GCMs in Klong Yai River Basin. The standard deviation of the monthly observed data is represented the similar pattern of the rainfall and temperature in this river basin. 3 GCMs were selected to evaluate the impact of climate change based on the period 2017–2026 and 2027–2036 relative to 1991–2000 using bias correction in the next step. The comparison of selected GCM precipitation output and observed data from 1991–2000 was shown in Fig. 3. The blue band represented the standard deviation range of observation (mean monthly over the period 1986–2000). Three suitable GCMs namely GISS, MIROC and MPI showed similar precipitation patterns with the observation.
Moreover, the analysis result showed that there were 2 tropical monsoons in this Klong Yai catchment. Two periods are May–July and September–October.
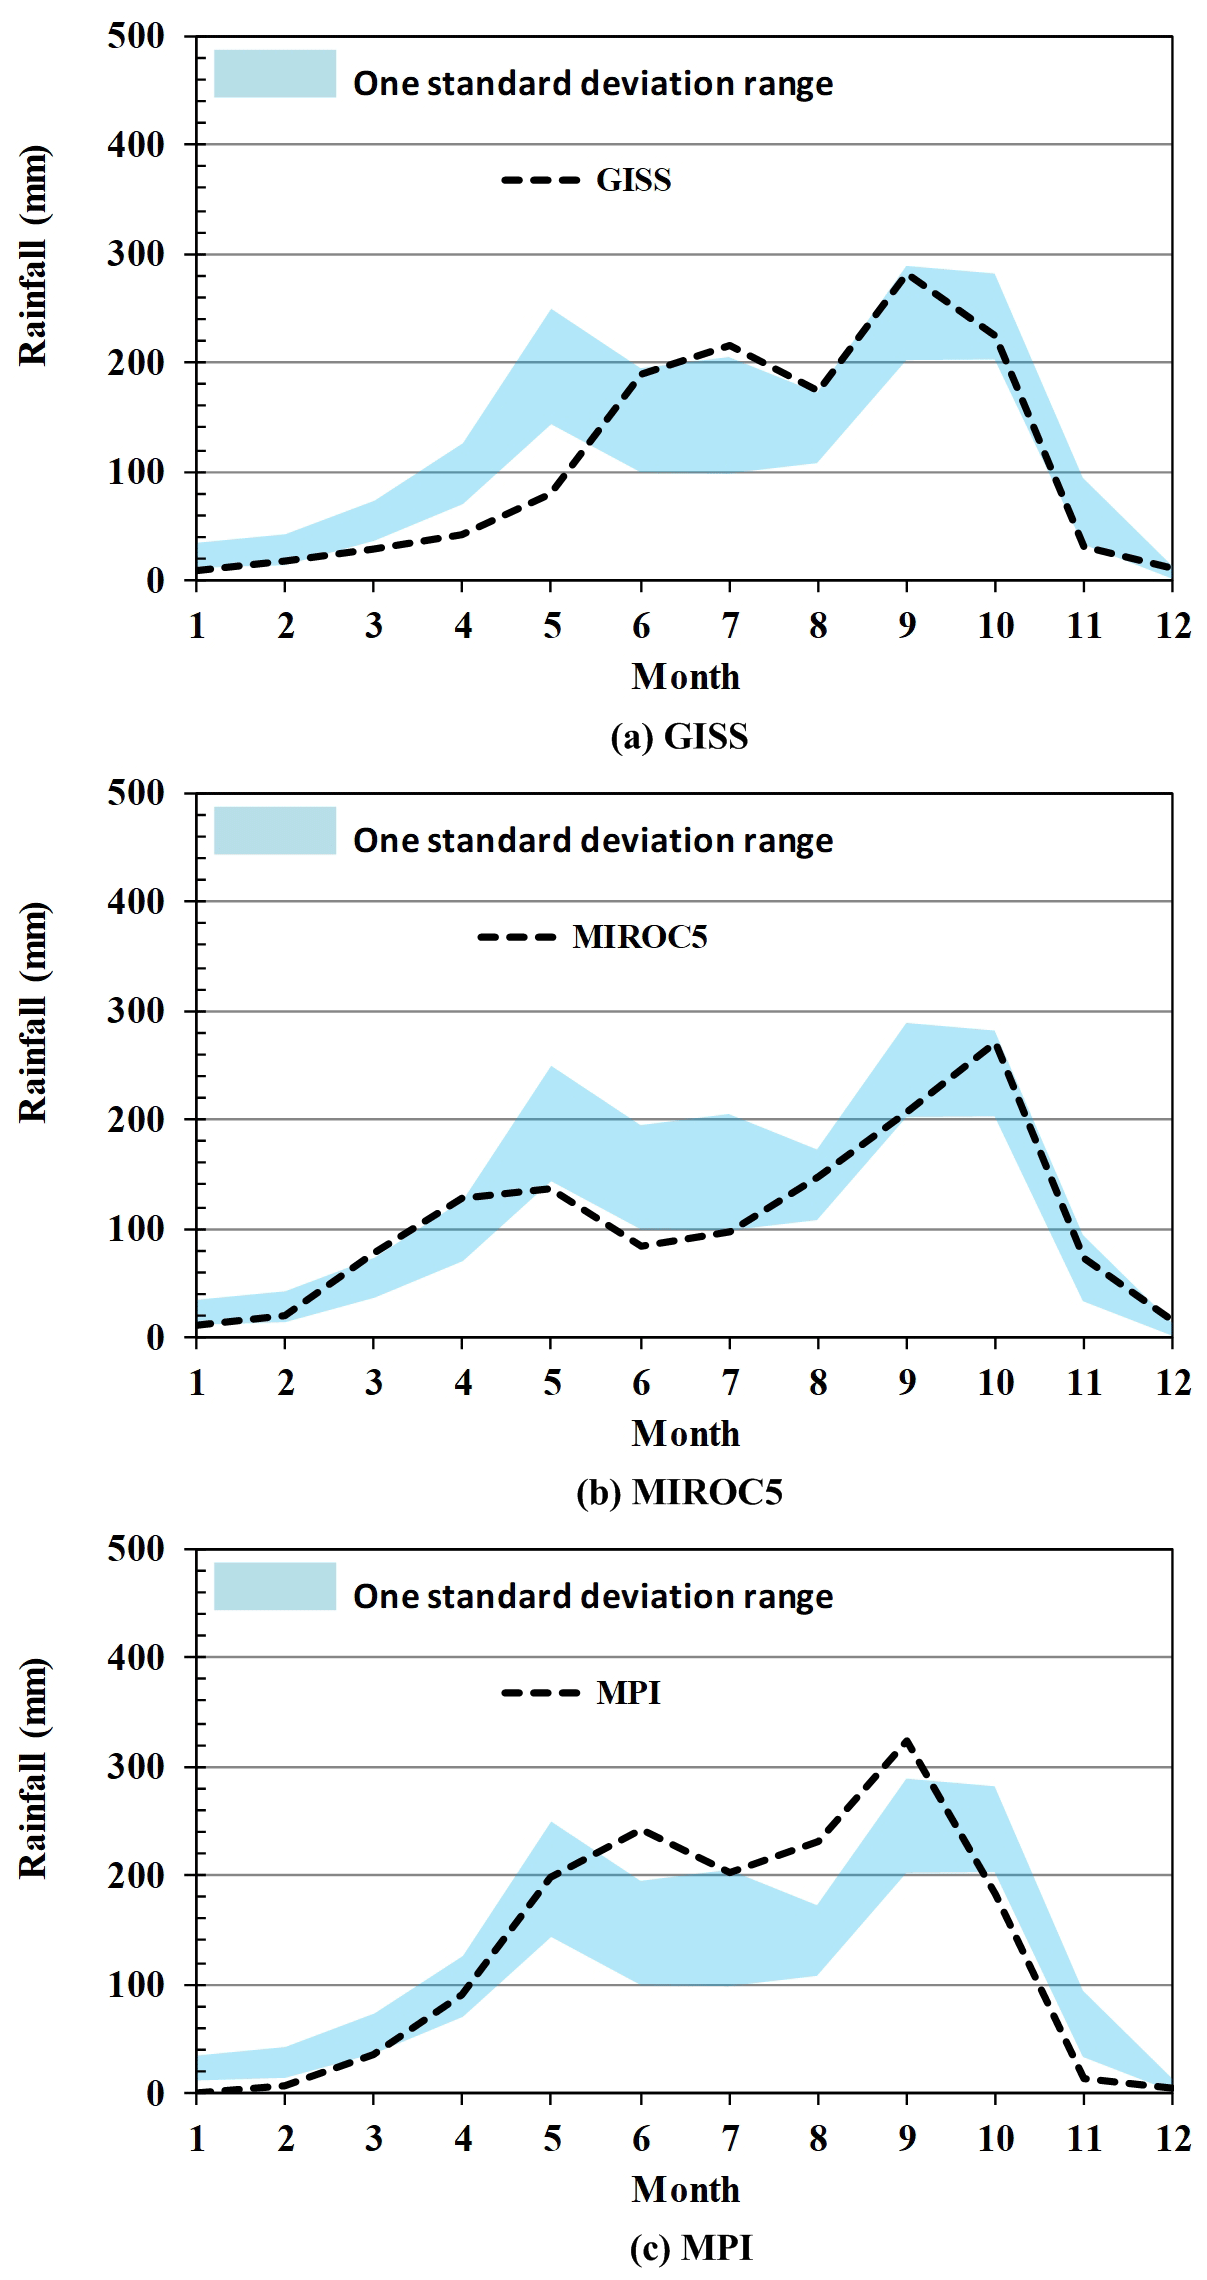
Figure 3Comparison of Average Monthly Precipitation of the selected GCMs and observation (1991–2000) in Klong Yai River basin.
5.3 Impacts of climate change on water resources
The study of precipitation changes under climate change scenario was analyzed based on the selected 3 GCMs. The results of monthly precipitation were shown in Figs. 4 (2017–2026) and 5 (2027–2036). The findings showed an increasing trend of annual rainfall in both 2 future periods. The increase rainfall occurs mainly during March–May and August–October. The future annual rainfall projects change were varied around 0.51 % to 19.05 % (6.24 to 232.31 mm), and −7.22 % to 17.30 % (−88.04 to 211 mm) for periods 2017–2026, 2027–2036, respectively
For the future projection of temperature, the monthly temperature trend will be increased around 0.3–1.35 ∘C or increasing of a 1.25 % to 5.00 % by comparing to the average temperature during 1991–2000 as shown in Figs. 9 and 10.
April was the hottest month while December was the winter season in the past but temperature will increase about 1.0 ∘C. These projected results showed good agreement with the IPCC's report (IPCC, 2013) on 1.0–2.4 ∘C of surface temperature rising at the end of 21st century.
The selected GCMs (MIROC5, GISS and MPI GCMs) were applied to forecast the effect of climate change impact on reservoir inflow. There are 2 assessment periods which are 2017–2026 and 2027–2036. As shown in Figs. 8 to 13, there are the future simulations of the monthly reservoir inflow into the Dok Krai, Nong Pla Lai, and Klong Yai reservoirs in 2 periods, respectively. The comparison of monthly reservoirs inflow in the past (2007–2016) and under climate change conditions showed a decreasing trend due to the rising temperature and evaporation
Moreover, an increase in temperature will increase the agricultural water demand or crop water requirement in Klong Yai River basin. The climate change in the Klong Yai River basin is the negative impact on water resources. It can be developed adaptation options for address the climate change impact especially drought management for example increase water efficiency, reduce the water use or promote a water saving in the future.
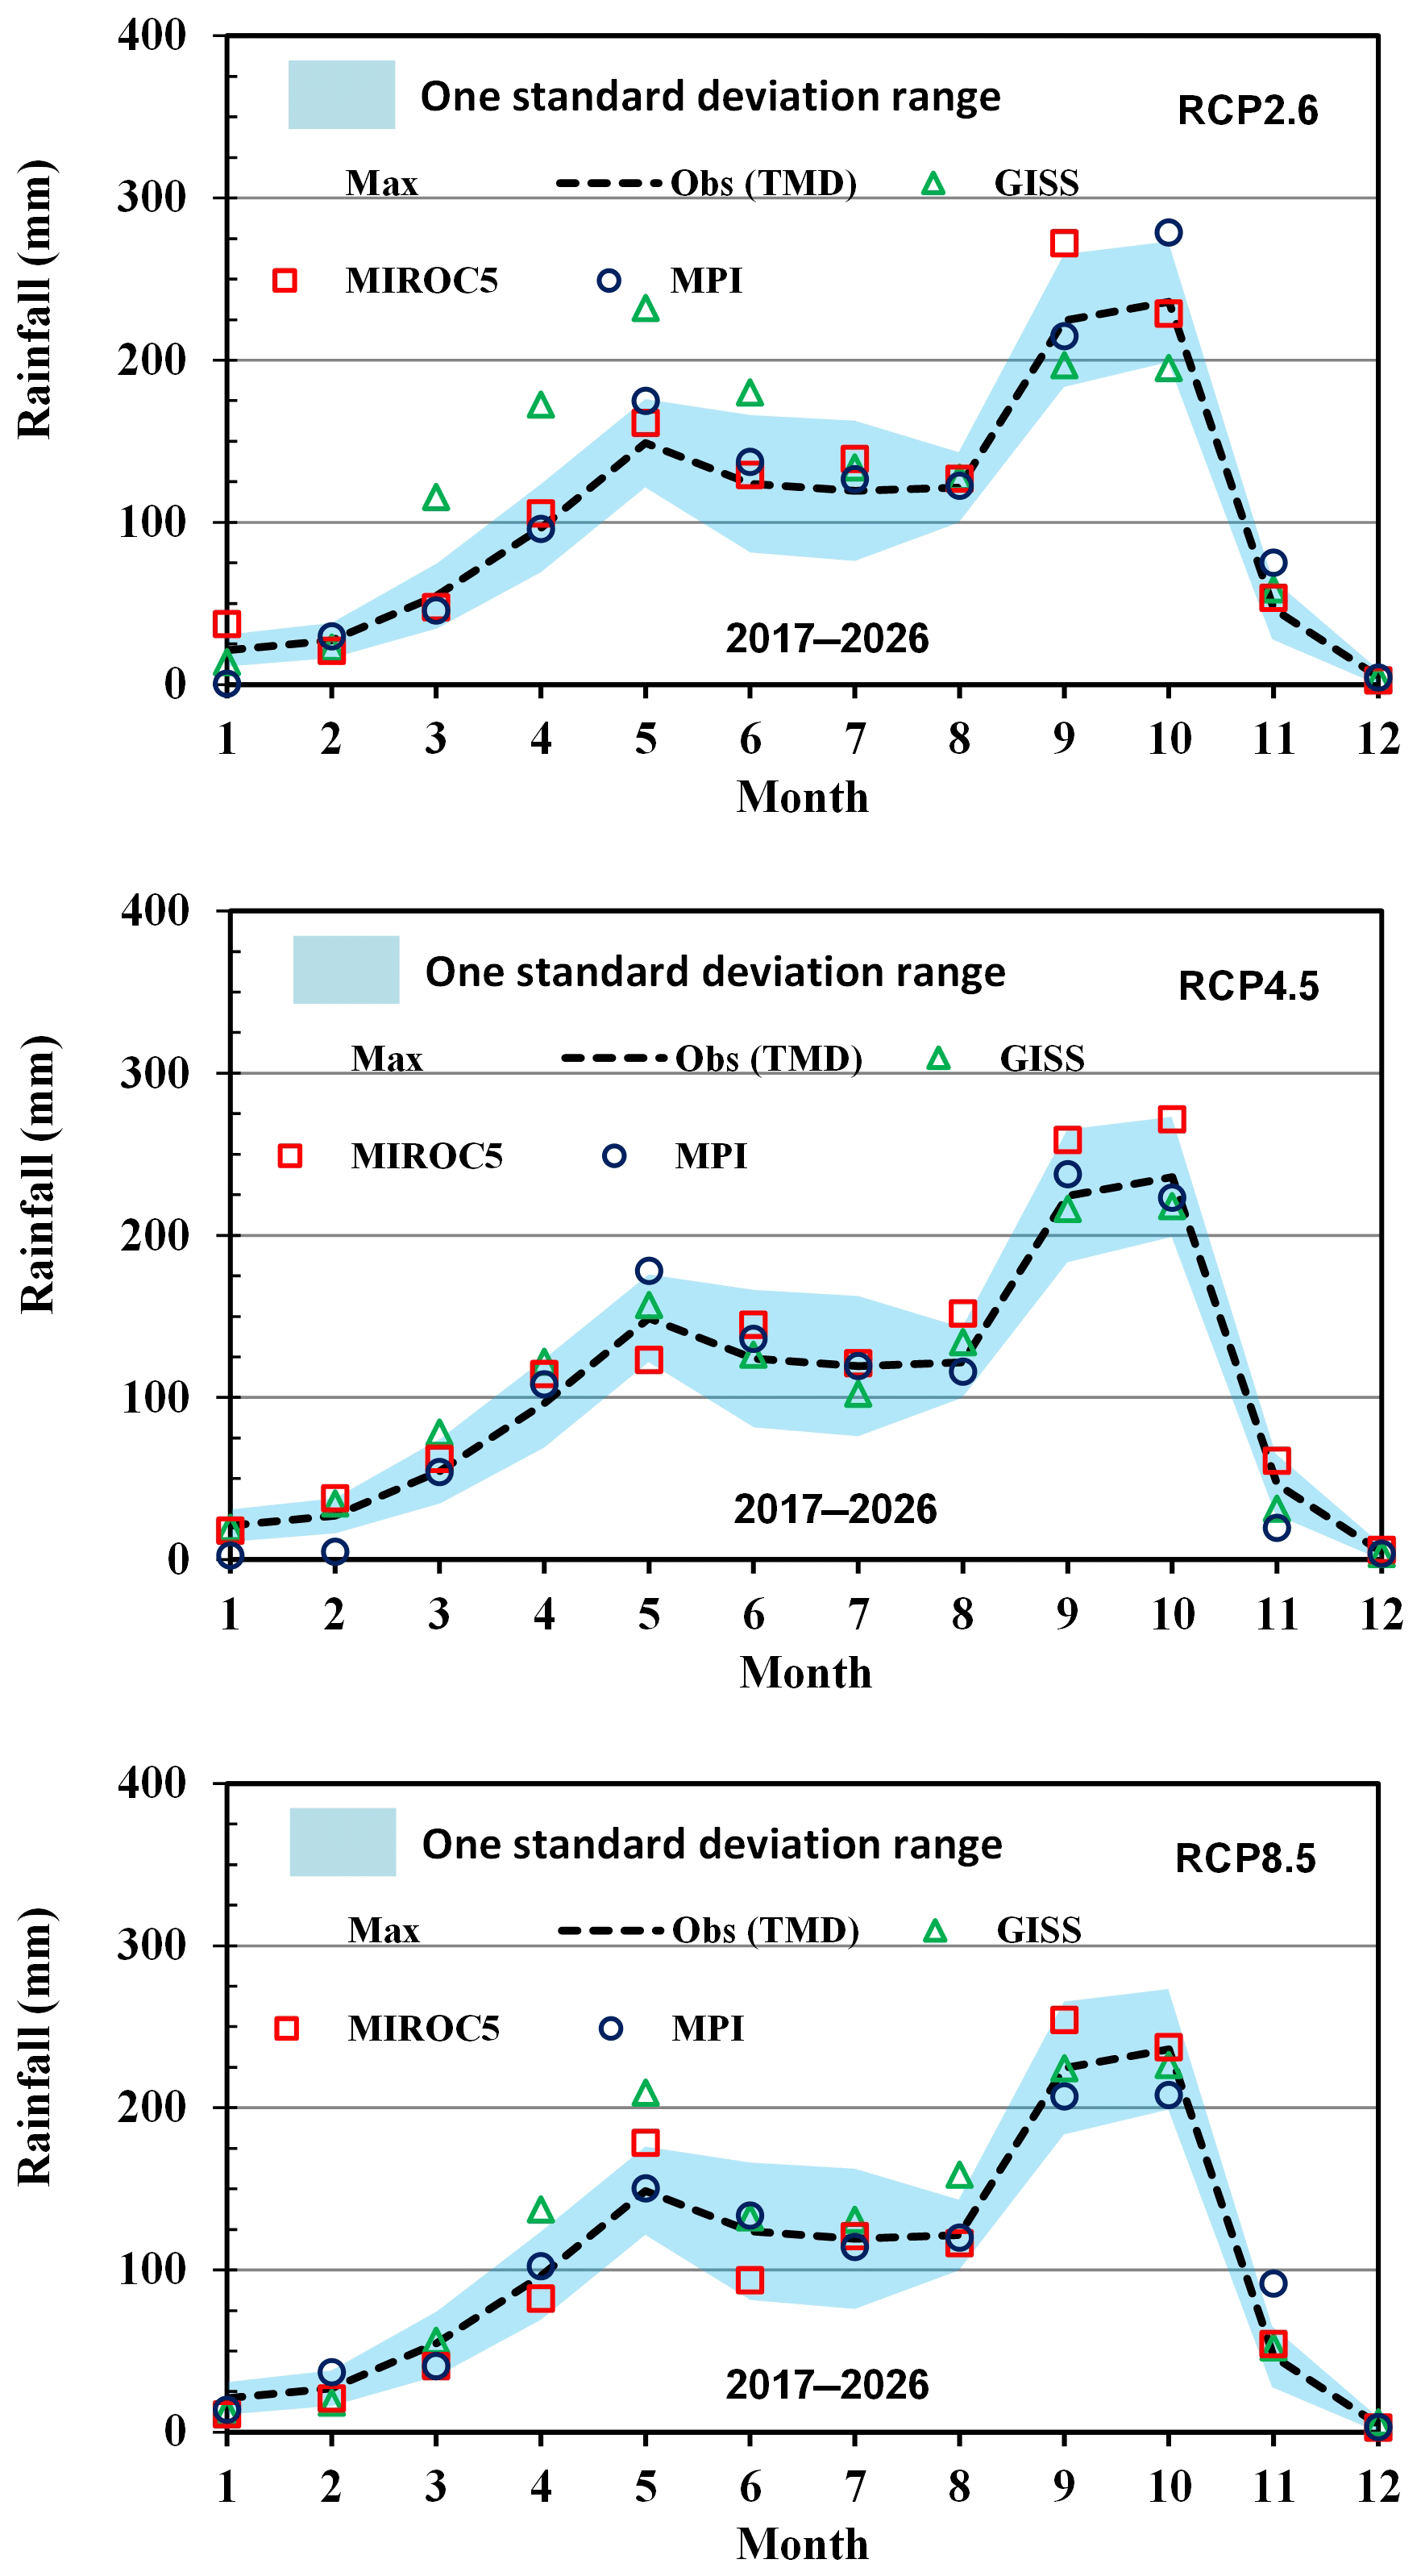
Figure 4Comparison of mean monthly precipitation variation in 2017–2026 (under the climate change scenarios) and 1991–2000.
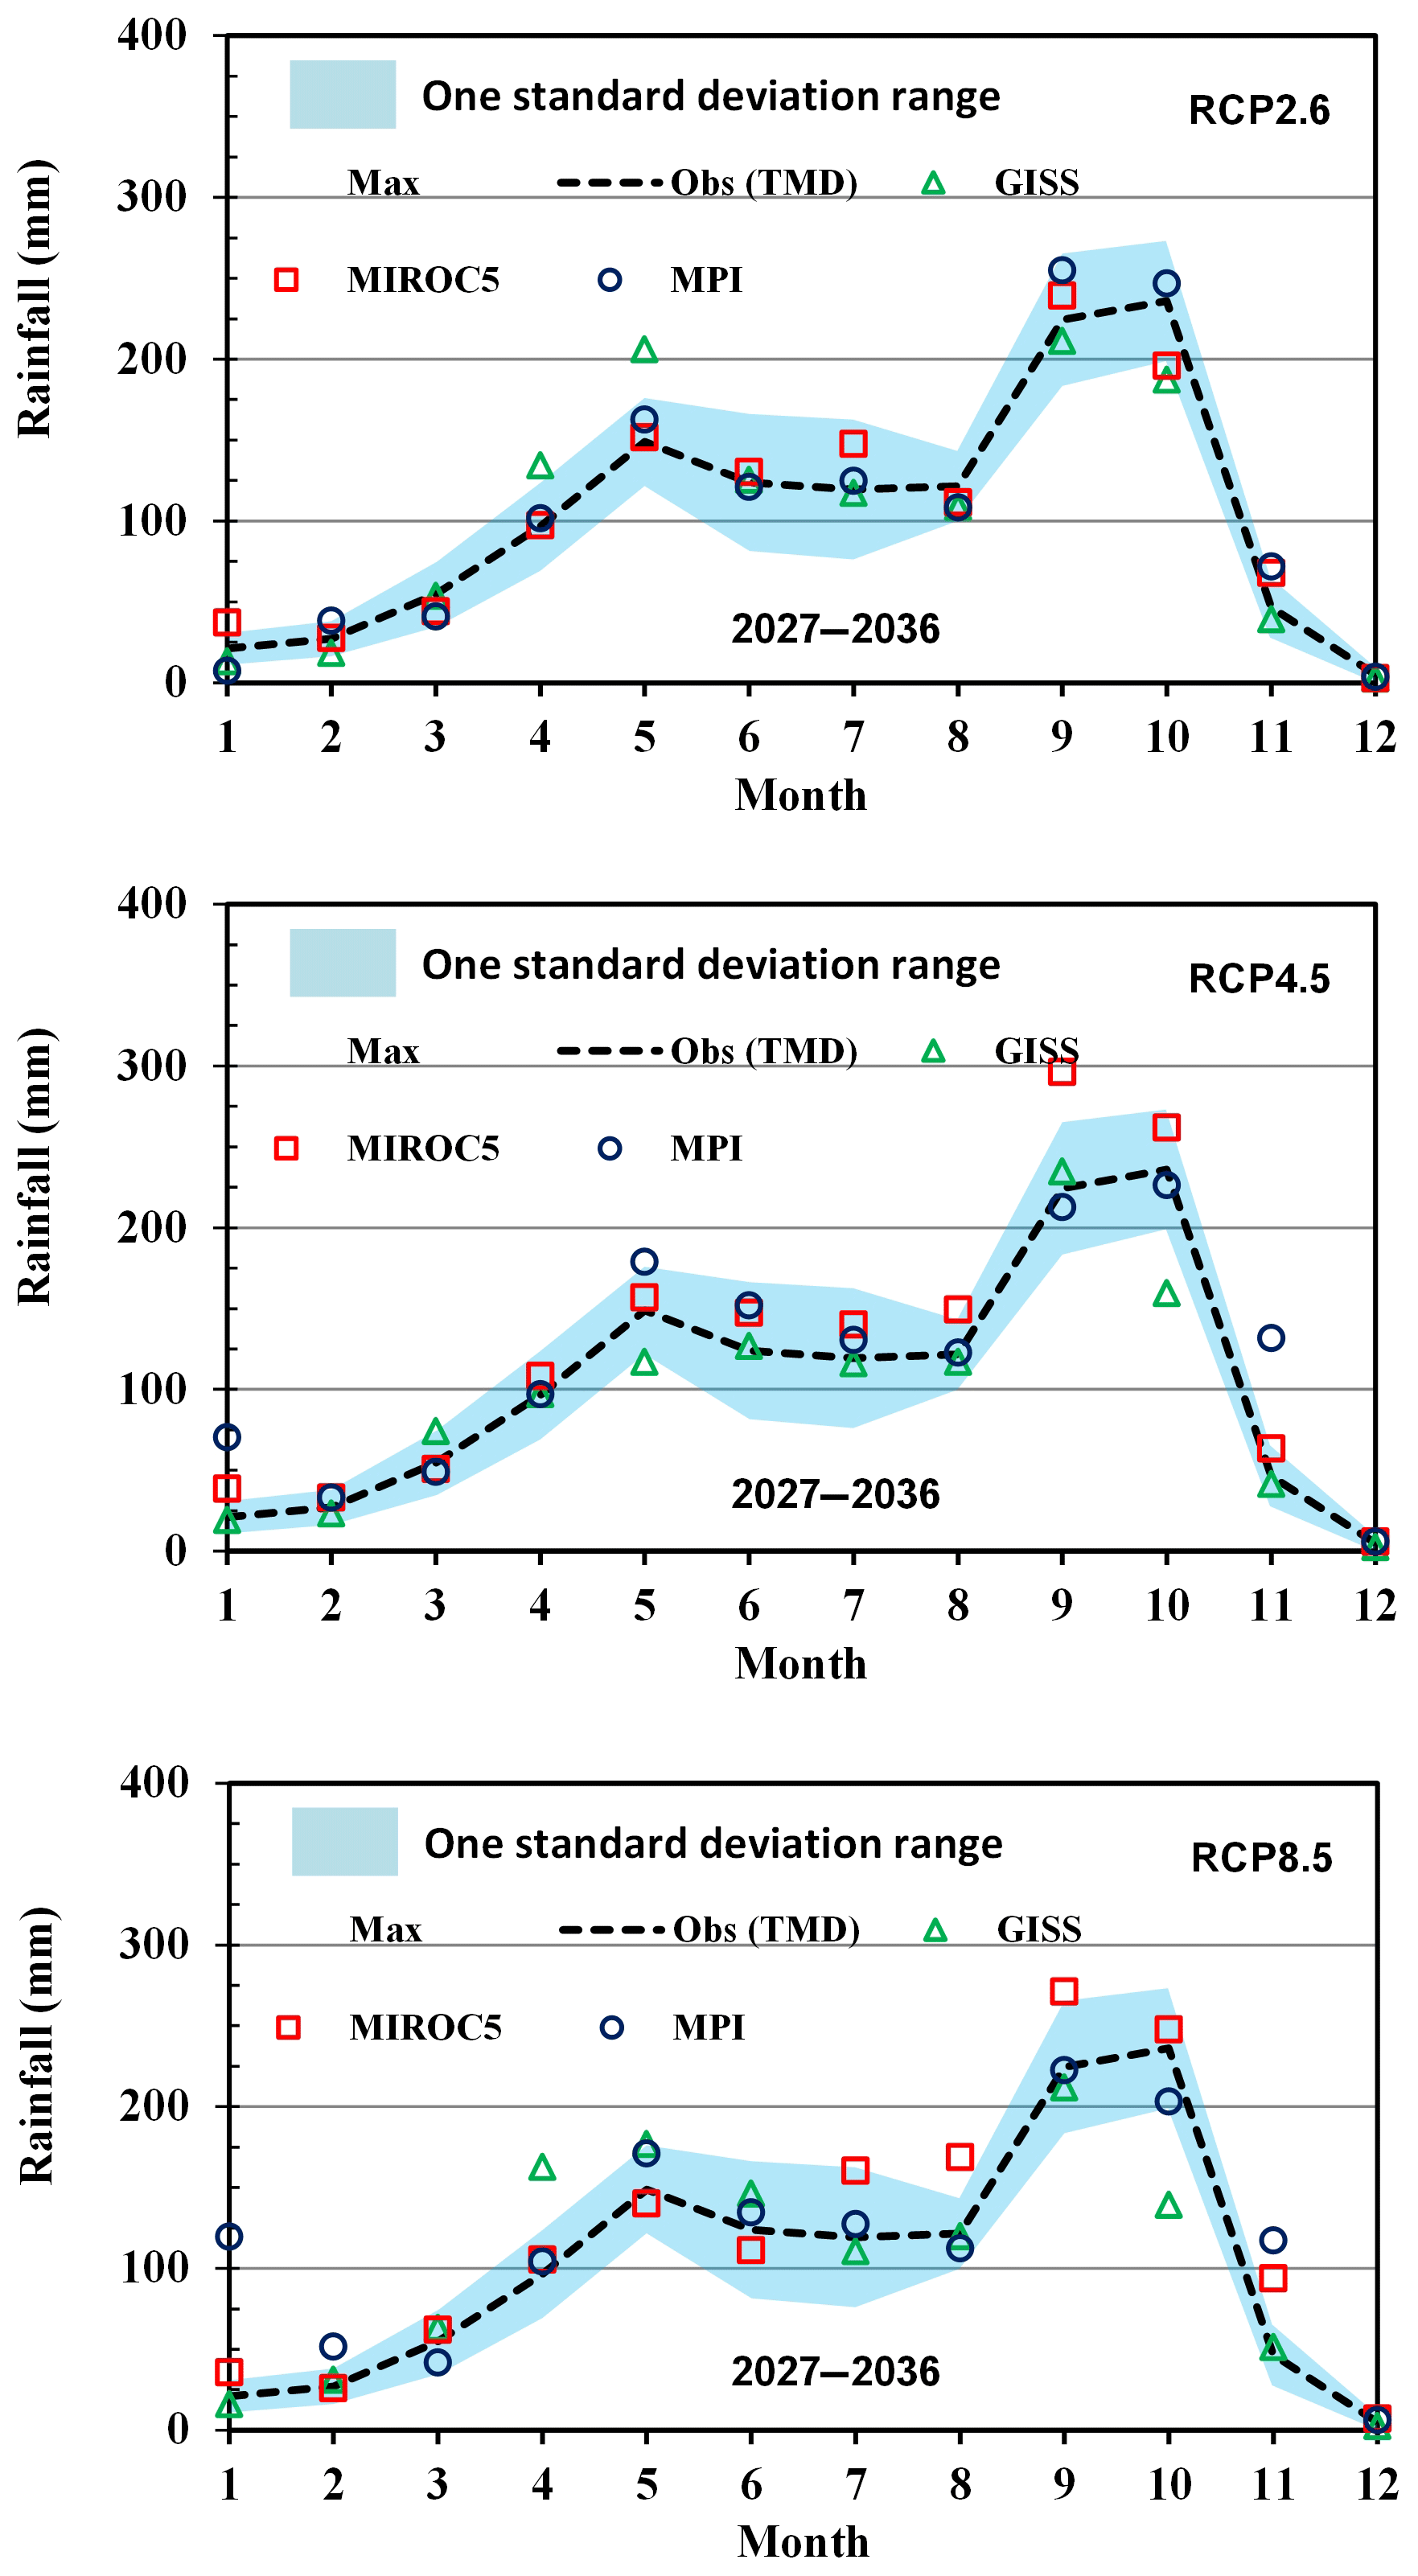
Figure 5Comparison of mean monthly precipitation variation in 2027–2036 (under the climate change scenarios) and 1991–2000.
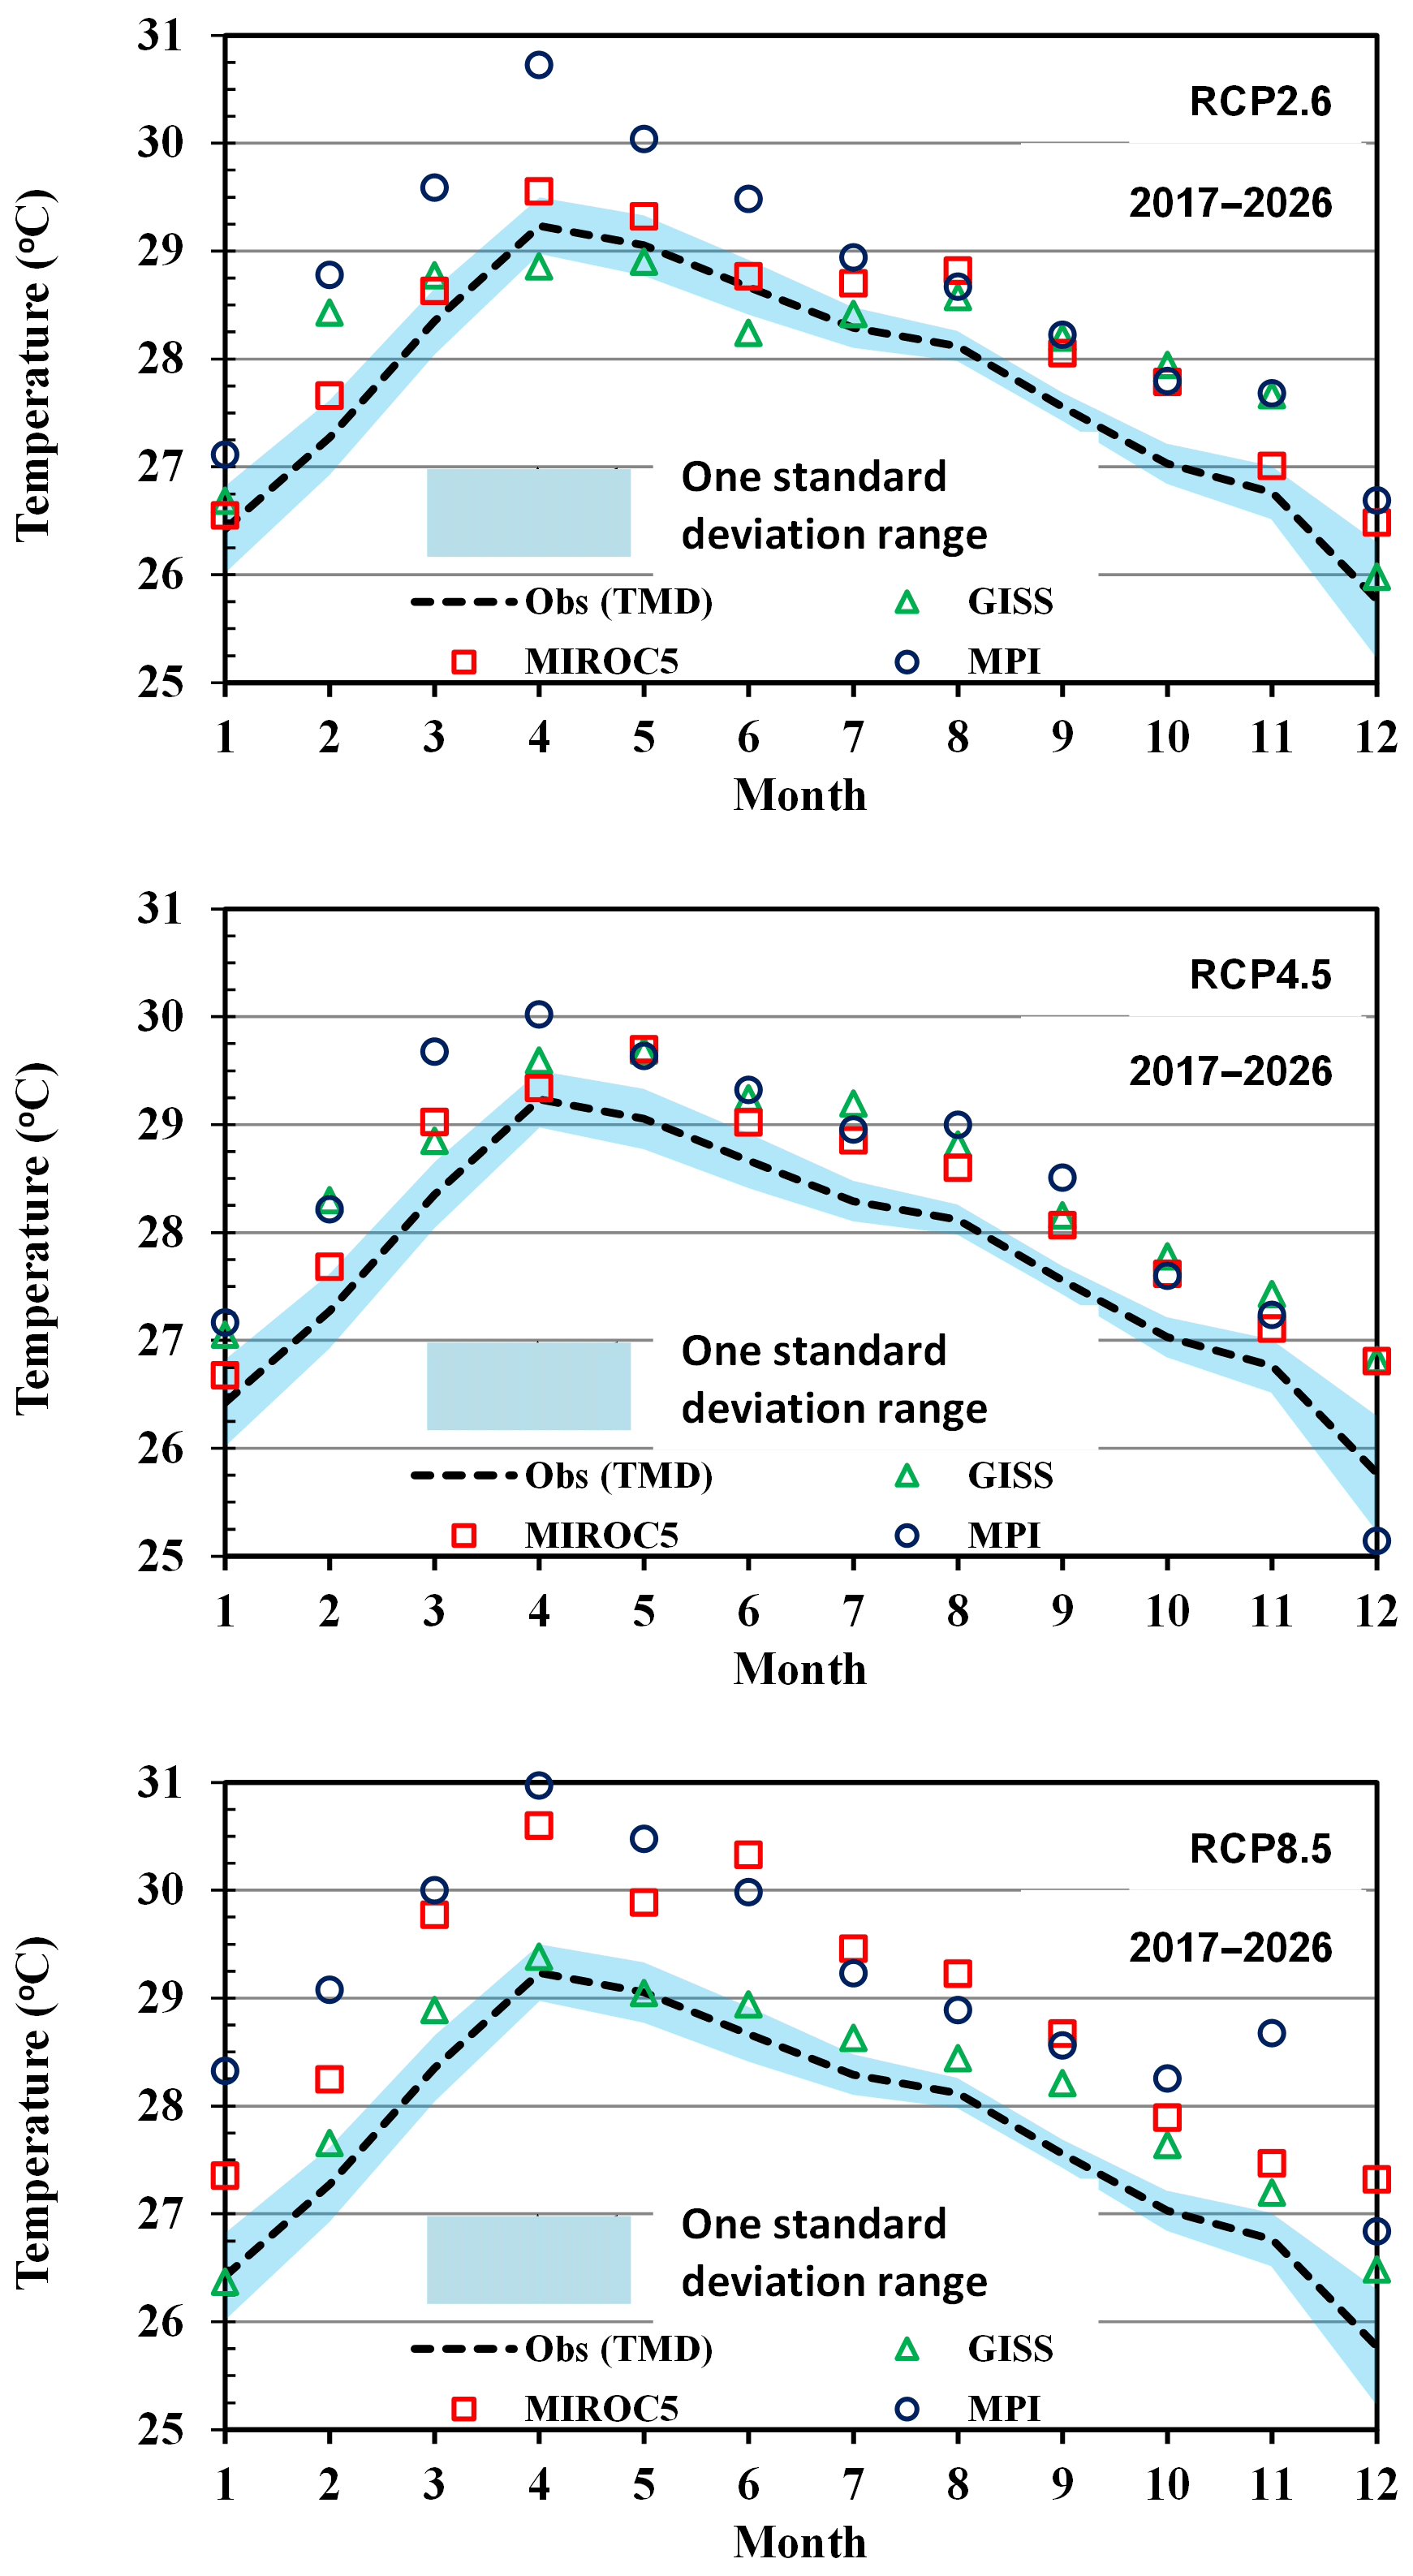
Figure 6Comparison of mean monthly temperature variation during the periods of 2017–2026 (under the climate change scenarios) and 1991–2000.

Figure 7Comparison of mean temperature variation in during the periods of 2027–2036 (under the climate change scenarios) and 1991–2000.
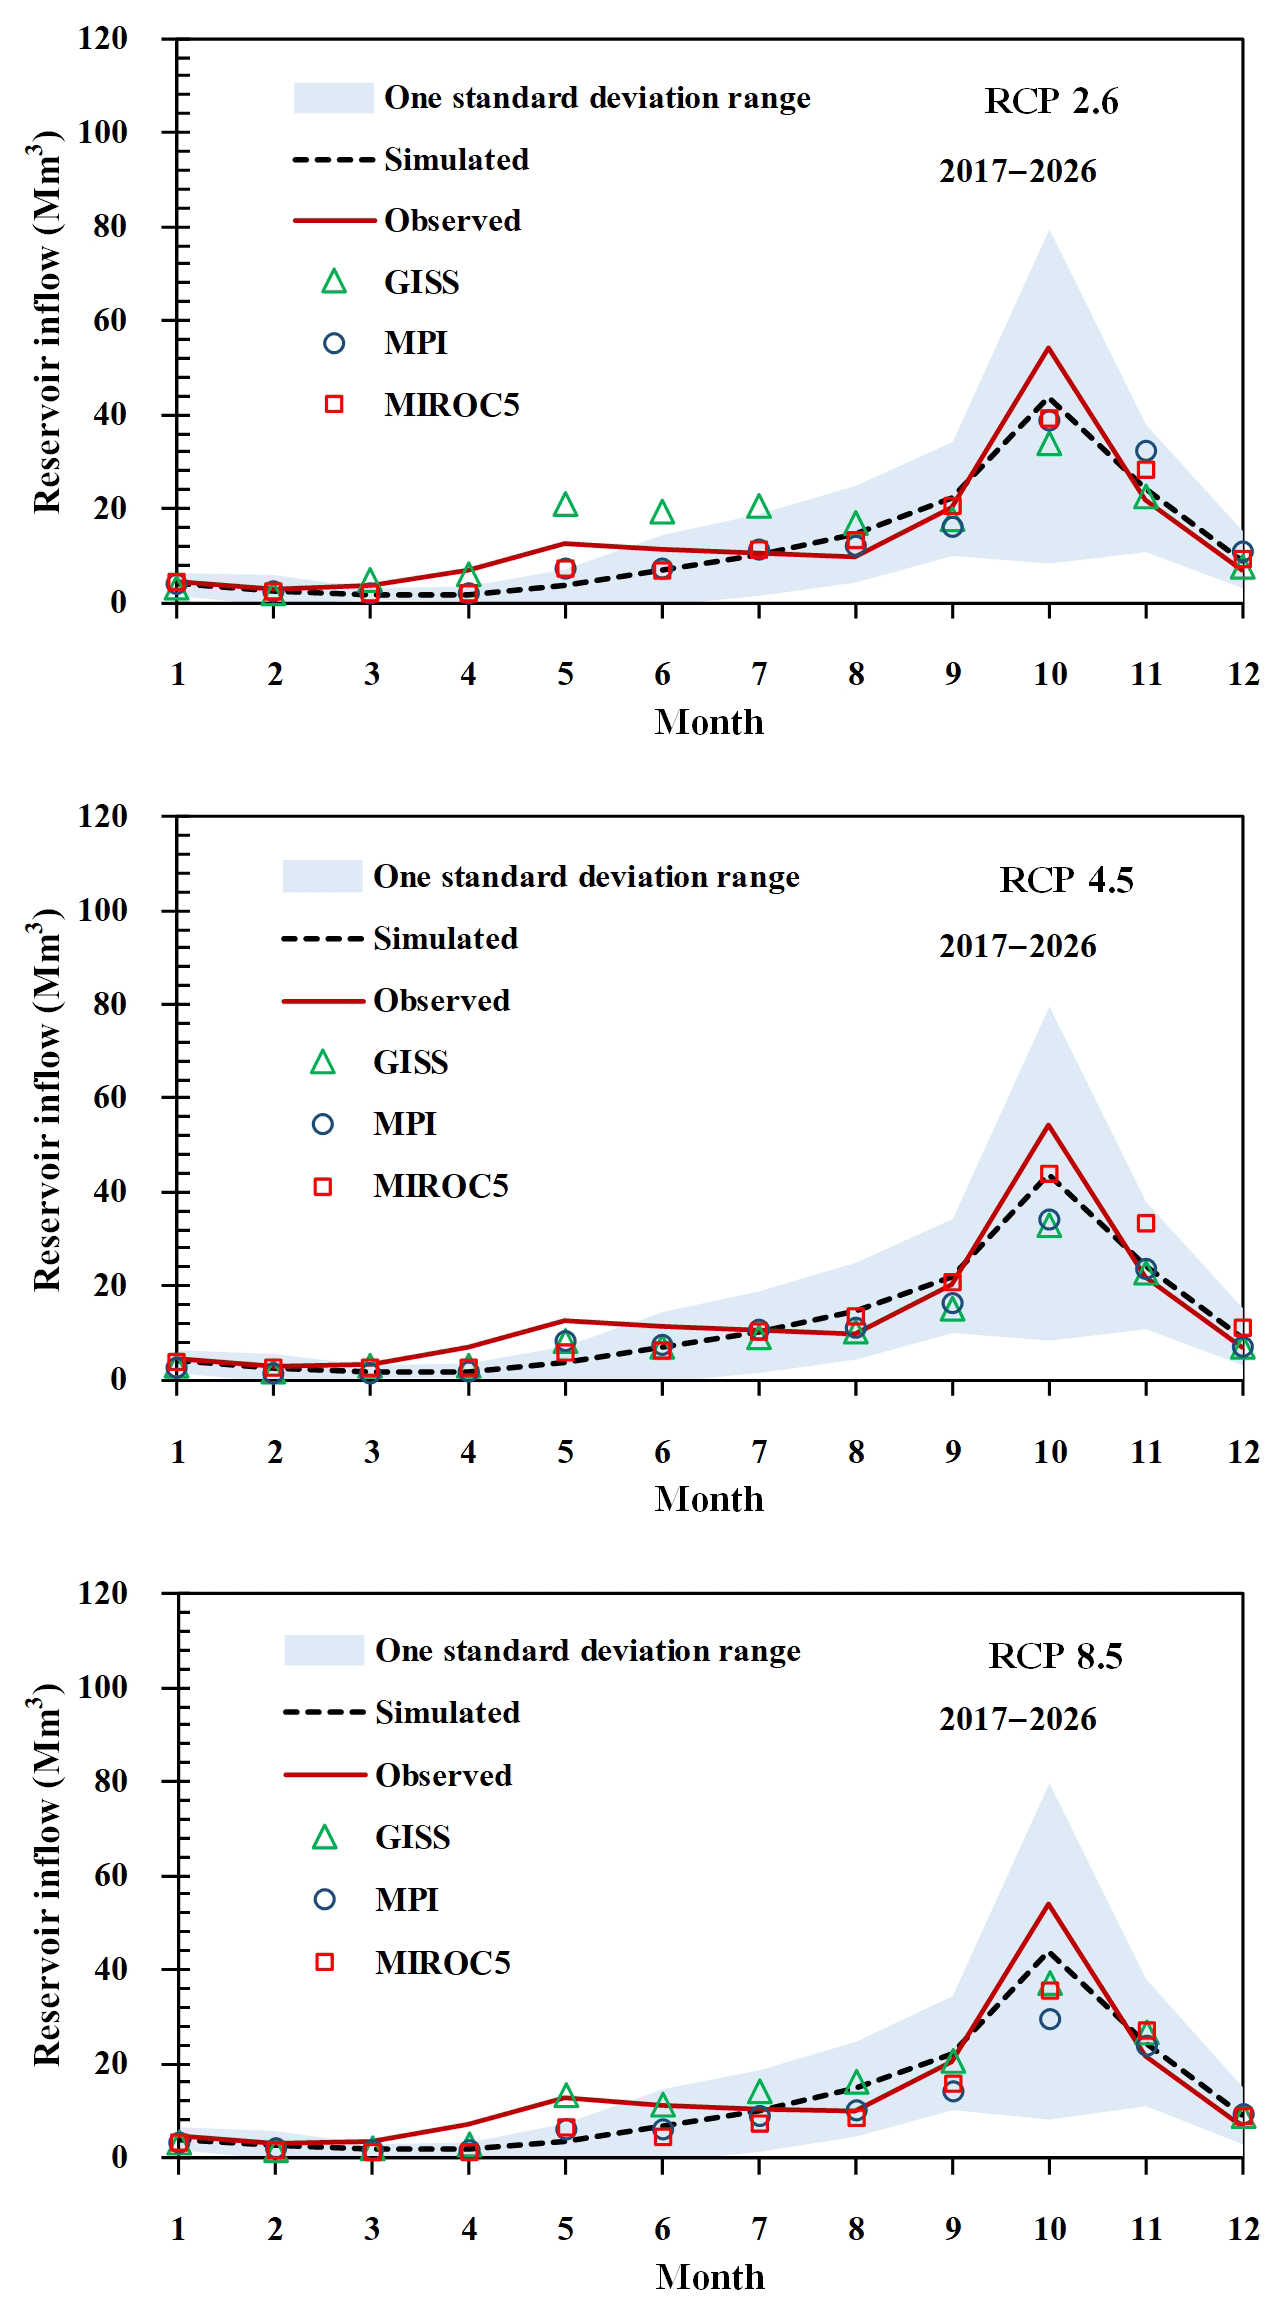
Figure 8Projected mean monthly reservoir inflows under 3 scenarios for the years 2017–2026 at Dok Krai Resevoir.

Figure 9Projected mean monthly reservoir inflows under 3 scenarios for the years 2027–2036 at Dok Krai Resevoir.
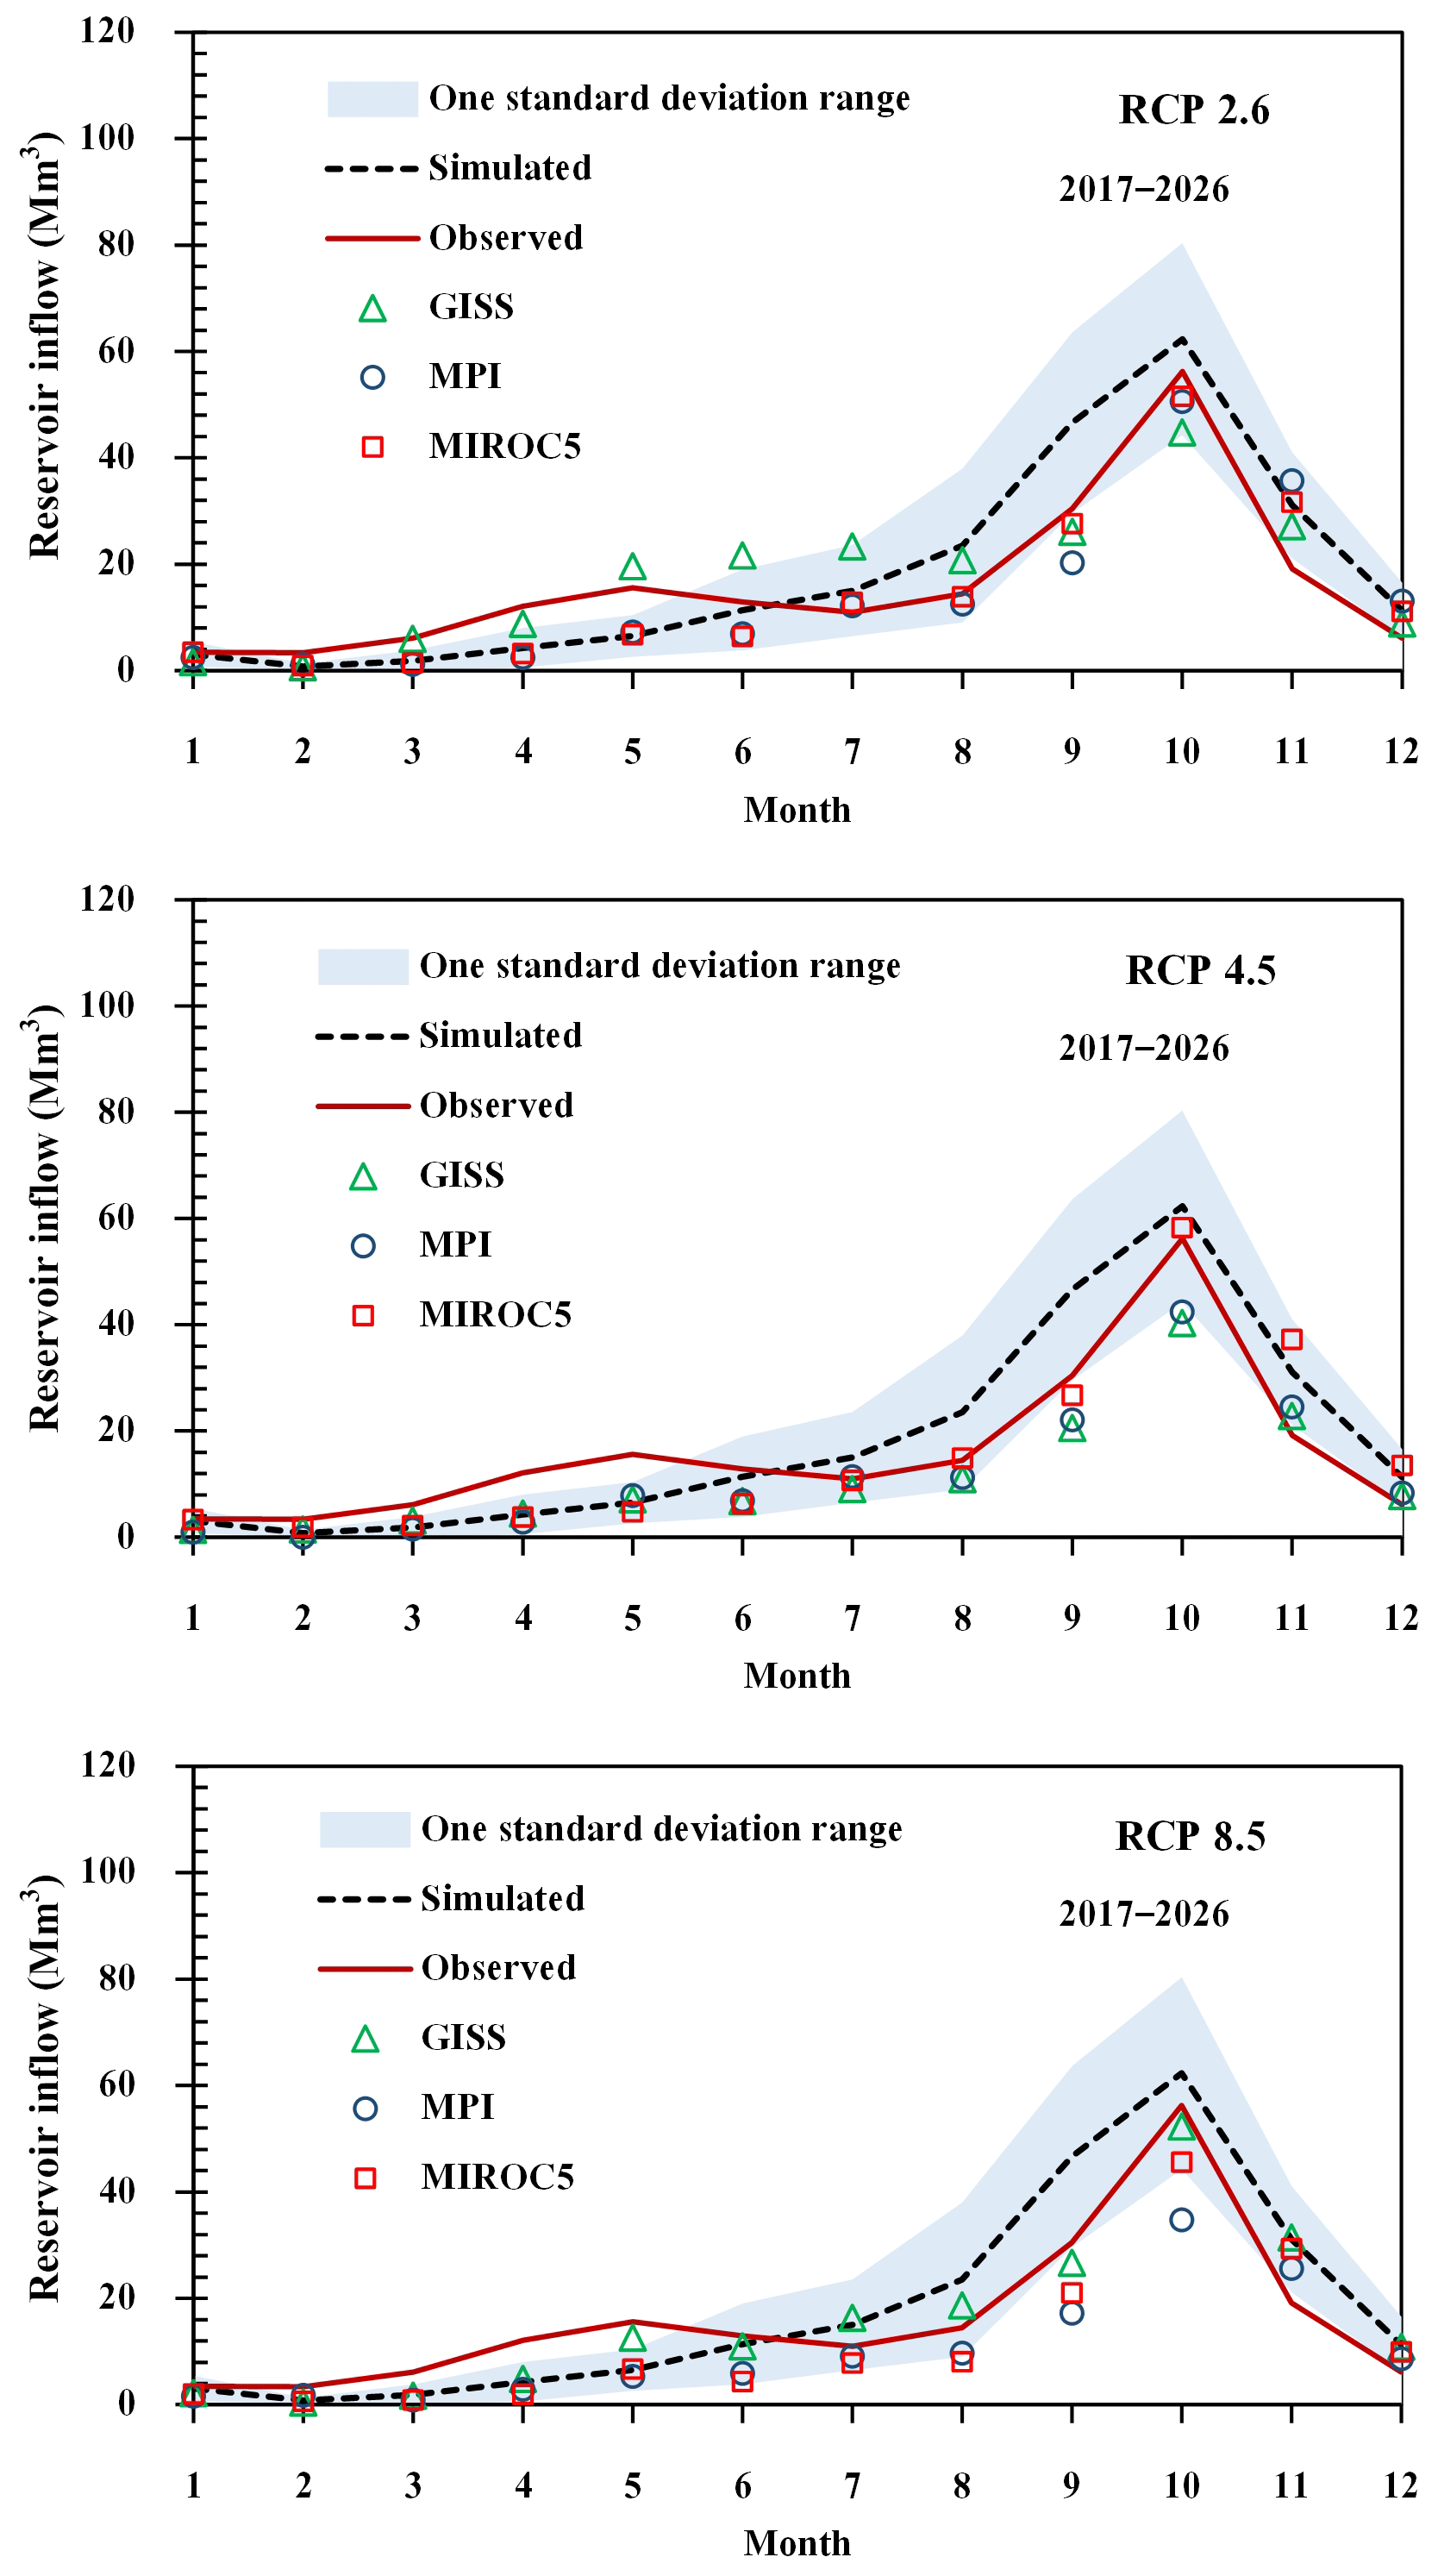
Figure 10Projected mean monthly reservoir inflows under 3 scenarios for the years 2017–2026 at Nong Pla Lai Resevoir.
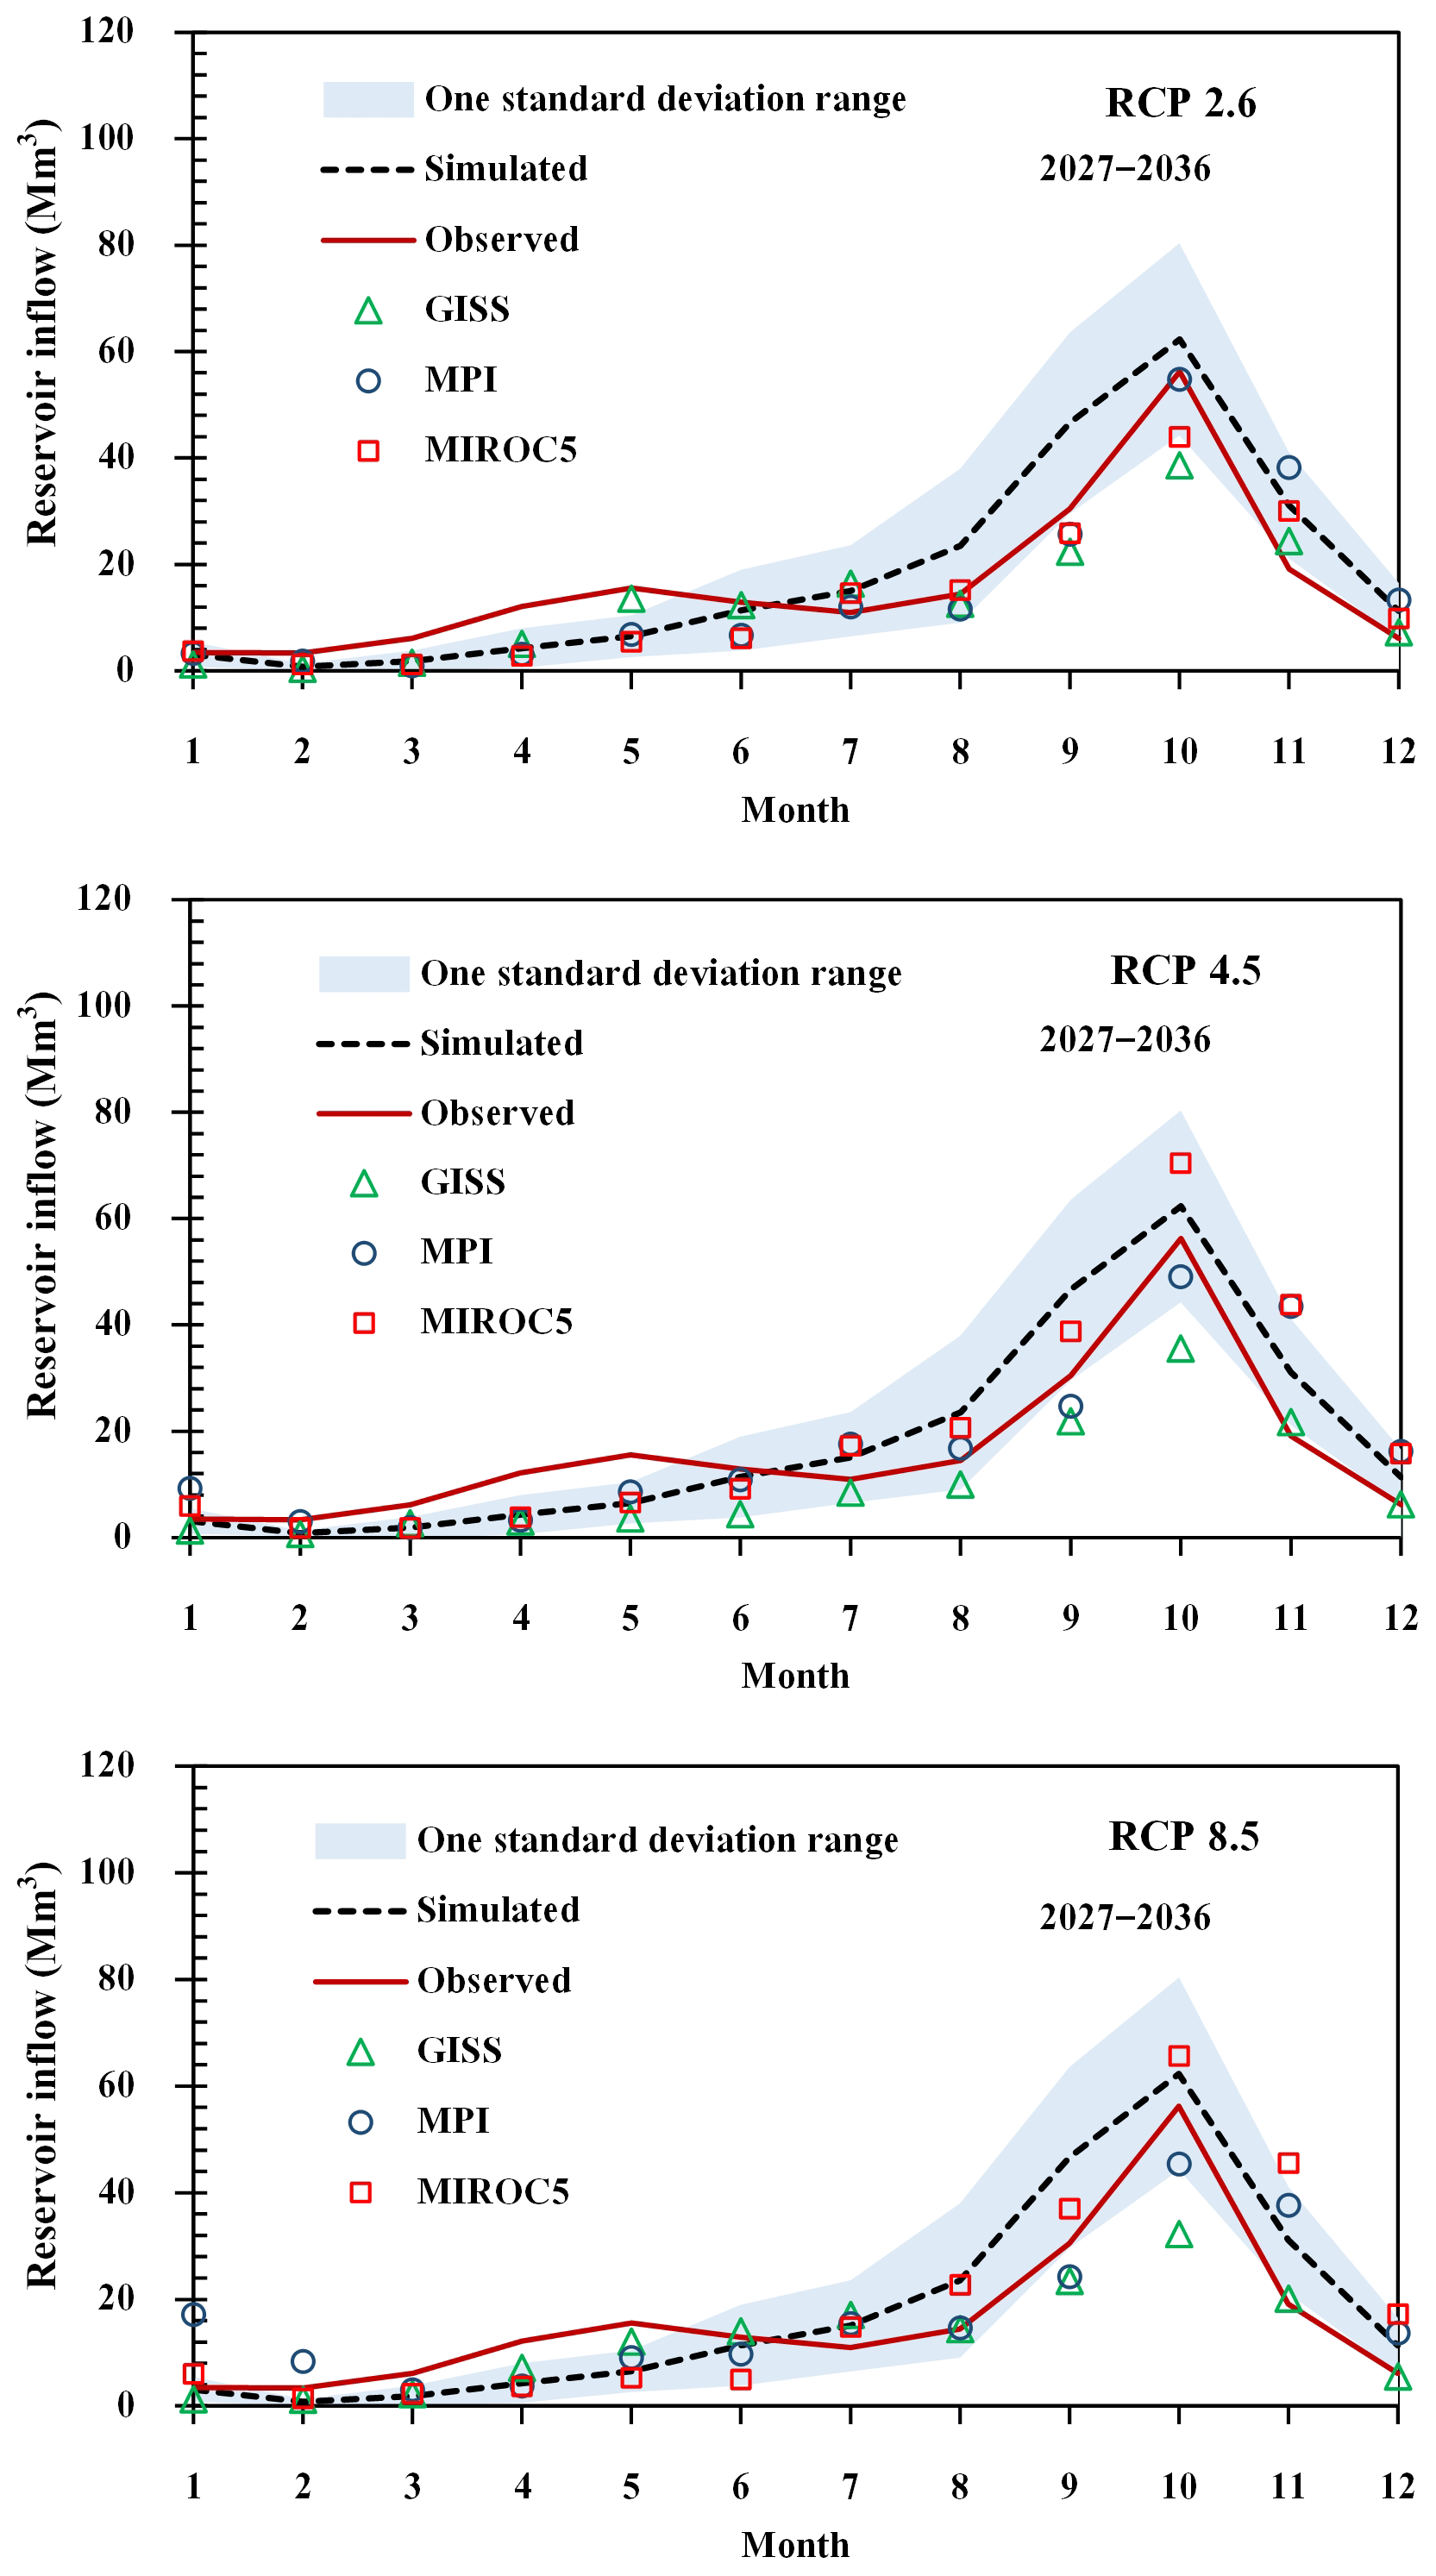
Figure 11Projected mean monthly reservoir inflows under 3 scenarios for the years 2027–2036 at Nong Pla Lai Resevoir.
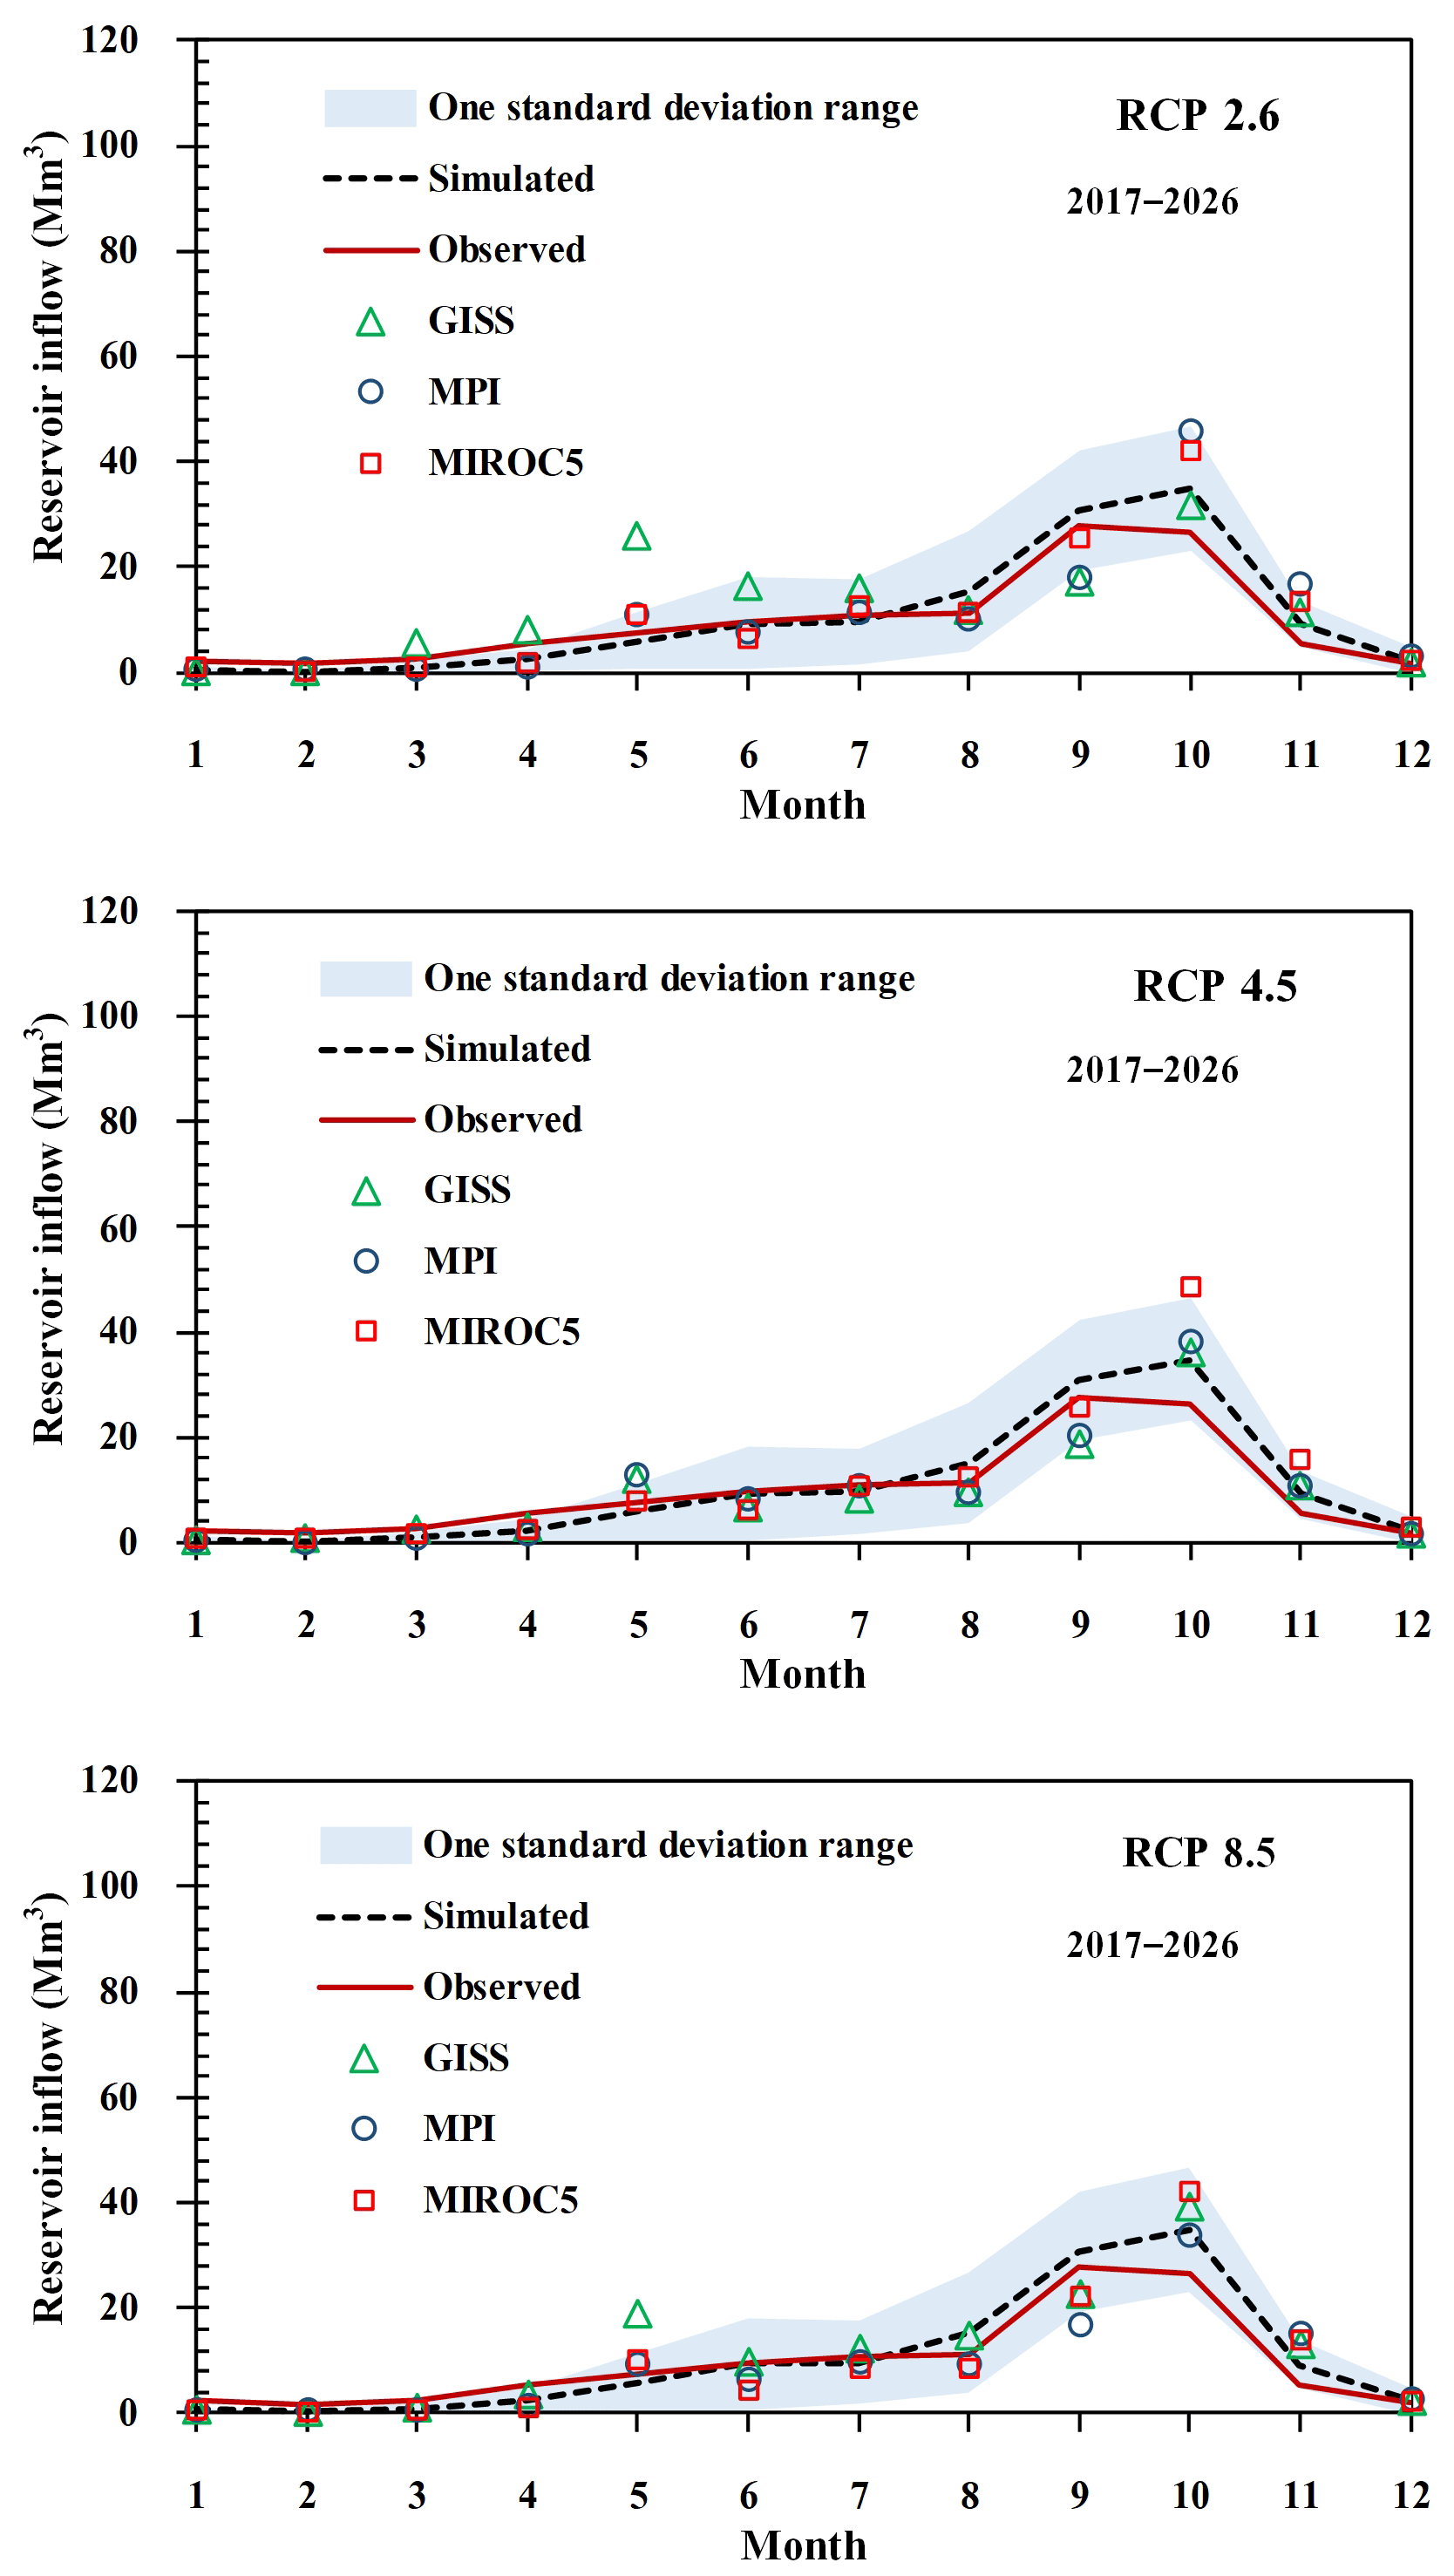
Figure 12Projected mean monthly reservoir inflows under 3 scenarios for the years 2017–2026 at Klong Yai Resevoir.
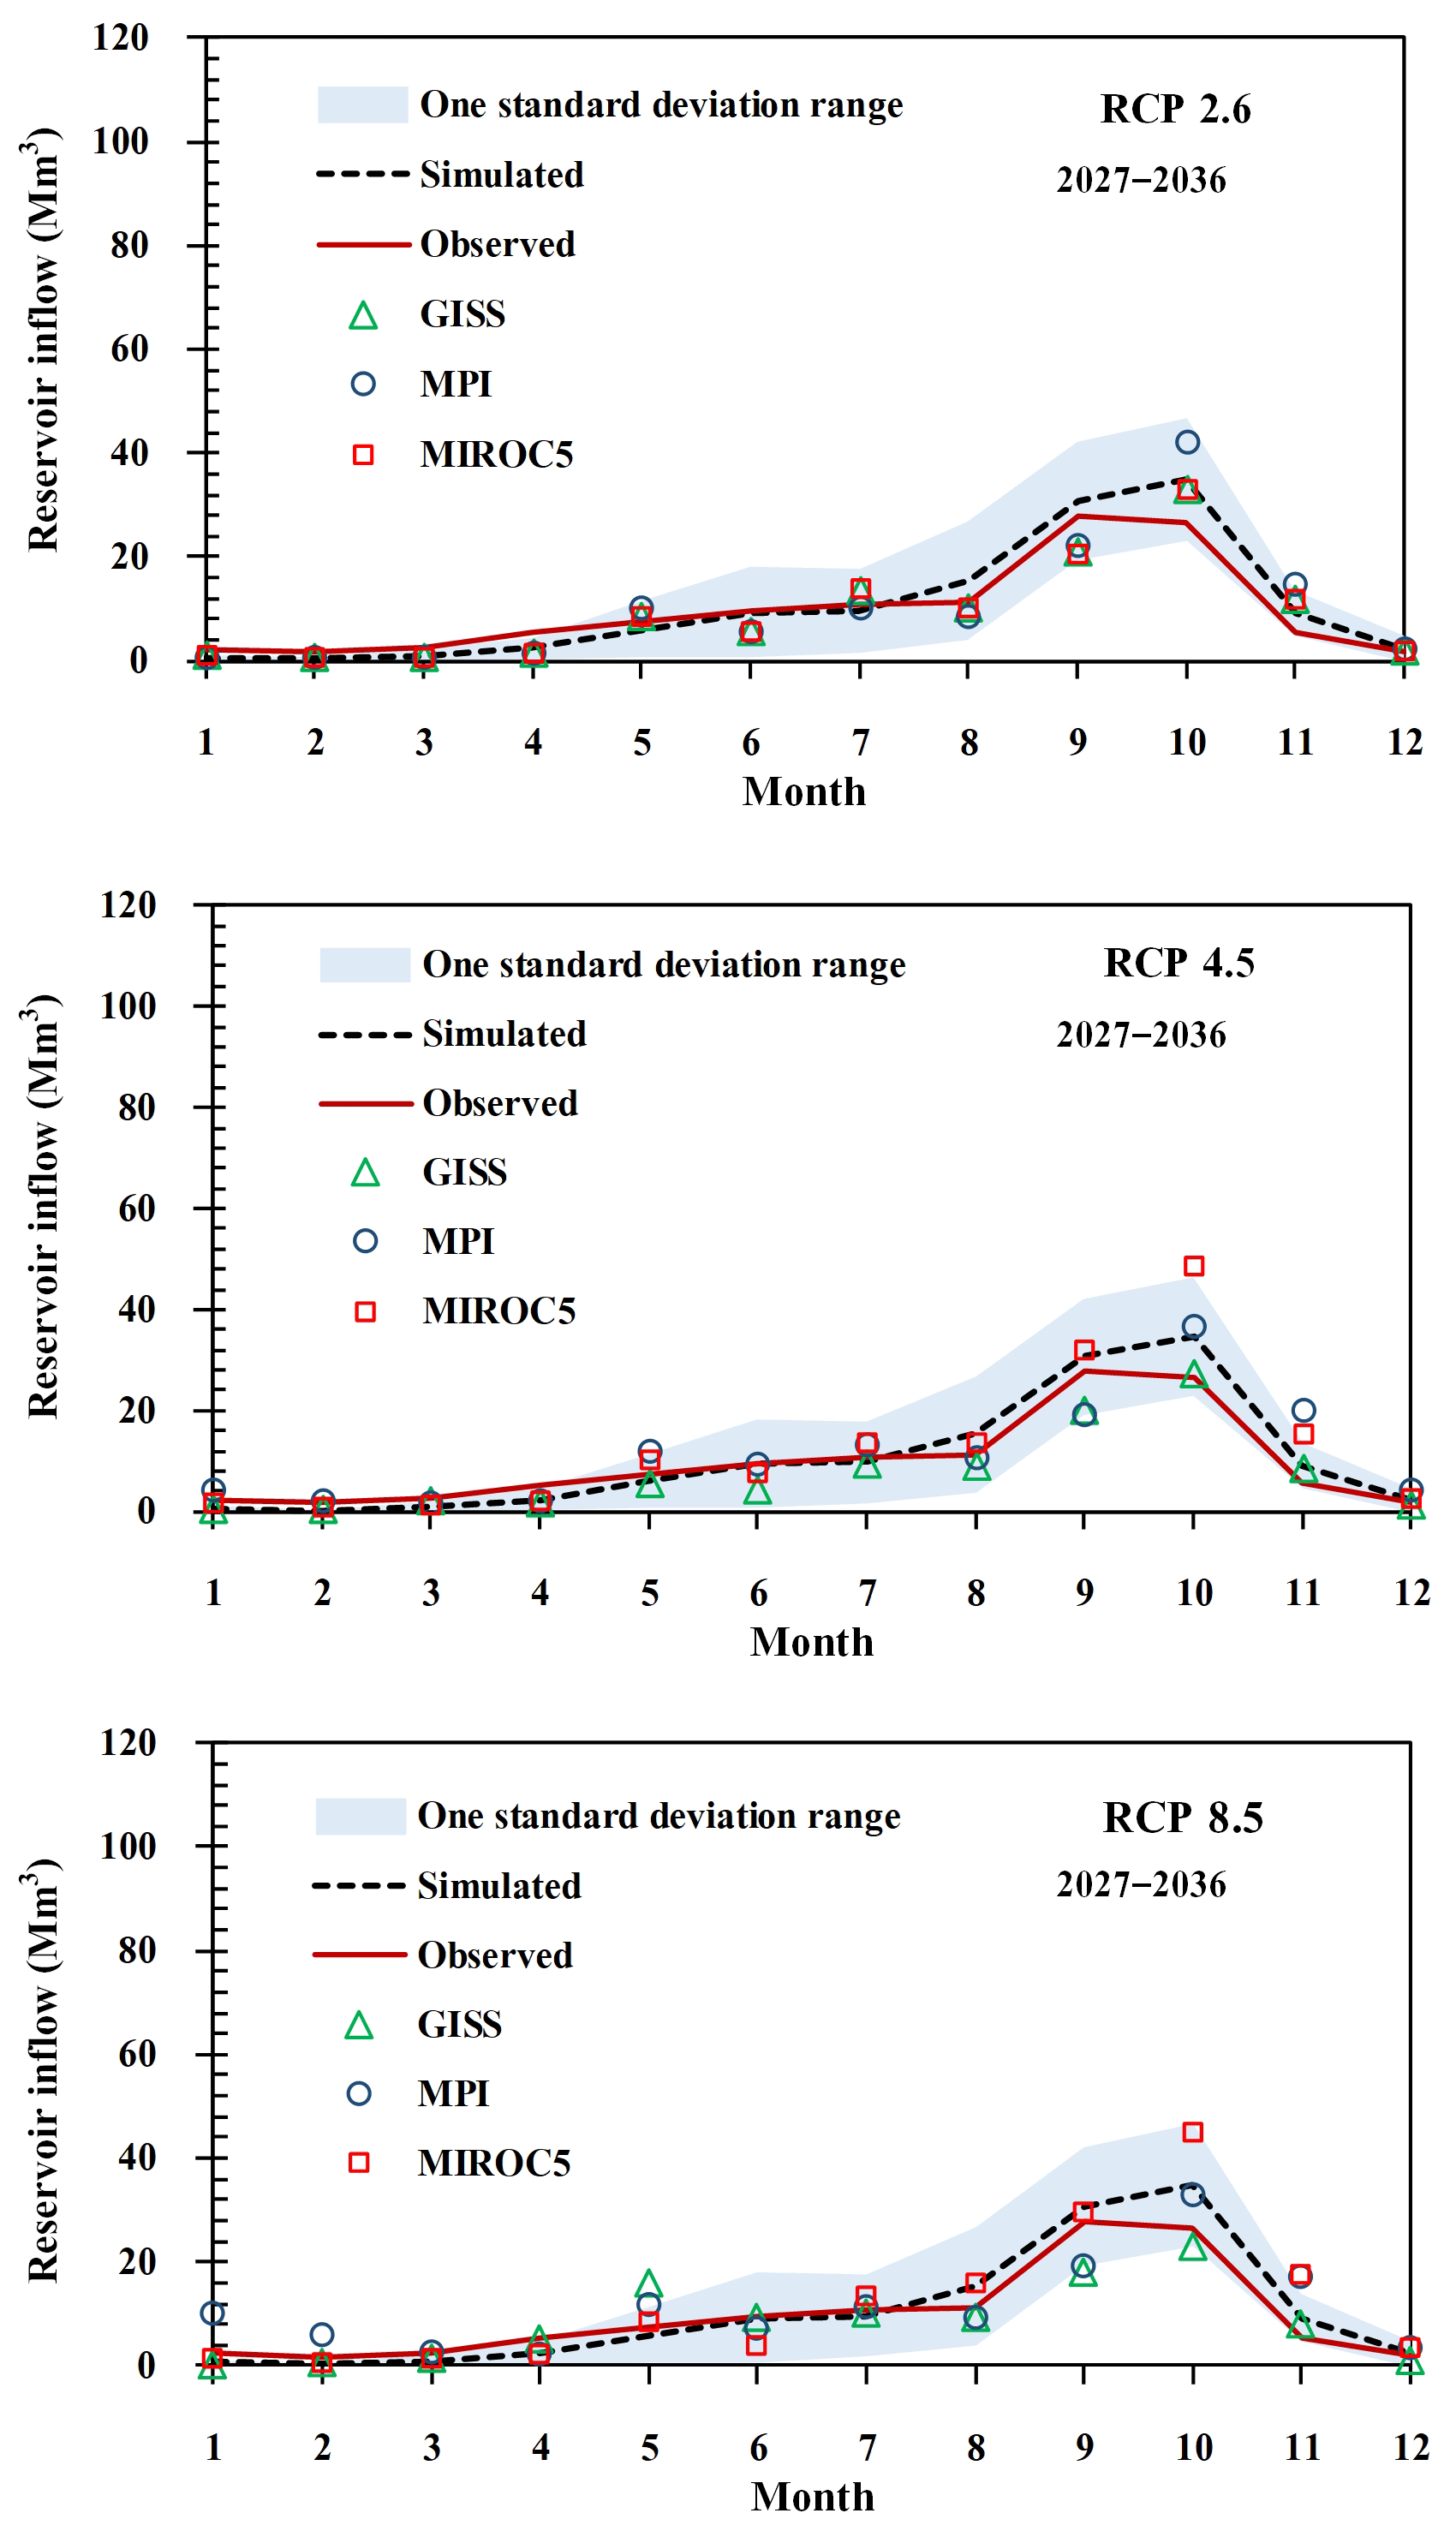
Figure 13Projected mean monthly reservoir inflows under 3 scenarios for the years 2027–2036 at Klong Yai Resevoir.
3 GCMs, namely, MIROC5, GISS and MPI GCM models were applied to assess the potential impact of climate on precipitation and temperature in the Klong Yai River basin in Thailand. The future precipitation trend under climate change scenarios were slightly increase compared to the historical period (1991–2000). Temperature projection in the future, we found that the temperature in Klong Yai River basin trend were increase apparently, and the increasing trend of temperature varied between 0.3 to 1.35 ∘C relative to the past observation.
The impacts of climate change on water resources assessment in the Klong Yai River basin during 2017–2036 clearly are the reduction of streamflow volume. Relatively low amount of water storage for 3 reservoirs in the basin is expected as the direct impact of changing climate. An increasing rate of evapotranspiration is also expected due to surface temperature rise.
River flow data were obtained from Royal Irrigation Department (RID), Thailand and are not available to the public as far as the authors know.
CE and CK developed the SWAT model. CE, WP and PS have contributed to the data processing and analysis. CE overlooked this work as the project leader. CE prepared the manuscript with contributions from all co-authors.
The authors declare that they have no conflict of interest.
This article is part of the special issue “Hydrological processes and water security in a changing world”. It is a result of the 8th Global FRIEND–Water Conference: Hydrological Processes and Water Security in a Changing World, Beijing, China, 6–9 November 2018.
This work was supported by the Petroleum Authority of Thailand (PTT) Research and Technology Institute. The authors wish to thank the Thai Meteorological Department (TMD)and Royal Irrigation Department (RID) for providing the climate and hydrological data used in this work.
This research was supported by the Petroleum Authority of Thailand (PTT) Research and Technology Institute (grant no. PR1110010318).
Arnold, J. G., Srinivasan, R., Muttiah, R. S., and Williams, J.: Large area hydrologic modelling and assessment, Part I: Model development, J. Am. Water Resour. As., 34, 73–89, https://doi.org/10.1111/j.1752-1688.1998.tb05961.x, 1998.
Alcamo, J., Flörke, M., and Märker, M.: Future long-term changes in global water resources driven by socio-economic and climatic changes, Hydrol. Sci. J., 52, 247–275, https://doi.org/10.1623/hysj.52.2.247, 2007.
Monteith, J. L.: Evaporation and environment, Sym. Soc. Exp. Biol., 19, 205–234, https://doi.org/10.1002/qj.49710745102, 1965.
Hansen, J., Sato, M., Ruedy, R., Lo, K., Lea, D. W., and MedinaElizade, M.: Global temperature change, P. Natl. Acad. Sci. USA, 103, 14288–14293, 2006.
Hanasaki, N., Fujimori, S., Yamamoto, T., Yoshikawa, S., Masaki, Y., Hijioka, Y., Kainuma, M., Kanamori, Y., Masui, T., Takahashi, K., and Kanae, S.: A global water scarcity assessment under Shared Socio-economic Pathways – Part 2: Water availability and scarcity, Hydrol. Earth Syst. Sci., 17, 2393–2413, https://doi.org/10.5194/hess-17-2393-2013, 2013.
Jones, N.: Climate assessments: 25 years of the IPCC, Nature, 501, 298–299, https://doi.org/10.1038/501298a, 2013.
Lee, J. and Wang, B.: Future change of global monsoon in the CMIP5, Clim. Dynam., 42, 101–119, https://doi.org/10.1007/s00382-012-1564-0, 2012.
Lehner, B., Döll, P., Alcamo, J., Henrichs, T., and Kaspar, F.: Estimating the Impact of Global Change on Flood and Drought Risks in Europe: A Continental, Integrated Analysis, Climatic Change, 75, 273–299, https://doi.org/10.1007/s10584-006-6338-4, 2006.
Limjirakan, S. and Limsakul, A.: Observed Trends in Surface Air Temperatures and Their Extremes in Thailand from 1970 to 2009, J. Meteorol. Soc. Jpn., 90, 647–662, https://doi.org/10.2151/jmsj.2012-505, 2012a.
Limjirakan, S. and Limsakul, A.: Trends in Thailand pan evaporation from 1970 to 2007, Atmos. Res., 108, 122–127, https://doi.org/10.1016/j.atmosres.2012.01.010, 2012a.
Polanco, E. I., Fleifle, A., Ludwig, R., and Disse, M.: Improving SWAT model performance in the upper Blue Nile Basin using meteorological data integration and subcatchment discretization, Hydrol. Earth Syst. Sci., 21, 4907–4926, https://doi.org/10.5194/hess-21-4907-2017, 2017.
Stocker, T. F., Qin, D. G., Plattner, K.,Tignor, M., Allen, S., Boschung, J., Nauels, A., Xia, Y., Bex, V., and Midgley, P.: Climate change 2013: the physical science basis., Cambridge University Press, Cambridge, 159–254, https://doi.org/10.1017/CBO9781107415324, 2013.
Watanabe, S., Hirabayashi, Y., Kotsuki, S., Hanasaki, N., Tanaka, K., Mateo, C., Kiguchi, M., Ikoma, E., Kanae, S., and Oki, T.: Application of performance metrics to climate models for projecting future river discharge in the Chao Phraya River basin, Hydrol. Res. Lett., 8, 33–38, https://doi.org/10.3178/hrl.8.33, 2014.