the Creative Commons Attribution 4.0 License.
the Creative Commons Attribution 4.0 License.
 | 16 Sep 2020
Optimization of water quality evaluation method in Three Gorges Reservoir area under different hydrological conditions
Jing Yuan
Jin-cheng Wang
Bao Qian
In order to solve the problem of lack of unified evaluation criteria for water quality evaluation in the Three Gorges Reservoir under different hydrologic condition, hydraulic retention time and flow rate were calculated wih the hydrological data of 6 intact hydrological years after the 175 m impoundment in the Three Gorges Reservoir using the concept of segment capacity. Results indicate that the hydrological conditions of the Three Gorges Reservoir have obvious spatial and temporal differences. The whole river should be evaluated according to the river standard during the wet season. In the dry season, the upstream of Wanxian should be evaluated according to the river standards and the downstream of Wanxian should be evaluated according to lake standard. The tributary bay should be evaluated according to the lake standard. The conclusion obtained by this evaluation method is consistent with actual situation of the reservoir, providing a theoretical basis and technical support for the targeted protection of water environment in river-type reservoirs.
- Article
(259 KB) - Full-text XML
- BibTeX
- EndNote


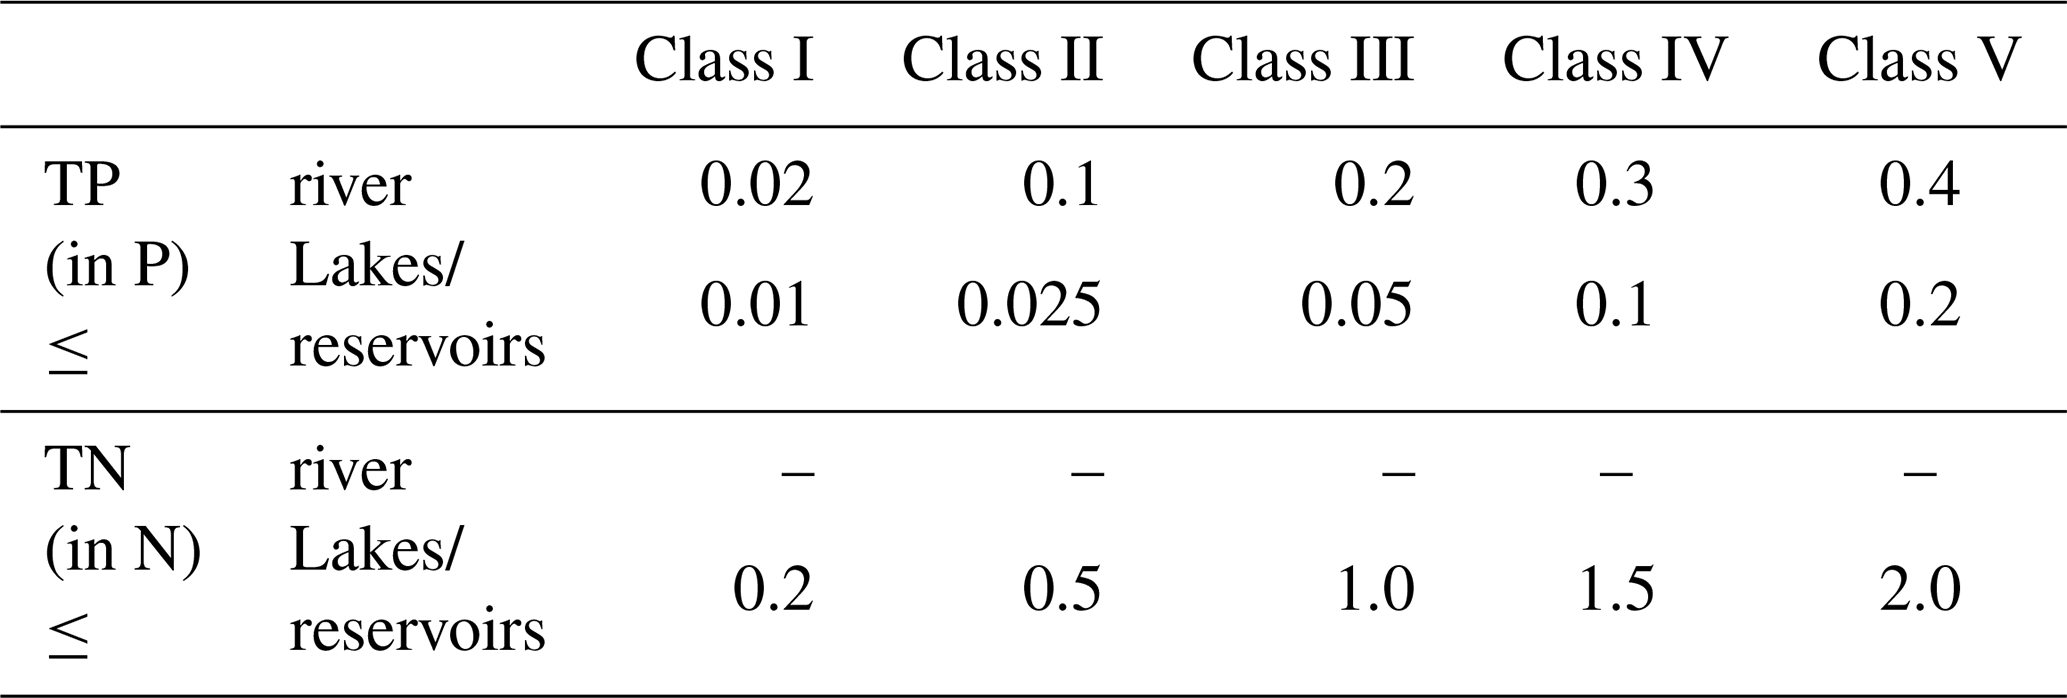
The operation of the reservoir changes the reservoir area periodically. In the “Environmental Quality Standards for Surface Water (GB3838-2002)”, different quality assessment standards are given for lakes and rivers (Table 1). The lake is directly applied to the reservoir and no distinction is made between different types of reservoirs. This has caused many confusions and difficulties in the actual water quality assessment of the reservoir area. Taking the Three Gorges Project as an example, the total storage capacity of the reservoir reached 393 billion m3 after 175 m of water storage in the reservoir. The reservoir area includes the main stream reservoir area and 29 tributaries. When assessing the water quality of the reservoir area, the water conservancy system shall evaluate the rivers according to the requirements of the “River reservoirs evaluated by rivers and lake-type reservoirs by lakes” in the Technical Regulations for Surface Water Resources Quality Evaluation (SL395-2007). Some monitoring units evaluate according to lake standards. As the total phosphorus (TP) and total nitrogen (TN) indexes are important indicators for assessing the nutritional status of water bodies, the differences in the selection of standards often lead to large differences in the conclusions of various parties.
Table 1Part water quality standard limit of environmental quality standards for surface water (unit: mg L−1.
The tributaries of the Three Gorges Reservoir have always adopted the river evaluation standard and the evaluation results have not changed much before and after the impoundment of the reservoir. However, the water bloom phenomenon rarely occurs in the tributary bays before the impoundment of the reservoir. After the impoundment of the reservoir, 26 of the 29 tributaries had blooms (Calf. Limnology, 2011). The conclusions drawn from the evaluation of rivers are inconsistent with the actual situation. The applicability of the existing evaluation standards for the Three Gorges Reservoir after impounding remains to be further verified.
At present, there is a lack of available research cases and few studies systematically considering the main reservoir area and tributaries evaluation criteria for the Three Gorges Reservoir after impoundment. This paper mainly analyzes the water quality evaluation criteria selection and influencing factors in the reservoir area under the heterogeneous hydrology through the data of 6 complete hydrological years after the impoundment of the Three Gorges Reservoir. Therefore, it provides the basis for the water quality evaluation of the Three Gorges Reservoir and also provides a reference for other people to evaluation the water quality of manual controlling water bodies (such as artificial lakes, artificially controlled rivers).
The main influencing factors of eutrophication in the Three Gorges Reservoir area can be divided into three categories: nutrition factors (nitrogen, phosphorus, etc.); environmental factors (water temperature, light, transparency, etc.) and hydrological factors (velocity, flow rate, hydraulic retention time). Changes in hydrological factors such as hydraulic retention time and flow rate is the key factor leading to eutrophication of water bodies and aggravating water bloom (Wang, 2012).
2.1 Analysis of the effect of hydraulic retention time
The hydraulic retention time is directly related to the sedimentation of suspended solids in reservoirs, the self-purification of nutrients, and the maintenance and reproduction of plankton populations (Wang et al., 2004). The increase in hydraulic retention time means the probability of algal overgrowth is greatly increased (Milan et al., 1995). The experience of some reservoirs shows that even if eutrophication conditions is reached, as long as the hydraulic retention time does not exceed 2 weeks, blooms rarely occur (Kawara et al., 1998; Lin et al., 2009), and the hydrological characteristics of the reservoir are similar to those of rivers. When blooms occur, the guarantee rate of maximum hydraulic retention time is usually greater than 80 %. Controlling the hydraulic retention time of the water can effectively control algal overgrowth. At 25 to 15 ∘C, Qingcaosha Reservoir reached 15 000 per mL of “bloom” alert value corresponding to the maximum hydraulic retention time is 15–40 d (Lin et al., 2009). The United Nations Environment Program (UNEP) Integrated River Basin Management Guidelines recommend that the hydraulic retention time of reservoirs generally not exceed 30 d and there are 4 weeks as the boundary (Gu et al., 2011). Some scholars also use the 20 and 300 d from the perspective of ecological indicators as the demarcation standard for river-type, transitional, and lake-type reservoirs (Zheng et al., 2006). Combined with practical experience, this paper uses the hydraulic retention time of 30 and 300 d as the boundary, as the distinguishing standard for river-type, transitional, and lake-type reservoirs.
2.2 Analysis of flow rate
The flow rate conditions have an important effect on the ecosystem in the water body. With the increase of the flow rate, the chlorophyll content of the algae increases and then decreases. Too high flow rate or too low flow rate is not suitable for the growth of algae. The critical flow rates of different algae ranged from 0.01, 0.03 to 0.04, and 0.05 m s−1 (Jiao, 2007).
Flow rate is also an important basis for distinguishing between rivers and lakes. Some scholars use 0.1 and 0.001–0.01 m s−1 as the boundary of river and lake velocity (Technological regulations for surface Water resources quality assessment, 2007). Some scholars also use 0.03 and 0.01 m s−1 as the boundary values of river-type, transition-type and lake-type reservoirs (Zheng et al., 2006). Considering the principle of “the most unfavorable” and the actual conditions of the Three Gorges Reservoir area, this paper proposes a rough classification of the speed of the water body type: the lake flow rate is <0.01 m s−1, the transitional flow rate is 0.01–0.05 m s−1, suitable for Lake evaluation standard; river type flow rate is >0.05 m s−1, suitable for river evaluation standard.
When the criteria for dividing hydraulic retention time and flow velocity are inconsistent, the “least unfavorable” principle should be used to apply the lake evaluation standard.
2.3 Statistical methods
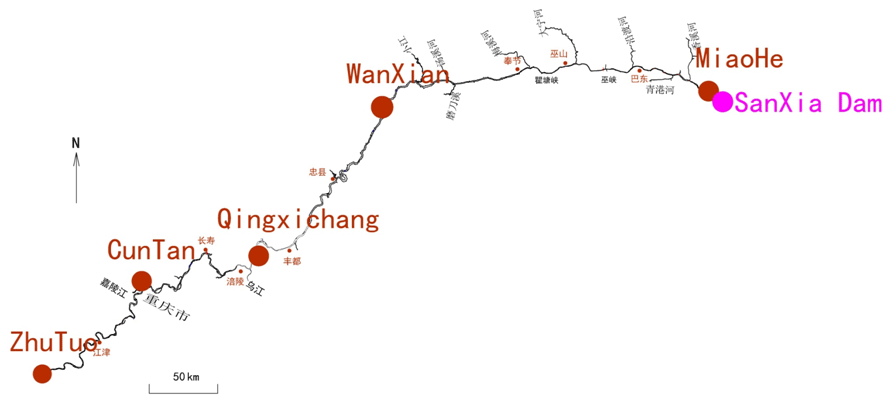
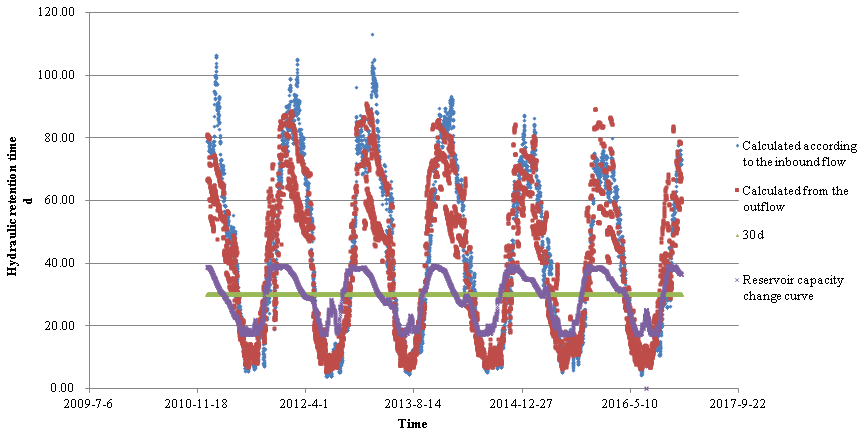
The total designed storage capacity of the Three Gorges reservoir area is 39.3 billion m3. The scope of the reservoir area is shown in Fig. 1. The reservoir water level is not same everyday and the seasonal variation is between 145–175 m. This will have a great impact on the storage capacity. Based on the storage capacity curve of storage capacity-water level-flow, this paper derives the storage capacity of the reservoir under the dam water level and then estimates the total hydraulic retention time based on the inflow or outflow. In order to compare whether the change trend of storage capacity and hydraulic retention time is consistent, the storage capacity change trend and the hydraulic retention time trend are compared. The result is shown in Fig. 2.
Applying segment storage, river channel large section data, the telemetry data of the water level station and the real-time operation data of the reservoir, segment storage capacity, segment hydraulic retention time and the average cross-section velocity were calculated. Because the Three Gorges Reservoir was filled in water at 175 m in October of 2010, this paper has calculated the hydraulic retention time and flow rate information from 2011 to 2016. The typical daily statistics are shown in Table 3.
Segment hydraulic retention time = segment storage capacity ∕ storage flow
Average cross-section flow rate = cross-sectional flow ∕ cross-section area
3.1 Analysis of spatial and temporal changes in main stream
From Fig. 2, the hydraulic retention time of the reservoirs in different water periods varies significantly and differs by 2 orders of magnitude. The hydraulic retention time agrees well in the flood season and the flat water period. But in the dry season, the hydraulic retention time calculated from the outflow is less than the hydraulic retention time calculated from the inbound flow. Because the outbound flow reflects the actual operation of the Three Gorges Reservoir, such high dams should pay attention to the impact of the outflow on the hydraulic retention time.
Table 2Mileages of upstream and downstream from the Dam of the Three Gorges.


Figure 3Statistics of the ratio of section storage capacity of the Three Gorges reservoir area from 2011 to 2016.
During the period of statistics, all hydraulic retention time is less than 300 d, which is a transitional or river-type reservoir; The time shorter than 30 d is 955 d, about 43.26 % of the total observation time. From May to October of each year, the hydraulic retention time from the tail to the head of the reservoir is short. The flow velocity near the reservoir head has a downward trend, but difference is small and its hydrological characteristics are close to the river. The shortest and longest hydraulic retention time of the Three Gorges Reservoir is stable, which is in June to July and January to February every year. Therefore, the statistical data of the segment storage capacity and the segment hydraulic retention time collect the data of 1 February and 1 July of each year (the data of nearest date are selected if there is no data on these days).
From Table 3 and Fig. 3, the hydraulic retention time from the end of the reservoir to the head of the reservoir gradually increases, and the flow rate gradually decreases. The water inventory of the three Gorges Reservoir presents obviously spatiotemporal heterogeneity. From November to next April each year, the reservoir has a high-water level, the water flow slows down, the storage capacity is large and the water environment is stable, which makes a lot of sediment deposition, high light transmittance and conducive to the occurrence of water bloom. The closer to the head of the library, the closer it is to the characteristics of the lake.
Due to the obvious longitudinal gradient distribution in the reservoir, the evaluation conclusions obtained by using single evaluation methods such as lakes or rivers do not conform to the actual situation. Therefore, new assessment methods need to be developed. However, there is no quantitative basis for the vertical division of the reservoir.
3.2 Evaluation of vertical zoning of main reservoir area during dry season
The Three Gorges Reservoir is a typical river-type reservoir. The relationship between the upper and lower reaches of the Three Gorges Reservoir area and the distance from the dam are detailed in Table 2.
The Zhuxi-Wanxian section accounts for 62.2 % of the total distance, but the storage capacity only accounts for about 30 %–40 % of the main stream. The fractional storage capacity accounts for a small proportion and the hydraulic retention time is shorter (the hydraulic detention time in the dry season from Zhuxi to Wanxian is approximately 30 d). It is applicable to river evaluation standards (including Zhuxi, Jiangjin, Tongguan, Cuntan, Changshou, Qing Xichang, Wanxian and other sections).
Wanxian to the dam is a transitional area (Fengjie, Guandukou, Badong, Miaohe, etc.). The distance is about 40 % of the distance, the hydraulic retention time is short in the wet period, using river evaluation standards. But in the dry season, the storage capacity of about 60 %, hydraulic retention time is long (see in Table 3), the flow rate is significantly lower than the river area, so it should be evaluated according to the lake standard.
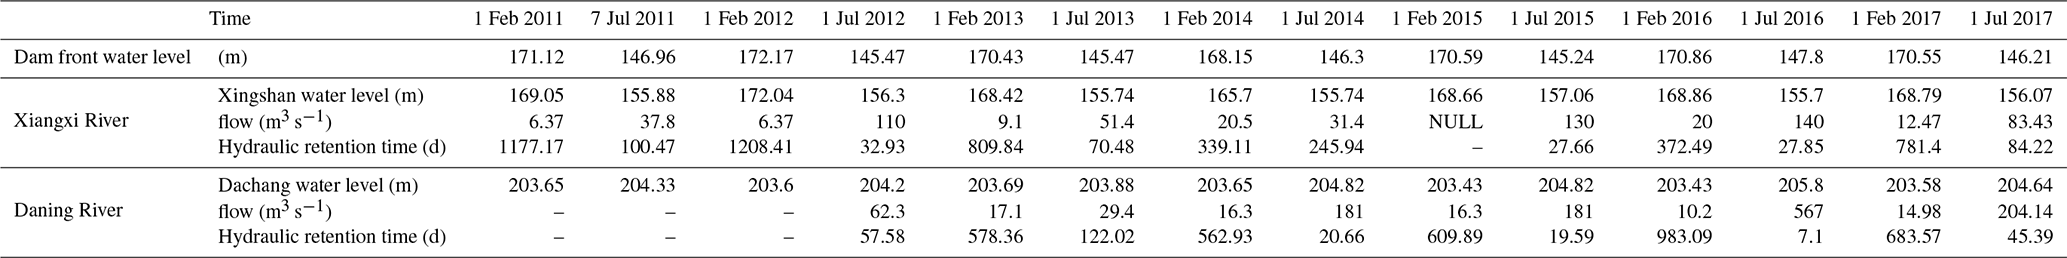
Table 3Statistical table of characteristics of the Three Gorges Reservoir in 2011–2016.
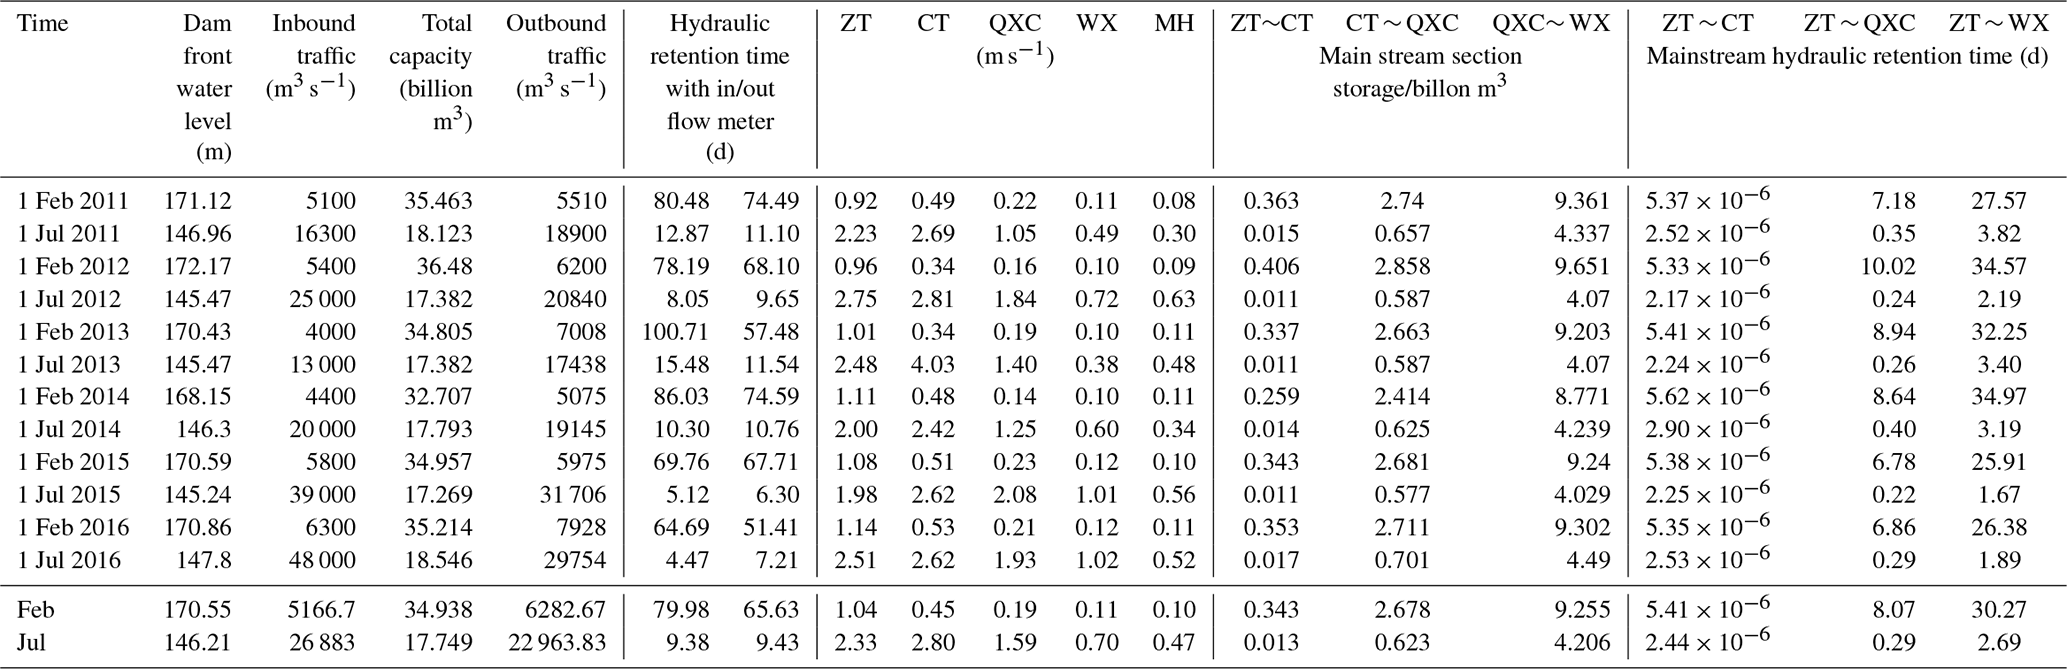
Note: Sectional section statistics are calculated based on actual measured flow rates, measured water levels, storage capacity, and average flow rates on 1 February and 1 July of each year. Abbreviation: ZT – ZhuTuo, CT– CunTan, QXC– QingXicChang, WX – WanXian, MH –MiaoHe.
3.3 Tributary evaluation
Before and after dam construction in the Three Gorges Reservoir, the total nutrient concentrations in the mainstream and tributaries of the Yangtze River did not change significantly. The TP concentration and TN concentration were 0.1–0.5 and 0.8–1.5 mg L−1, which were close to or more than the accepted eutrophication conditions (TP and TN concentrations of 0.025 and 0.2 mg L−1, respectively) (Wang, 2012). However, serious water blooms occurred in many tributaries after impoundment, especially at the late spring, early summer, late summer and early autumn. The river section where water bloom occurred was developed from 3 tributaries in 2003 to 26 tributaries (Wang, 2012). The water bloom was mostly found in the backwater section, estuary and bay area of tributaries. The highest outbreak probability was Xiangxi River, followed by Meixi River, Daning River and Xiaojiang River.
Table 4Statistical tables of typical tributary characteristics of the Three Gorges Reservoir in 2011–2016.
The phytoplankton stock is highest in the backwater area, followed by the uninundated area and the lowest in the main stream. The impact of the impoundment of the Three Gorges Project on the phytoplankton and water quality in the tributary backwater area is greater than that in the mainstream of the Yangtze River (Wang, 2012). The declining capacity of pollutant degradation in the backwater area further exacerbate the eutrophication level of the tributaries (Hu et al., 2012). According to the existing research results, the velocity of the bay tributaries in the backwater area is generally lower than 0.05 m s−1 (generally between 0.01 and 0.05 m s−1). The lake standard should be considered for evaluation.
According to hydraulic retention time, flow rate and other factors, Four sections of water quality such as Cuntan, Qingxichang, Wanxian, Badong, Miaohe, Daninghe, and Xiangxi estuaries were evaluated according to river or lake evaluation standards respectively. The results are shown in Table 5.
Table 5Comparison of some parameter evaluation grades in February and July of the Three Gorges Reservoir in 2016.
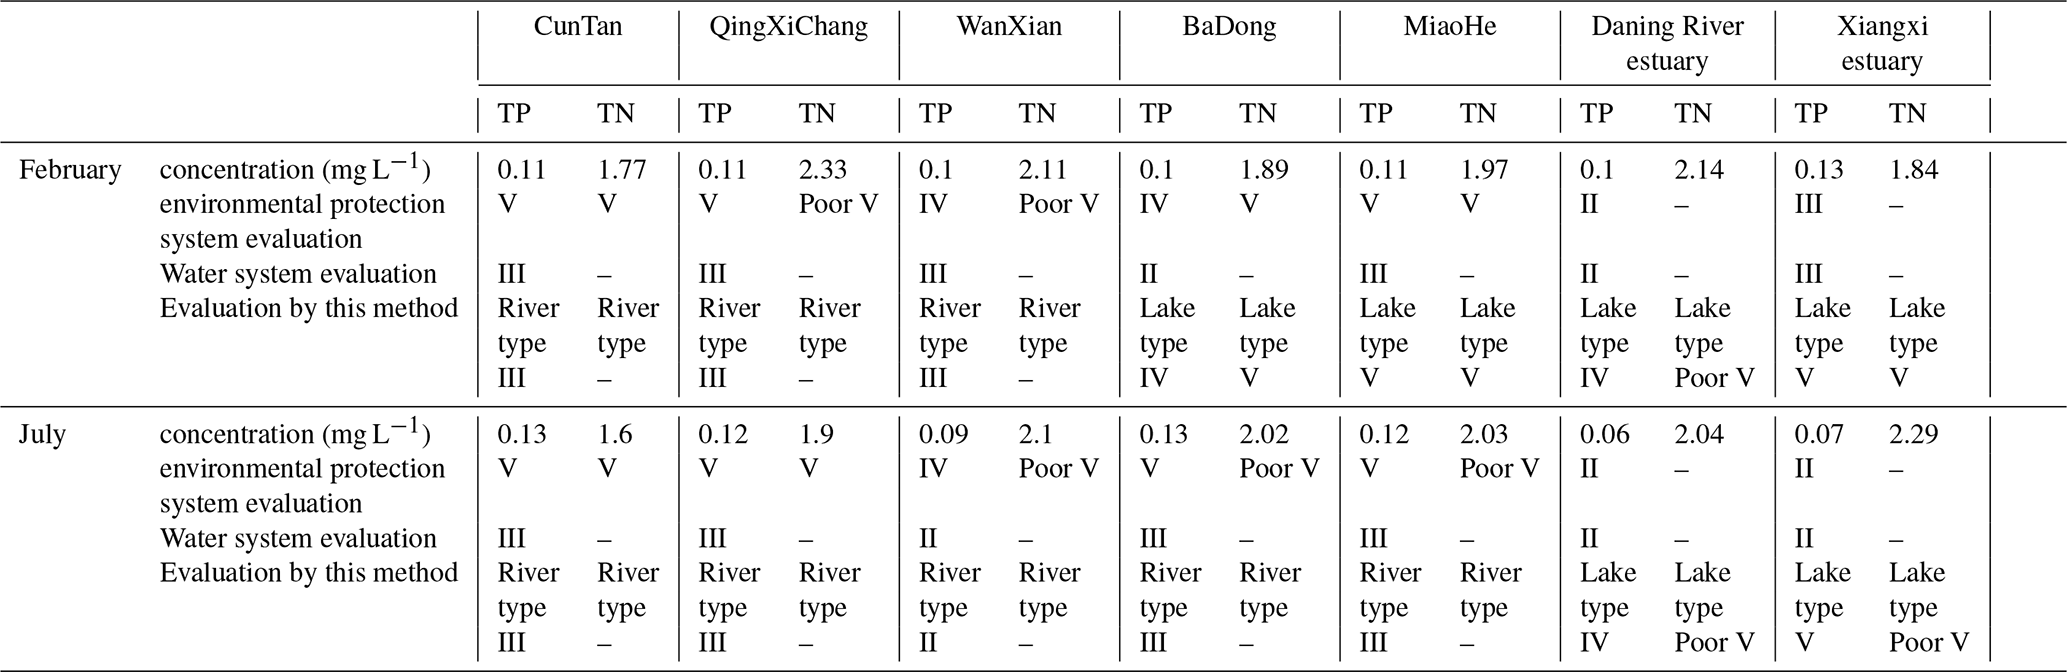
According to the results, in February, the cross section of Tongguanyi and Wanxian was classified into Class III. The main stream near the head of the reservoir is Class IV or V. The assessment criteria for tributary waters have changed from rivers to lake and the results have changed from Class II and III to non-compliance water bodies. It indicates that the risk of water bloom in the reservoir area is high. The main stream in July was river state, and the evaluation result was II and III.
Because the flow rate of the tributary is in the lake type, it is evaluated in accordance with the lake standard according to the most unfavourable principle. Most of the water quality is IV to inferior V, indicating a higher risk of blooms. This is consistent with the fact that tributaries have a high probability of occurrence of blooms. The improved evaluation results are more in line with the actual occurrence of water blooms and can better play an early warning effect.
This paper statistically analyzes the characteristics of water level, flow rate, reservoir capacity, and residence time of reservoirs in the Xiangxi and Daning rivers of the Three Gorges Reservoir (see in Table 4). It can be seen that the hydraulic retention time of the tributaries is much longer than the hydraulic retention time of the main stream. The average hydraulic retention time of the Xiangxi River and the Daning River in February and July were all longer than 30 d. The Xiangxi River near the head of the reservoir has a longer hydraulic retention time than the Daning River. This may be the reason for the high probability of outbreak of water blooms in the Xiangxi River tributaries.
At present, rivers entering warehouses generally adopt river water quality assessment standards. Water quality category is still II–III. This conclusion may be reasonable before the impoundment of the Three Gorges. However, the evaluation results after the impoundment often do not match the nutritional level. It fails to reach the warning effect and do not match the occurrence frequency of the tributaries of the tributaries. Therefore, this paper proposes that the tributaries for sampling in lakes should be used to evaluate the evaluation criteria of lake banks.
China also has many manually controlled bodies of water, such as gated lakes, canals, and rivers that run on a cascade. The hydrological and ecological characteristics of these bodies of water have changed and there are significant differences between the natural rivers and lakes. This assessment method can be used to statistically analyse the specific hydrological situation, and then select suitable water quality assessment standards to provide technical support for targeted water conservation work.
This article is about the operation and scheduling method of the Three Gorges Reservoir. The data is not publicly accessible and therefore cannot be made public.
JY and JCW contributed to the conception of the study. JY contributed significantly to analysis and manuscript preparation; JY performed the data analyses and wrote the manuscript; JY and BQ helped perform the analysis with constructive discussions.
The authors declare that they have no conflict of interest.
This article is part of the special issue “Hydrological processes and water security in a changing world”. It is a result of the 8th Global FRIEND–Water Conference: Hydrological Processes and Water Security in a Changing World, Beijing, China, 6–9 November 2018.
Thanks to Wang Jun (Former Director of Hydrology Bureau of Yangtze River Water Resources Commission) for the question of water quality evaluation method in Three Gorges Reservoir. His question promoted my thinking.
Gu, B.-H., Liu, Z.-W., and Li, K.-Y.: Limnology: Inland Water Ecosystems, Higher Education Press, Beijing, 2011.
Hu, N.-S., Liu, D.-F., Ji, D.-B., and Yang, Z.-J.: Effects of backflow of the main stream of the Three Gorges Reservoir on nutrient distribution in tributary bay, Environ. Sci. Technol., 35, 12–17, 2012.
Jiao, S.-J.: Effects of Velocity on Algae Growth in Low Velocity Rivers in the Three Gorges Reservoir Region, Southwest University, Chongqing, 2007.
Kawara, O., Yura, E., Fujii, S., and Matsumoto, T.: A study on the role of hydraulic retention time in eutrophication of the Asahi River Dam reservoir, Water Sci. Technol., 37, 245–252, 1998.
Lin, W.-Q., Gu, Y.-L., Lu, S.-Q., and Wang, X.-P.: Preliminary study on reasonable hydraulic retention time for Qingcaosha Reservoir to prevent overgrowth of algae, Water Wastewater Eng., 35, 60–62, 2009.
Milan, S., Dostálková, I., Hejzlar, J., and Vyhnálek, V.: The Effect of Reservoirs on Phosphorus Concentration, Int. Rev. Hydrobiol., 80, 403–413, 1995.
Technological regulations for surface Water resources quality assessment: SL395-2007, China Water Conservancy and Hydropower Press, Beijing, 2007.
Wang, X.-Q.: Coupling model of eutrophication and hydrodynamic water quality of the Pengxi River (Xiaojiang) in the Three Gorges reservoir area, Chongqing University, Chongqing, 2012.
Wu, H.: Achieving Water Conservation Safety of Surveillance and Surveillance – 2016 State Technological Invention Award, Second Class Project “Sensing Technique and Practice of Complex Hydraulic Concrete Structure Service Diagnosis”, China Science and Technology Awards, 66, 2017.
Zheng, B.-H., Zhang, Y., Fu, G., and Liu, H.-L.: Study on the assessment standards for nutrition status in the Three Gorges Reservoir, Acta Scientiae Circumstantiae, 26, 1022–1030, 2006.