the Creative Commons Attribution 4.0 License.
the Creative Commons Attribution 4.0 License.
 | 16 Sep 2020
Extreme flow variability analysis at the Bianouan hydrometric station on the Bia River watershed in Côte d'Ivoire
Kan Martin Kouassi
Koffi Blaise Yao
Kouakou Lazare Kouassi
Jean Biemi
Nagnin Soro
Extreme hydrological phenomena recurrence in West Africa in recent decades is a problem in the anthropized watershed management. Link analysis between extreme hydrological phenomena and climate variability is necessary to guard against their consequences. However, qualitative data accessing difficulties and explanatory variable definition of extremes hydrological phenomena limit extreme flows rate studies. This study proposes the analysis the variability of the floods and the low flows at the Bianouan hydrometric station. Thus, five (5) floods characteristics variables (QCX5, QXJA, F90p, F95p and F99p) and three (3) for, the low flows (VCN10, QJNA and F10p) were extracted daily flows from the Bianouan hydrometric station from 1 January 1962 to 31 December 2005. The variability of these extremes has been studied by the trend analysis (linear regression) and of the stationarity (Pettitt and Hubert tests). The results show that for flood variables the negative trend is very significant and ruptures are observed in 1980. For low flow variables the negative trend is significant and the ruptures are observed in 1981. From this study, we can deduce that the ruptures observed in the rains and flows average in the end 1960s and early 1970s have affected later the extreme flows around the 1980s.
- Article
(394 KB) - Full-text XML
- BibTeX
- EndNote


Floods and low flows provoke natural phenomena which qualify extreme that affect the functioning of antropized watersheds. In the face of climate change, these extreme phenomena have caused disasters in many parts of the world. They occur with increasingly higher frequency and their socio-economic impacts on the populations are more considerable. According to an OMM (2014) report, from 1970 to 2012 in Africa, 1319 disasters resulted in 698 380 casualties and losses of USD 26.6 billion. In Côte d'Ivoire, the low-flows of the years 1983–1984, caused selective power cuts which had negative consequences on the national and sub-regional West African economy. The low-flows of in 2010 caused a second period of selective power cuts with considerable financial losses for national and sub-regional companies and a financial deficit of 57 billion CFA francs to the Ivorian Company of Electricity (CIE, 2010). The transboundary basin of the Bia River with which the present study is concerned does not escape of the phenomena. Recurrent low-flows have affected Ayame dams functioning, causing downstream drying up to such an extent that it was impossible for the managers to run any turbine. Faced with these situations, link analysis between extreme hydrological phenomena and climate variability is necessary to protect against these events consequences However, qualitative data accessing difficulties and explanatory variable definition of extremes hydrological events limit extreme flows rate studies. This study proposes to analyze floods and low flows variability at the Bianouan hydrometric station. It emphasizes the intensity and duration notions in extreme flows variables choice to explain extreme events (Goubanova, 2007).
Bia is a transboundary river between Côte d'Ivoire and Ghana; it flows between latitude 5∘30′ and 5∘50′ N and between longitude 3 and 3∘ 15′ W (Fig. 1). Its source is in Kérimasso in northern Ghana and flows into the Aby lagoon in southern Côte d'Ivoire (Reizer, 1967). The catchment area of the Bia is elongated and covers an area of 9650 km2 of which 2∕3 are located in the Ghanaian territory. The rainfall analysis done by Meledje (2016), makes it possible to distinguish two (2) climatic zones on the basin of the Bia. A humid tropical zone (1460 mm) corresponding to the northern part of the basin with a single rainy season and a subequatorial zone (1870 mm) corresponding to the south of the basin with two distinct rainy seasons.
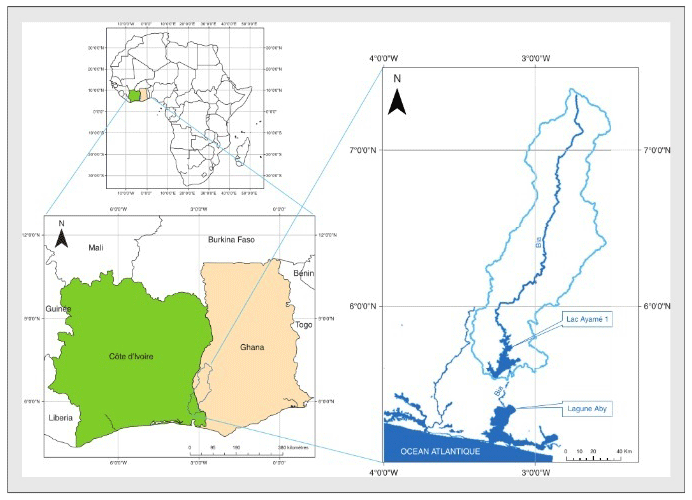
Figure 1Location of the study area (Meledje et al., 2015).
For this study we have daily discharge data provided by the Human Hydraulics sub-directorate at the Bianouan Hydrometric Station from 1 January 1962 to 31 December 2005.
The methodology adopted in this study is divided into two steps: choice and study of the variability of the variables' characteristics of the extreme flows.
4.1 Extremes flows characteristics variables choice
In this methodology, we define the multi-duration variables, the MINAN and MAXAN variables and extreme flow indices.
4.1.1 Multi-duration variables choice
These variables make it possible to take into account the duration or threshold notion in the variables choice which characterize the flows extremes. They are chosen from two value of the graded flow curve; the Q15 % and Q85 % which are the flows respectively exceeding 15 % and 85 % of the values of the graded flow curve. Thus on a moving average d days series (with d = 1, 3, 5, 10, 15, 20, 60 and 90 d), the VCNd and VCXd represent respectively the minimum and maximum values of each year (Galéa and Javelle, 2000). QCXd is the annual maximum flow greater than Q85 % and QCNd is the annual minimum flow lower than Q15 %. The Kendall rate was used to select a low flow characteristic variable among the VCNd and QCNd variables and then the high flow rate variable among the VCXd and QCXd variables.
4.1.2 MAXAN and MINAN flow variables
It is a matter of selecting for each year, the maximum flow (MAXAN) as well as the minimal flow (MINAN) which characterize respectively the high flows and the low flows.
4.1.3 Extreme flow index
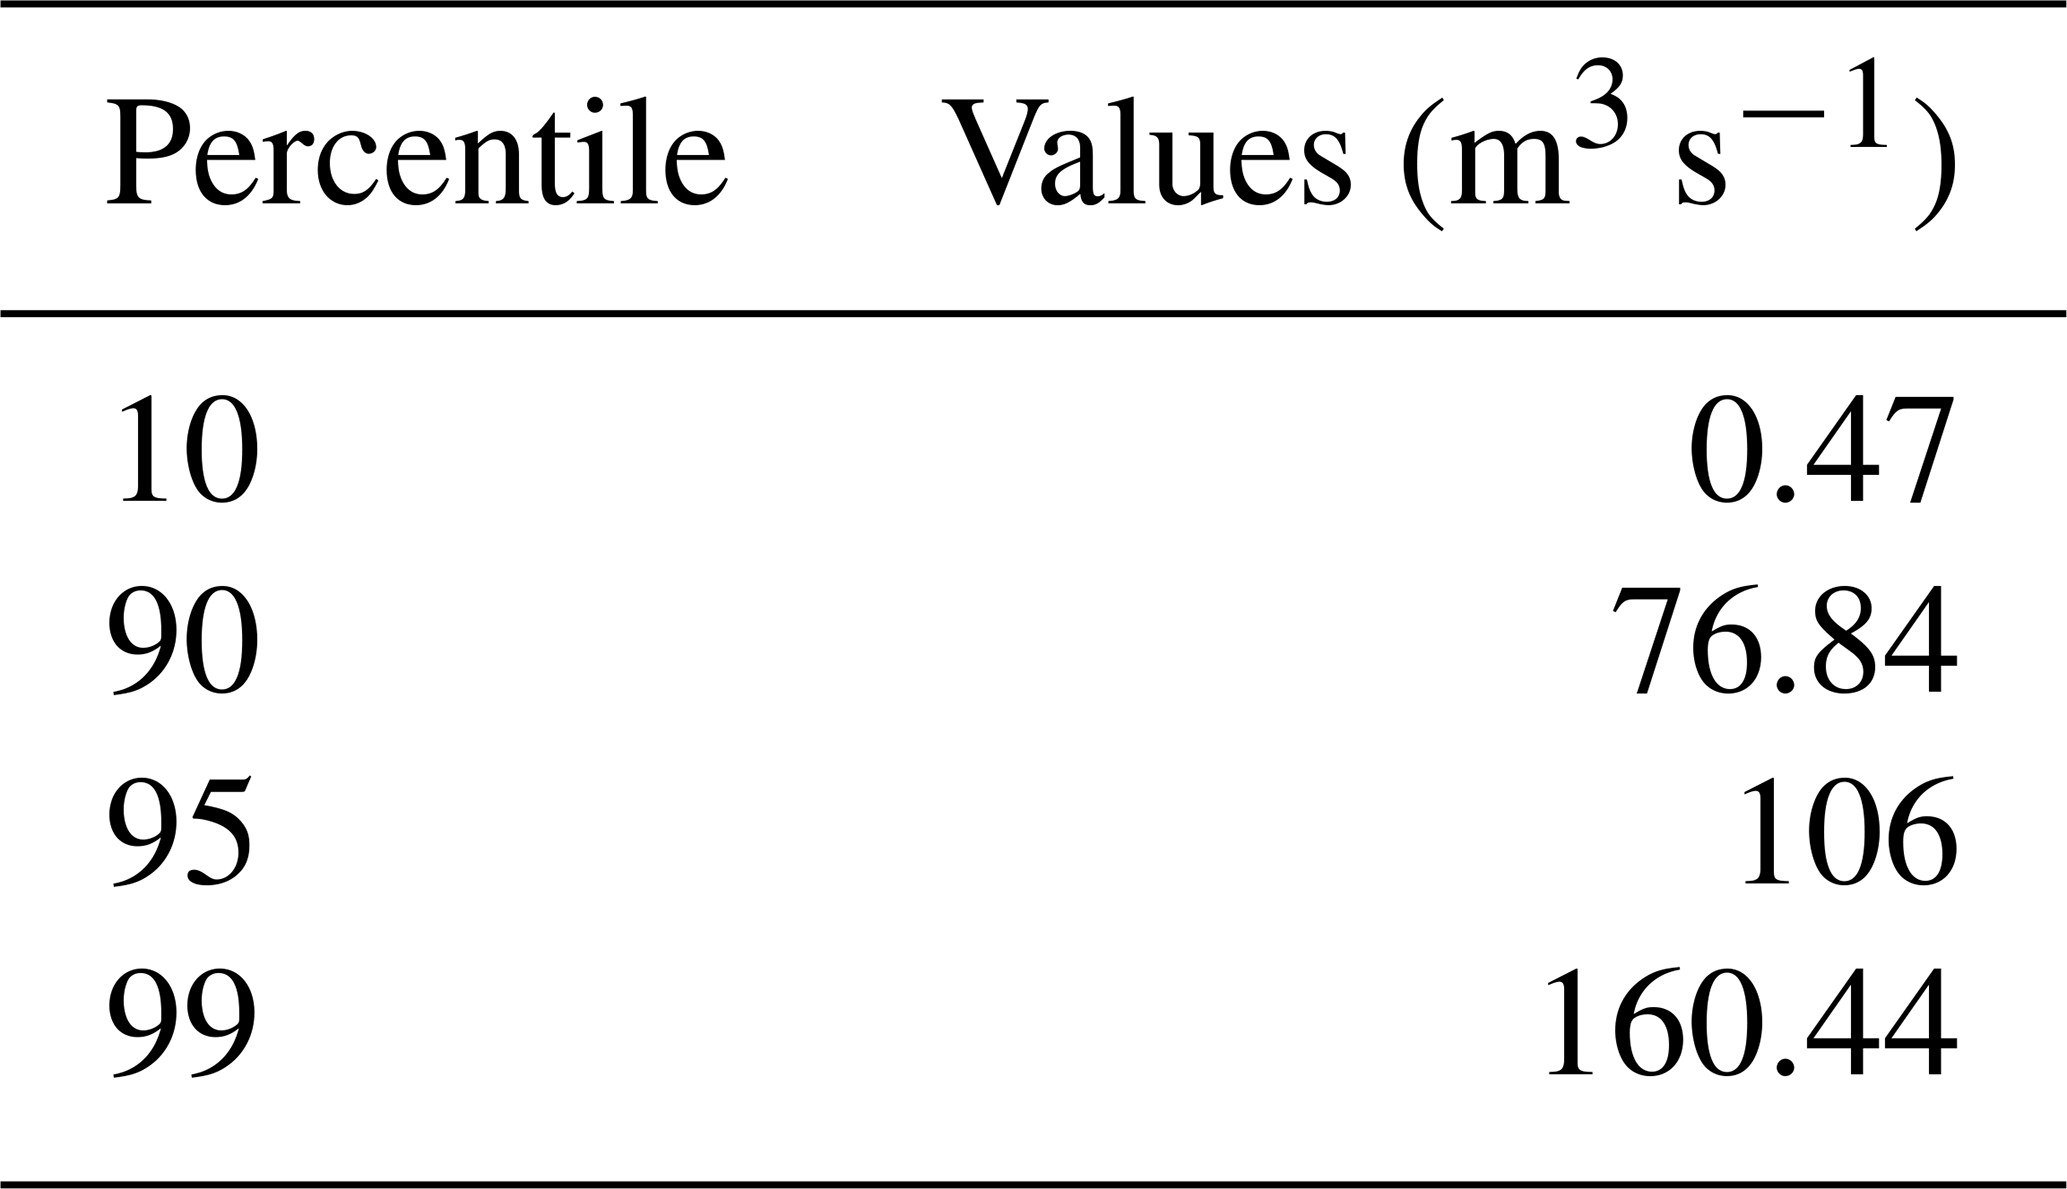
Flow rate indices are variables introduced recently by the IPCC to characterize extreme hydrological events. In this study, thresholds are defined in relation to the 10th, 90th, 95th and 99th percentiles (Table 1). The percentiles are calculated over 30 years (1956–1985) according to the recommendations of the World Meteorological Organization.

4.2 Hydrometric extremes variability study
The extreme flow and rain variability may be more damaging than a simple mean variation (Lemaître, 2002 and Karimou et al., 2015). This section objective is to evaluate the extremes flow rate variability through extreme flows characteristic variables trend and stationarity study.
4.2.1 Hydrometric extremes trend analysis
Hydrometric extremes trend analysis was carried out by linear regression between the flow rate extremes and time (in years). Slopes thus estimated were grouped into positive or negative significant trends' classes. The limit of the classes considered is defined from the Student's t-statistic used to test the hypothesis of a slope equal to 0. The trend is qualified according to the probability p of the test t applied to the regression slope.
-
If p<0.01: the trend is qualified as very significant.
-
If : the trend is qualified as significant.
-
If p≥0.05: the trend is considered insignificant.
4.2.2 Hydrometric extremes stationarity analysis
For extremes flow stationarity study, Pettitt test (Pettitt, 1979) and Hubert segmentation procedure are used to detect respectively unique and multiples ruptures in the extremes flow variables. The applicability of these two methods has been successfully verified in many studies in the West African climate context (Lubes et al., 1994).
5.1 Variables characteristics of extremes hydrometrics
The extremes of the selected flow rates are multi-duration variables, flow indices and MAXAN as well as MINAN.
5.1.1 Multi-duration variables choice
The Fig. 2 shows the curve of rated flows. From this curve, the flow rates Q85 % and Q15 % necessary for the choice of QCXd and VCXd variables are respectively 68.90 and 1.25 m3 s−1.
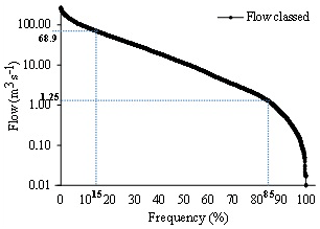
The Fig. 3 summarizes the average Kendall rates calculated on the different multi-duration variables. The analysis of this figure made it possible to choose QCX5 and VCN10 flow rates to characterize the flow extremes at the Bianouan hydrometric station from 1962 to 2005, insofar as these two variables record the highest Kendall rates. Indeed, the QCX5 flow rate is the maximum annual flow rate above 68.29 m3 s−1 calculated on a moving average of 5 consecutive days, while the VCN10 flow represents annual minimum flow over a moving average of 10 consecutive days.

5.1.2 Extremes flow index choice
The Table 2 summarizes percentiles calculated over 30 years. The exceptional (F99p) and extremely high (F95p) flow rates are defined from the respective values of 160.4 and 106 m3 s−1, while the high (F90) and low (F10) flow rates are chosen from 76.84 and 0.47 m3 s−1.
In addition, the maximum (MAXAN) and minimum (MINAN) flow rate for each is chosen from 1 January 1962 to 31 December, 2005, are respectively noted QJXA and QJNA.
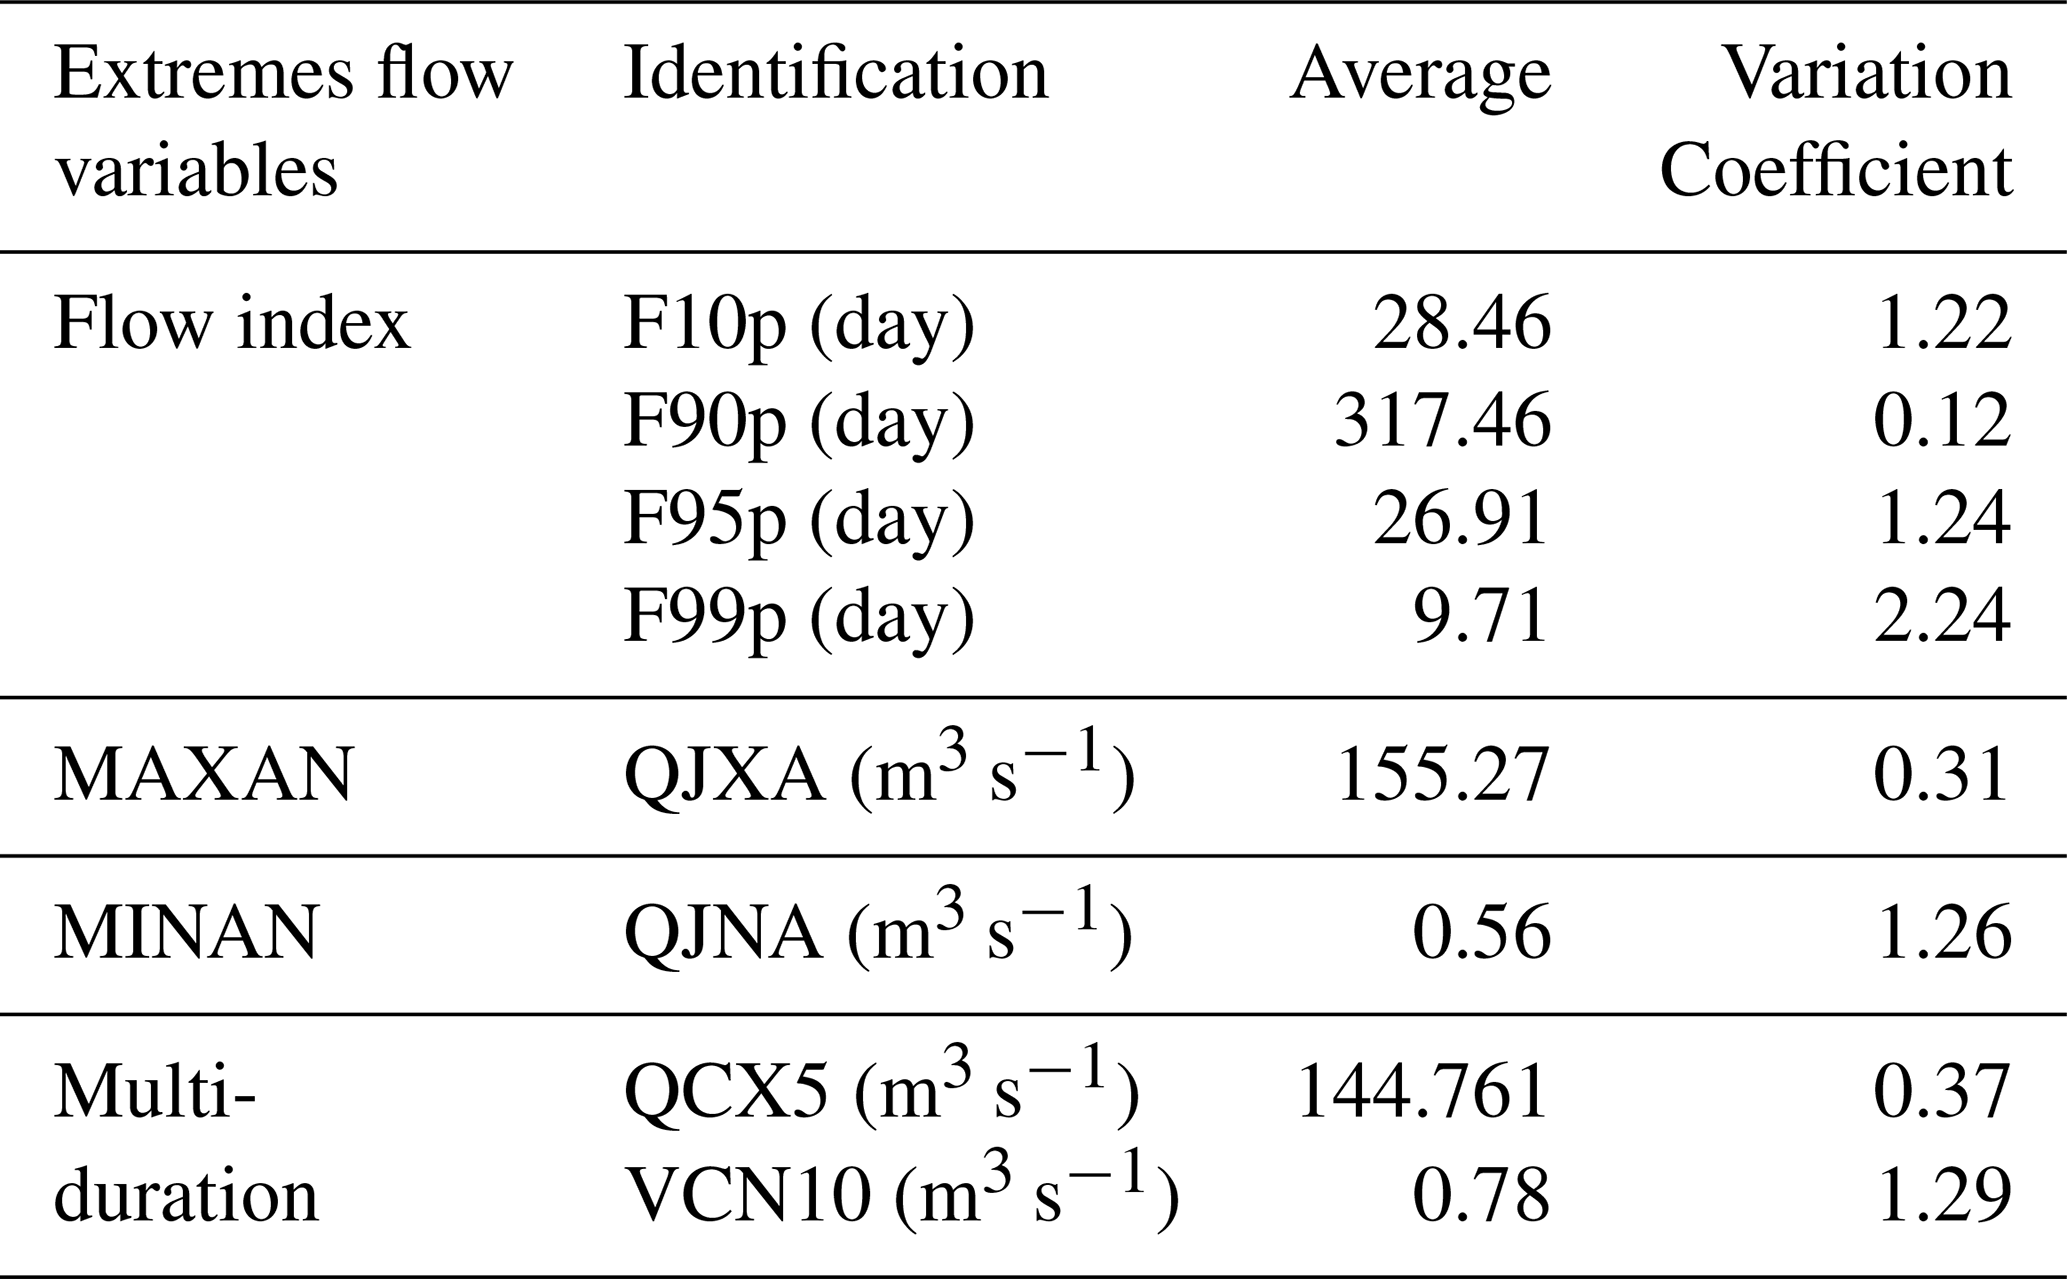
Table 3 summarizes the flow extremes used in this study. This table shows that, on average, the QJNA and VCN10 variables remain below 1 m3 s−1 with coefficients of variation exceeding 1. QCX5 and QJXA, on the other hand, they exceed 100 m3 s−1 but are associated with coefficients of variation lower than 1. For the extreme flow indices, the high flow (F90p) averages 317.46 d while the exceptional flow (F99p) which remains lower than 10 d (9.7 d) is recorded. The low flow (F10p) and very high flow (F95p) are on average 28.46 and 26.91 d respectively. Exceptional flow has noted a greatest variability (2.24) whereas a contrary observation is made with the strong flow (0.12).
Table 3Extreme flow characteristic variables average (1962–2005).
In the rest of our analysis, the hydrological extremes retained at the Bianouan hydrometric station from 1962 to 2005 are summarized in the variables characterizing the low flow or low flows (VCN10, QNJA and F10p) and those characterizing the strong flows or floods. (QCX5, QXJA, F90p, F95p and F99p). This variability was assessed by analyzing the trend (linear regression) and stationarity (Pettitt's test and the Hubert segmentation procedure) of these variables.
5.2 Hydrological extremes variability study
5.2.1 Hydrological extremes trend analysis
The results in the Table 4 show that an average trend of 0.5 % per decade is observed. This trend which has been very significant for high flow variables proves to be negative with variables QJXA, QCX5, F95p and F99p and positive with variable F90p. The significant trend observed at low flow have been negative for the variables VCN10 and QJNA and then positive with the variable F10p.
Table 4Trend (% by decade) of high flow and low flow variables.
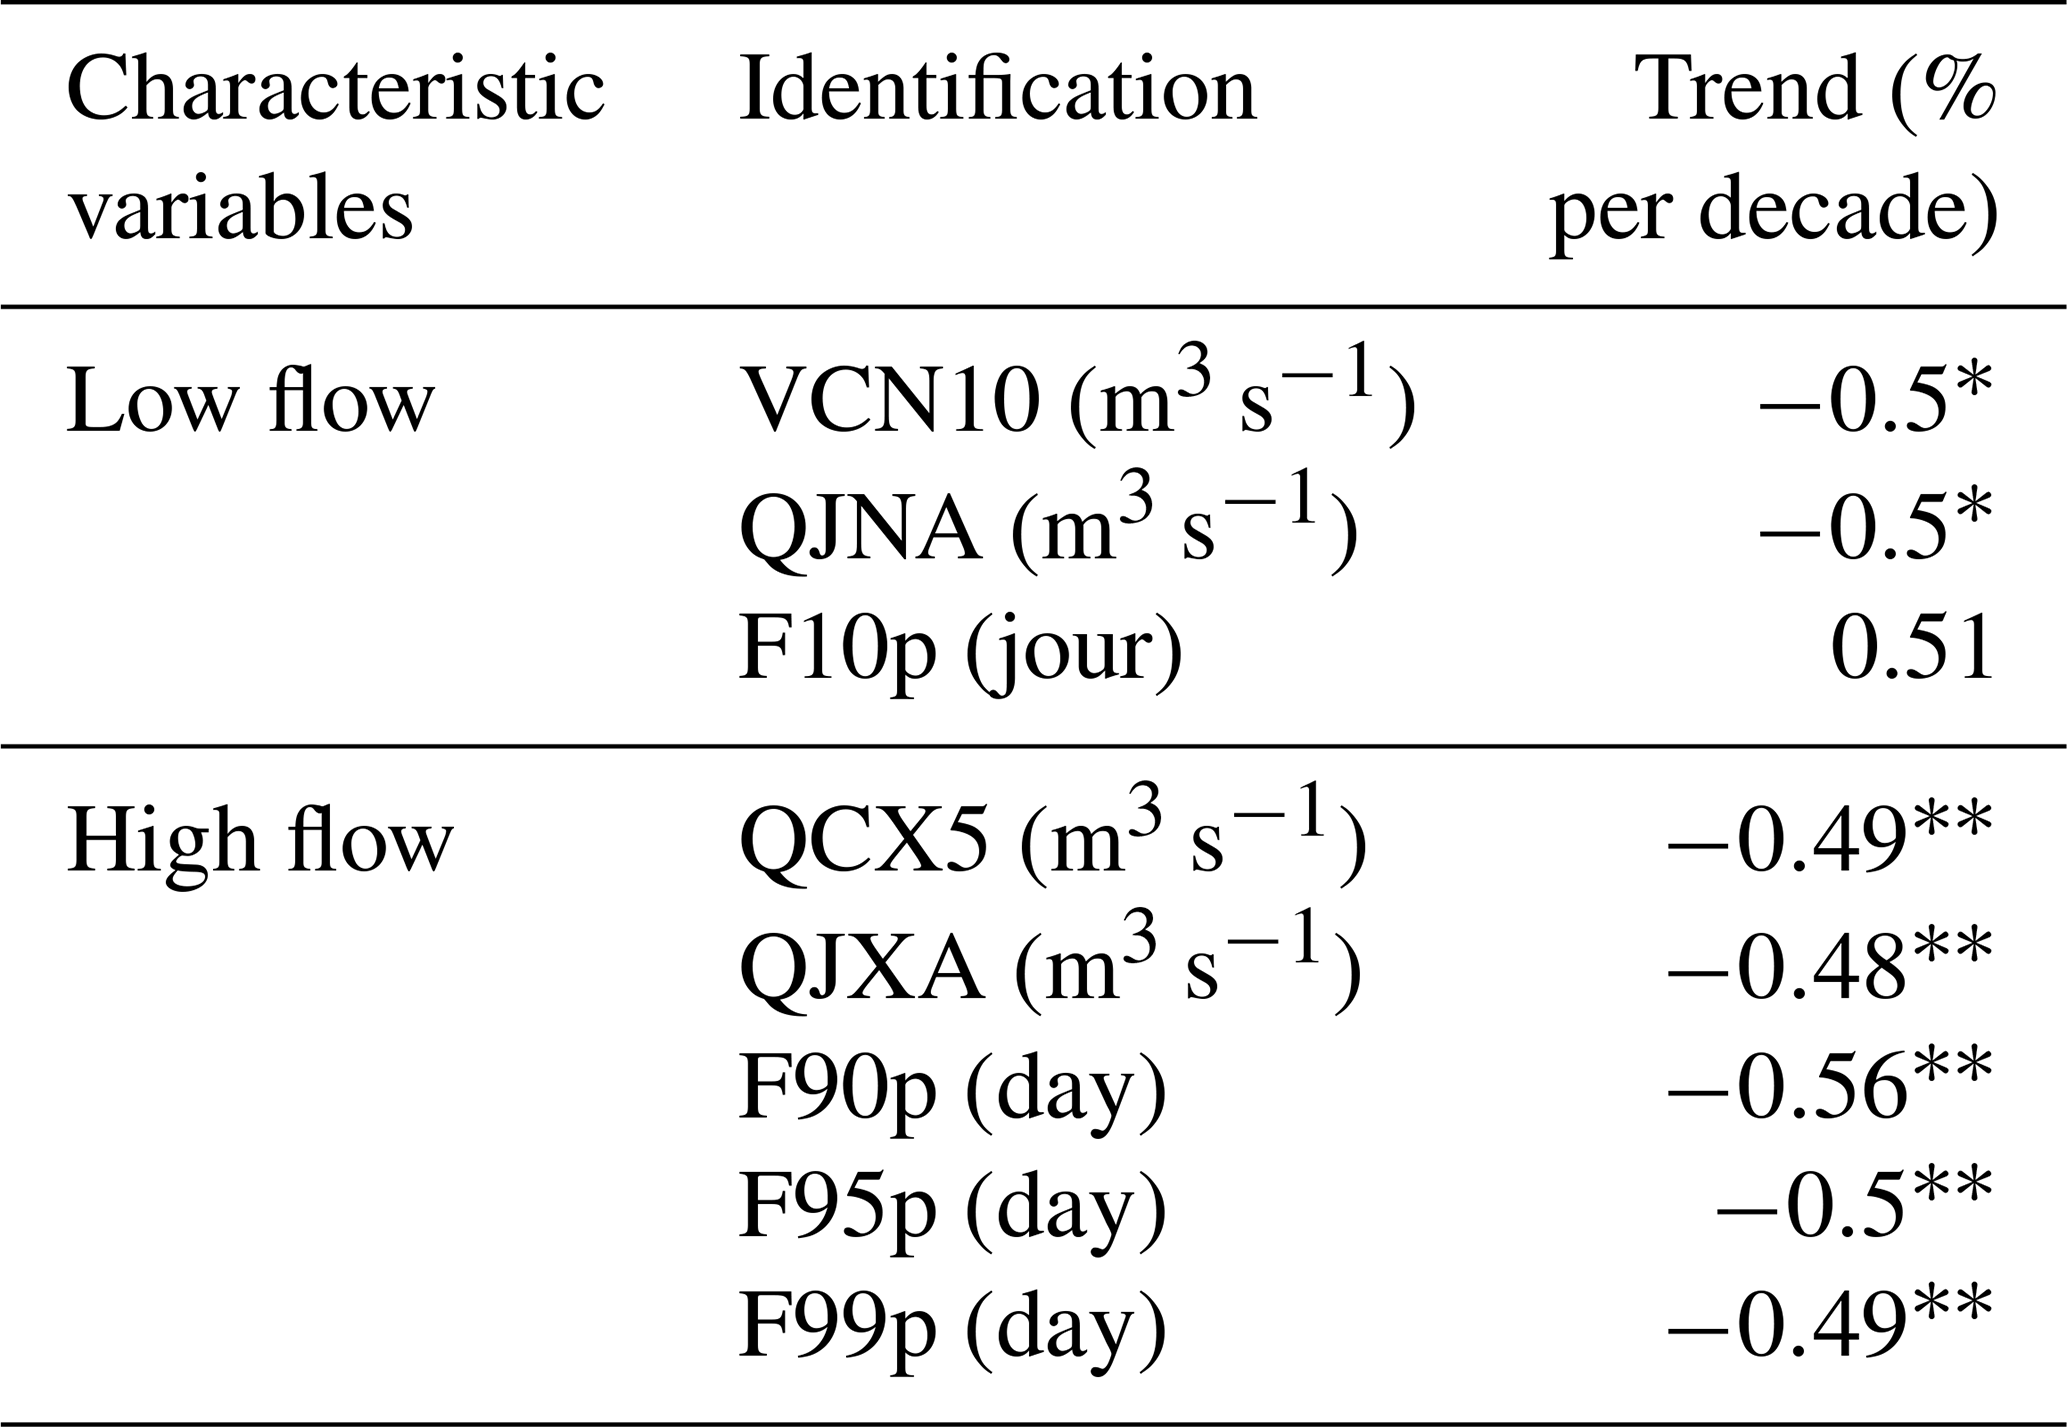
∗ significant trend, very significant trend.
5.2.2 Hydrological extremes stationarity
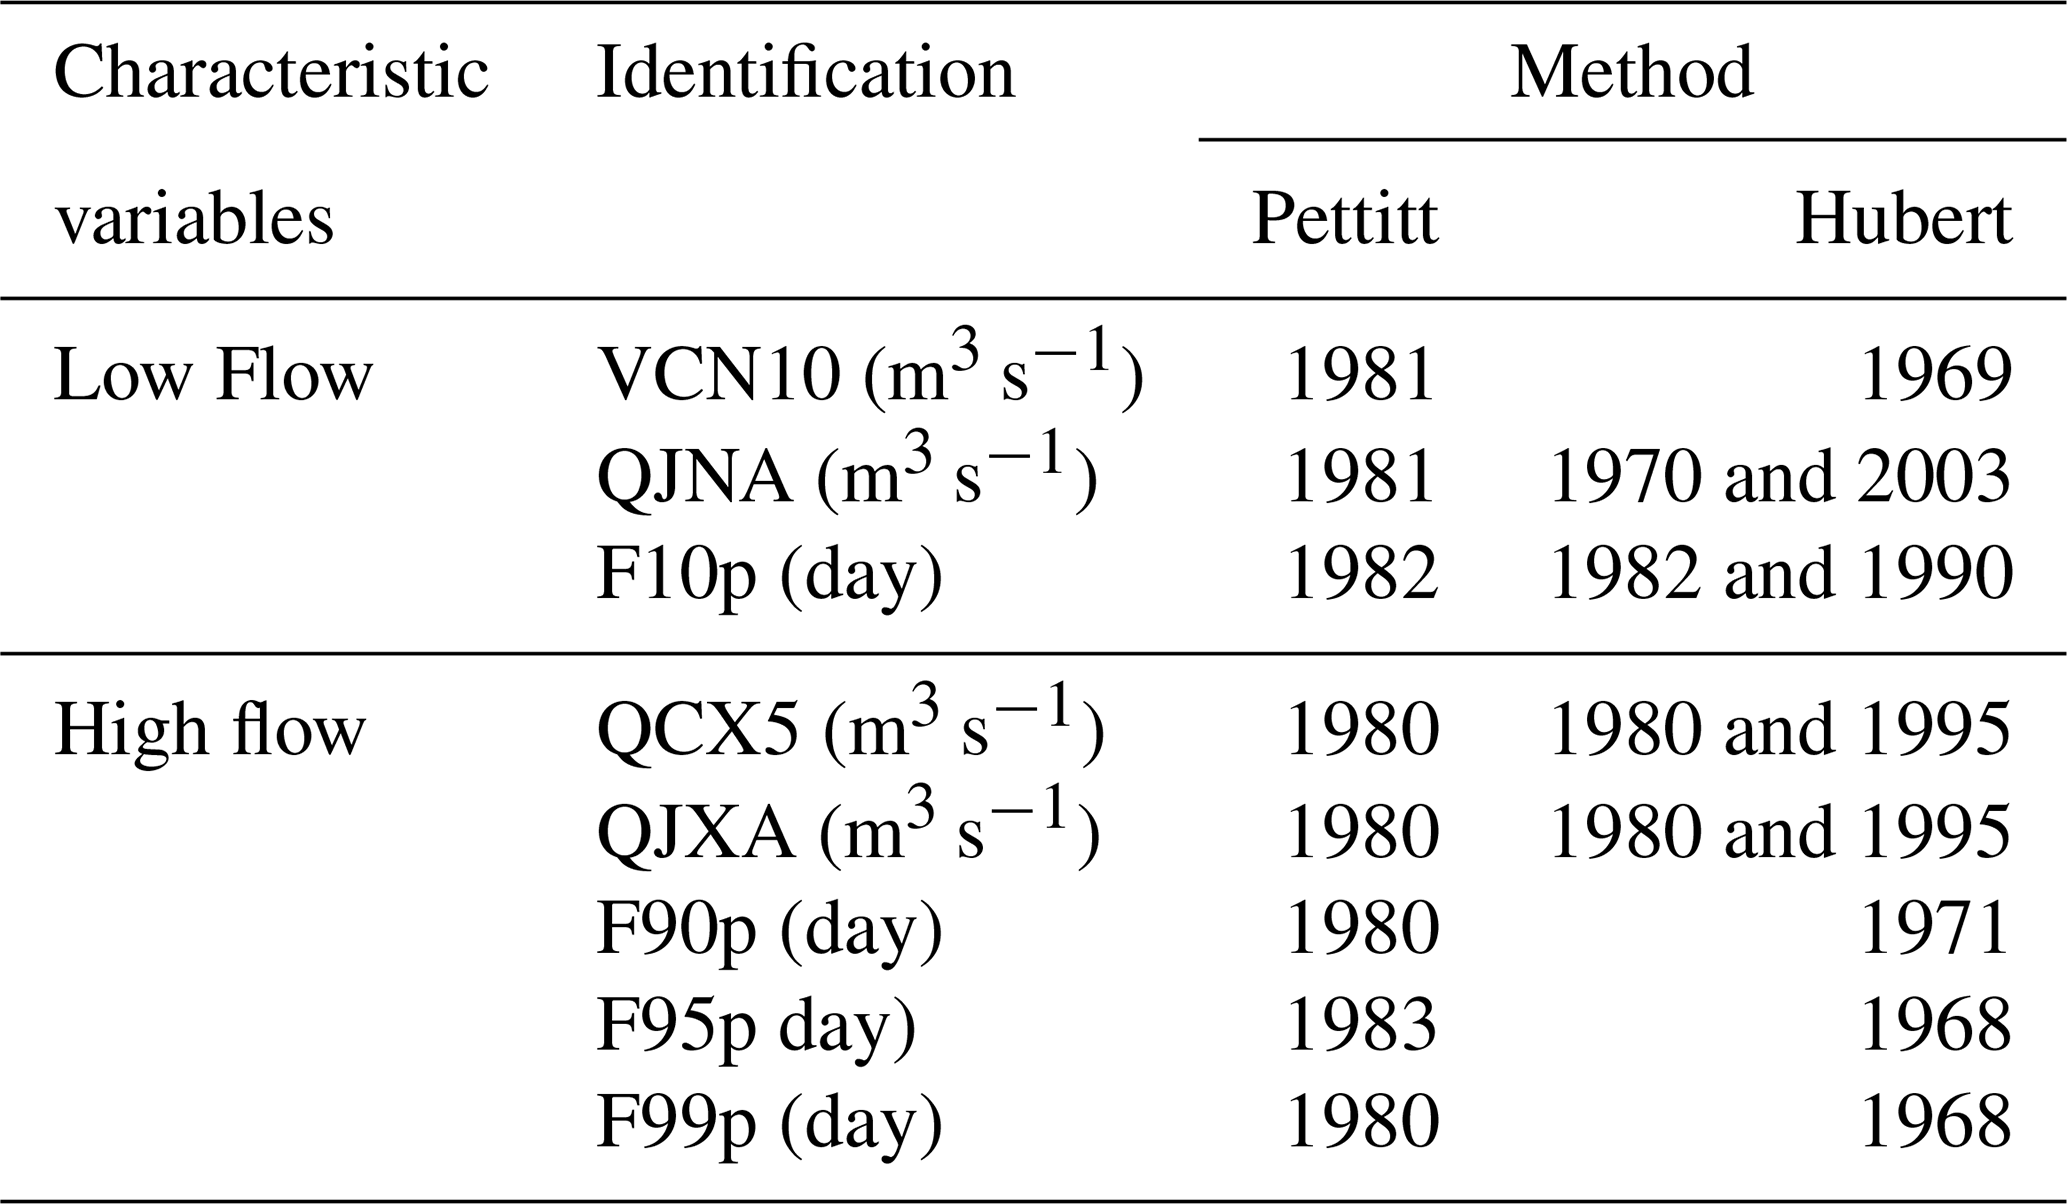
Low-flow variables stationary analysis (Table 5) shows that the hypothesis of a rupture is accepted by the Pettitt test in 1981 for the variables (QJNA and VCN10) and in 1982 for the variable F10p.
In this last variable and the QJNA variable record each a double rupture respectively in 1982 and 1990 then in 1970 and 2003 according to the Hubert test. In the high flow variables, the hypothesis of no rupture is rejected by the Pettitt test in 1980 with four (4) variables (QCX5, QJXA, F90p and F99p) and then in 1983 in the variable F95p. Similarly, Hubert's test accepts the hypothesis of a double rupture (1980 and 1995) in the variables QCX5 and QJXA.
The maximum (QJXA) and minimum (QJNA) annual flows are very often used to describe, respectively, floods and low flows. The integration of the duration notion in the choice of the extreme flow characteristic quantities shows that at the Bianouan hydrometric station on the Bia watershed, the flood can also be described by the QCX5 flow. That is to say, on a moving average 5 consecutive days, the maximum flow for each year higher than 68.9 m3 s−1. This value represents the value exceeding 85 % or not exceeded by 15 % of the values of the classed flows curve. These results corroborate the findings already reached on the choice of variables to characterize floods. Indeed, previous studies (Lemaître, 2002; Renard, 2006) have shown that the notion of flood is linked to a threshold but not to a maximum value of the each year. Even Better, the CEMAGREF for the QdF model implementation (flow-duration – frequency) recommends the use of characteristic variable of flood related to the notion of flow higher than a threshold. Therefore, the one-year maximum (VCXd) values used in this study do not appear to be representative of floods because the maximum value of a year is not necessarily a flood (Lemaître, 2002). It is rather the variable above a threshold over a given period that better characterizes the floods. Thus, the period of 5 consecutive days also called “pentad” or amplitude of the rainy season, seems the interesting period to characterize the floods. This period is also the minimum period to describe the succession of wet periods. It is therefore a good indicator of the agrometeorological value of the rainy season (Ozer et al., 2009).
In addition, low flows can be described with variable VCN10, which is defined as the annual minimum of flows calculated on a moving average of 10 d. This variable is coherent with that determined by Renard (2006) in northern France. Similarly, VCN10 is the regulatory value in many countries, including the United States (Kroll and Vogel, 2002). Also, VN10 is recommended for low-flow characterization (WMO, 2008). However, the low-flow variables relating to a threshold on a moving average of d days seem not be representative of low water levels. This means that the notion of low flow on the Bia watershed from 1962 to 2005 is linked to a minimum value but not to a threshold. This notion of a minimum value appears even in the definition of low flow. Laborde (1984) defines low water as VCN10 variables. Moreover, according to Lang (2011), the definition of low flow must take into account the criterion of duration that this factor is determining in the characterization of the impacts of the phenomenon. On the Bia watershed, a complete description of the low-water phenomenon must therefore be apprehended in terms of minimum flow over a moving average of 10 consecutive days. This 10 d duration is used in the prediction of low-flow flows as part of the PRESAGES study (Lang and Gilles, 2006). Also, the consecutive period of 10 d, also called decade, is involved in the calculation of most climatic indices used in agronomy (Sarr et al., 2012).
The stationarity analysis records late ruptures both in low-flow variables (1981–1982) and floods (1980–1983). These observations are different from those observed in most studies conducted in the West African context (Ouédraogo et al., 2002; Mahé, 2006). This difference could be justified by the fact that the studies that led to these previous results focused on flow modules while the present studies were conducted on the Bia watershed using the variables characterizing floods and low flows. Thus, the use of these variables would provide additional information regarding the variability of flows in the Bia basin. Indeed, the ruptures observed between the end of the 1960s and the beginning of the 1970s affected the extremes flow rate (low water and floods) after 1980. These rupture dates are conform with those observed on the extreme rain by Kouassi et al. (2018) thus confirming that there could exist a link between extreme rains and extreme flows.
Various variables are used to characterize floods and low flows. The integration of the duration and threshold notion in the choice of flood and low flow variables in this study has shown that in the Bia watershed, the notion of flood is linked to a threshold (the flow rate exceeding 85 % of the values of the classed flows curve) over an observation period of 5 consecutive days. However, the low flow notion is linked to a minimum value observed over a period of 10 d. The variables thus chosen were grouped into variables of low flow (VCN10, QNJA and F10p) and flood (QCX5, QXJA, F90p, F95p and F99p). These variables' variability analysis shows that the trend of 0.5 % per decade which is mostly negative, has been very significant for the flood variables and significant for the low flow variables. In addition, the stationarity analysis reveals late ruptures in the flood and low flow variables. These results show that the ruptures observed around the 1970s in the flow and rainfall modules affected the hydrometric extreme variables around the 1980s.
The flow data used in this study were provided by Ivory Coast Human Hydraulics Sub-directorate. These data are not accessible to the general public as they are subject to a fee.
The KKM conceived the idea for this article and wrote the first draft. YKB, KKL, BJ and SN provided comments and suggestions for quality improvements.
The authors declare that they have no conflict of interest.
This article is part of the special issue “Hydrological processes and water security in a changing world”. It is a result of the 8th Global FRIEND-Water Conference: Hydrological Processes and Water Security in a Changing World, Beijing, China, 6–9 November 2018.
CIE: Compagnie Ivoirienne d'Electricité, Rapport annuel d'activités, résultats financiers développement durable, 1–34, 2010.
Galéa, G. and Javelle, P.: Modèles débit durée fréquence de crue en Guadeloupe, Rapport d'étude, protocole cemagref-Lyon DIREN Guadeloupe et météo – France, cemagref, Lyon, 1–25, 2000.
Goubanova, K.: Une étude des événements climatiques extrêmes sur l'Europe et le bassin Méditerranéen et de leur évolution future, Thèse de doctorat ès science, Université Paris VI (France), 1–121, 2007.
Karimou, B. M., Ambouta, K., Sarr, B., and Tychon, B.: Analyse des phénomènes climatiques extrêmes dans le sud-est du Niger. XXVIIIe Colloque de l'Association Internationale de Climatologie, 1–6, 2015.
Kouassi, K. M., Kouassi, K. L., Yao, K. B., Meledje, N. H., Biemi, J., Lasm T., and Nathalie, R.: Variabilité des extrêmes pluviométriques sur le bassin versant de la rivière Bia (Sud-Est, Cote d'Ivoire), Eur. Sci. J., 14, 1857–7881, 2018.
Kroll, C. N. and Vogel, R. M.: Probability Distribution of Low Series in the United States, J. Hydrol. Eng., 7, 137–146, 2002.
Laborde, J. P.: Analyse des données et cartographie automatique en hydrologie, Éléments d'hydrologie Lorraine, Thèse d'État, I.N.P.L, 1–484, 1984.
Lang, C. D.: Sévérité des étiages et indigence des précipitations: une relation évidente mais rarement simple – Exemple en régime pluvial océanique, Revue Géographique de l'Est, 54, 3–4, 2011.
Lang, C. and Gilles, E.: Une méthode d'analyse du tarissement des cours d'eau pour la prévision des débits d'étiage, Norois, 201, 31–43, 2006.
Lemaître, F.: Recensement des tests de détection de tendances ou de ruptures l'analyse de stationnarité des régimes de crues en France, Rapport de fin d'études, Entpe, Cemagref-Lyon (France), 1–94, 2002.
Lubes, H., Masson, J. M., Servat, E., Paturel, J. E., Kouamé, B., and Boyer, J. F.: Caractérisation de fluctuations dans une série chronologique par applications de tests statistiques, Etude bibliographique, Programme ICCARE, Rapport 3, ORSTOM, Montpellier, France, 1–21, 1994.
Mahé, G.: Variabilité pluie-débit en Afrique de l'Ouest et Centrale au 20ème siècle: changements hydroclimatiques, occupation du sol et modélisation hydrologique, Habilitation à Diriger des Recherches, Université des Sciences et Techniques Montpellier, 2, 1–160, 2006.
Meledje, N. H.: Modélisation de la dynamique hydrologique et du flux des sédiments dans le lac du barrage hydroélectrique d'Ayamé 1. Thèse unique de doctorat, Université Nangui Abrogoua, Côte d'Ivoire, 1–197, 2016.
Meledje, N. H., Kouassi, K. L., N'go, Y. N., and Savane, I.: Caractérisation des occurrences de sécheresse dans le bassin hydrologique de la Bia transfrontalier entre la Côte d'Ivoire et le Ghana: contribution des chaînes de Markov, CahAgric, 24, 186–197, https://doi.org/10.1684/agr.2015.0755, 2015.
OMM: Organisation météorologique Mondiale: Déclaration sur l'état du climat mondial, 1152, 1–24, 2014.
Ouédraogo, M., Paturel, J. E., Mahé, G., and Servat, E.: Conséquences des déficits pluviométriques observés depuis le début des années 1970 en Afrique de l'Ouest et Centrale : normes hydrologiques, gestion et planification des ressources en eau, IAHS Pub., 274, 149–156, 2002.
Ozer, P., Hountondji, Y. C., and Laminou, M. O.: Évolution des caractéristiques pluviométriques dans l'Est du Niger de 1940 à 2007, Geo-Eco-Trop, Revue de Géographie et d'Écologie Tropicale, 33, 11–30, 2009.
Pettitt, A. N.: A non-parametric approach to the change-point problem, Appl. Stat., 28, 126–135, 1979.
Reizer, C.: Aménagement piscicole du lac artificiel d'Ayamé, CTFT, 30, 1–108, 1967.
Renard, B.: Détection et prise en compte d'éventuels impacts du changement climatique sur les extrêmes hydrologiques en France, INP Grenoble, 1–364, 2006.
Sarr, B., Atta, S., and Kafando, L.: Revue des indices climatiques utilisés dans les systèmes d'assurances agricoles indicielles en Afrique, Sécheresse, 23, 255–260, 2012.
WMO: World Meteorological Organization (2008), Guidelines on analysis of extremes in a changing climate in support of informed decisions for adaptation, WCDMP-No. 72, Geneva, Switzerland, 1–52, 2008.