the Creative Commons Attribution 4.0 License.
the Creative Commons Attribution 4.0 License.
 | 16 Sep 2020
Trends in national and regional scale drought in New Zealand
Daniel G. Kingston
Eleanor J. Treadwell
Drought is a critical natural hazard in New Zealand, affecting both agricultural production and hydro-electric generation. However, the detection and characterisation of drought events are complicated by the range of different drought metrics available. Here, time-series variation in drought is investigated for New Zealand using two commonly used indices: the Standardized Precipitation Index (SPI) and the Standardized Precipitation Evapotranspiration Index (SPEI). Both the SPI and SPEI are calculated from WATCH Forcing ERA-Interim data (a bias-corrected version of ERA-Interim). Analyses are based on the proportion of New Zealand experiencing at least “moderate” drought (i.e. index values at the threshold of −1 or lower). There is no statistically significant difference in area in drought between the two indices averaged over the time series, and no national-scale trends in drought occurrence are identified. However, a statistically significant trend of divergence between the SPI and SPEI is present when examining drought at moderate spatial coverage (10 % and 20 % coverage based on SPEI), with the SPEI showing increasingly greater drought coverage. These typically become more apparent either as a major drought event is building or terminating. As such, the SPEI generally indicates an extended duration (rather than higher peak extent) of drought events. The spatial expression of the largest SPI-SPEI differences reveals “hotspots” in terms of both average and divergent trends in drought extent, results which are reflected in a regional drought analysis using a cluster analysis of the SPI and SPEI area in drought. In particular, SPEI drought coverage is greater in the South Island east coast and central/southwestern North Island regions. Conversely, SPI drought extent is greater in the eastern North Island. Overall, the differences and similarities in drought extent between the SPI and SPEI can be linked to the highly varied nature of New Zealand climate, with the instances of greater SPEI drought located in regions of driest and most continental climate.
- Article
(2012 KB) - Full-text XML
- BibTeX
- EndNote


The identification and characterisation of drought events is a challenging research topic. There are multiple ways to characterise drought occurrence, which leads to uncertainty in the exact magnitude of individual events and makes comparison across different studies, places and times both uncertain and complex. In turn, these difficulties defining the nature of a drought event lead to further challenges understanding the causes of drought initiation, severity, duration and cessation. Characterisation of drought events and subsequent analysis of the causes of drought is a particularly important research challenge given the multi-sectoral and economically costly impacts of this natural hazard (e.g. Van Lanen et al., 2016). In New Zealand, past drought events have had substantial impacts on generation of electricity from hydropower (the 1992 “electricity crisis”; Fitzharris, 1992), on the water supply of the largest city (Auckland in 1994), and on agricultural production – the 2012/2013 drought depressed GDP by 0.7 %–0.9 % (MPI, 2013).
Perhaps the first aspect of drought characterisation is its category: meteorological (a lack of precipitation), hydrological (a lack of river water or other surface water resource), or agricultural (a lack of soil moisture) (Wilhite, 2000; Tallaksen and Van Lanen, 2004; Mishra and Singh, 2010). Henceforth only meteorological drought will be the focus here – although (initially at least) the least severe in terms of absolute water shortage, meteorological drought often has the most widespread and complete data availability for drought characterisation. However even when only considering meteorological drought, multiple indices have been used to characterise drought – each with their own particular focus in terms of aspect of drought that is captured. For example, the Standardised Precipitation Index (SPI) has been used widely. By using standardised precipitation the index is easily comparable between areas of different precipitation climate, and the index is also multiscalar – i.e. it can be calculated at different timescales. The SPI has been subject to rigorous investigation and has previously been recommended by the World Meteorological Organization due to its simplicity and multiscalar nature (WMO, 2012). However, whilst the standardised and multiscalar nature of the SPI may provide a widely applicable and representative drought index, the SPI does not include representation of evaporation, thus omitting a potentially important contributor to meteorological drought. A more recent development in terms of drought characterisation is the Standardised Precipitation Evaporation Index (SPEI, Vicente-Serrano et al., 2010). As with the SPI, the SPEI is multi-scalar and readily comparable across climate zones, and by including standardised precipitation minus potential evaporation this index includes a representation of the meteorological water balance more equivalent to the PDSI. Notwithstanding uncertainties associated with the method used to calculate PET (e.g. Sheffield et al., 2012), the SPEI has become a valuable addition to the range of available meteorological drought indices.
The implications of including PET in any measure of drought is thought to be particularly important within the context of climate change, where under a more energetic climate system evaporation may play an increasing role in the water balance – and so drought occurrence – for many regions. As such, there is potential for increasing levels of divergence between drought indices that do and do not include PET. There is evidence that indicates such divergence is already occurring for European-scale drought (Stagge et al., 2017), but this possibility has not been widely explored (particularly outside Europe). Here, this topic is advanced through an investigation of national- and regional-scale time series variation in drought occurrence as measured by the SPI and SPEI in New Zealand. New Zealand represents a particularly interesting case study of the relative performance of these two indices, given that it encompasses a wide range of climatic zones, from subtropical to polar, alpine to lowland, maritime to continental, and on a national scale has experienced changes in mean annual temperature approximately similar to the global average (Reisinger et al., 2014).
2.1 Climate data
The gridded SPI and SPEI time series data were generated following the procedure described by Stagge et al. (2015). Both indices were generated using the Watch Forcing ERA-Interim data set (WFDEI) which was created by applying a bias-correction to the ERA-Interim reanalysis data at a spatial resolution of 0.5×0.5∘ latitude/longitude (Weedon et al., 2014). At this resolution, a total of 164 grid cells cover the three main islands of New Zealand (North, South and Stewart). The SPI and SPEI data were calculated for an accumulation period of six monthly time steps, that is SPI-6 and SPEI-6, over the 1979–2010 period. This follows previous (Europe-based) analysis, which indicated that this time step generally approximates best hydrological drought caused by both summer rainfall deficits and winter snow-based drought (Van Loon and Van Lanen, 2012), drought types which are important across New Zealand.
2.2 Drought identification
The lack of quantifiable characteristics and non-structural nature of drought (Spinoni et al., 2017; Mishra and Singh, 2010) makes the agreement of a universally accepted definition impractical (Wilhite, 2000). In order to establish a water balance deficit, pre-defined standard thresholds from McKee et al. (1993) were used to identify drought events, beginning when the index falls below 0. Different threshold levels of SPI and SPEI values were analysed, with −1 (a “moderate drought”, according to McKee et al., 1993) determined as the most appropriate threshold in terms of maximizing the sample of drought events available for analysis whilst restricting the sample to covering only the more substantial events.
In order to identify national-scale drought events for the SPI and SPEI, binary occurrence was used for the presence/absence of drought within each cell using the −1 threshold level. The total number of cells (max. 164) with the SPI(t) or SPEI (t=1, 384 months) was used as the basis for a national time series of area in drought at time t. This time series was the focus of all subsequent analysis.
2.3 Spatial variation in drought occurrence
In addition to the national-scale analysis, regions of similar SPI and SPEI time series variation were identified, and drought occurrence was subsequently analysed on a region-by-region basis. Regional analysis can be particularly insightful in New Zealand due to the latitudinal range of the country combined with diverse orography, resulting in strong regional variation in both temperature and precipitation (e.g. Salinger and Mullan, 1999). Hierarchical cluster analysis using the Ward's clustering algorithm was used to establish regions of similar time series variation. The final clustering solution was determined following analysis of the clustering dendrogram, scree plots of the clustering agglomeration coefficient, as well as the physical interpretability of the spatial distribution of the regions. Once identified, the −1 SPI and SPEI threshold was applied to each grid cell in each cluster to generate an area in drought time series for each cluster which then formed the basis for subsequent analysis.
3.1 National area in drought
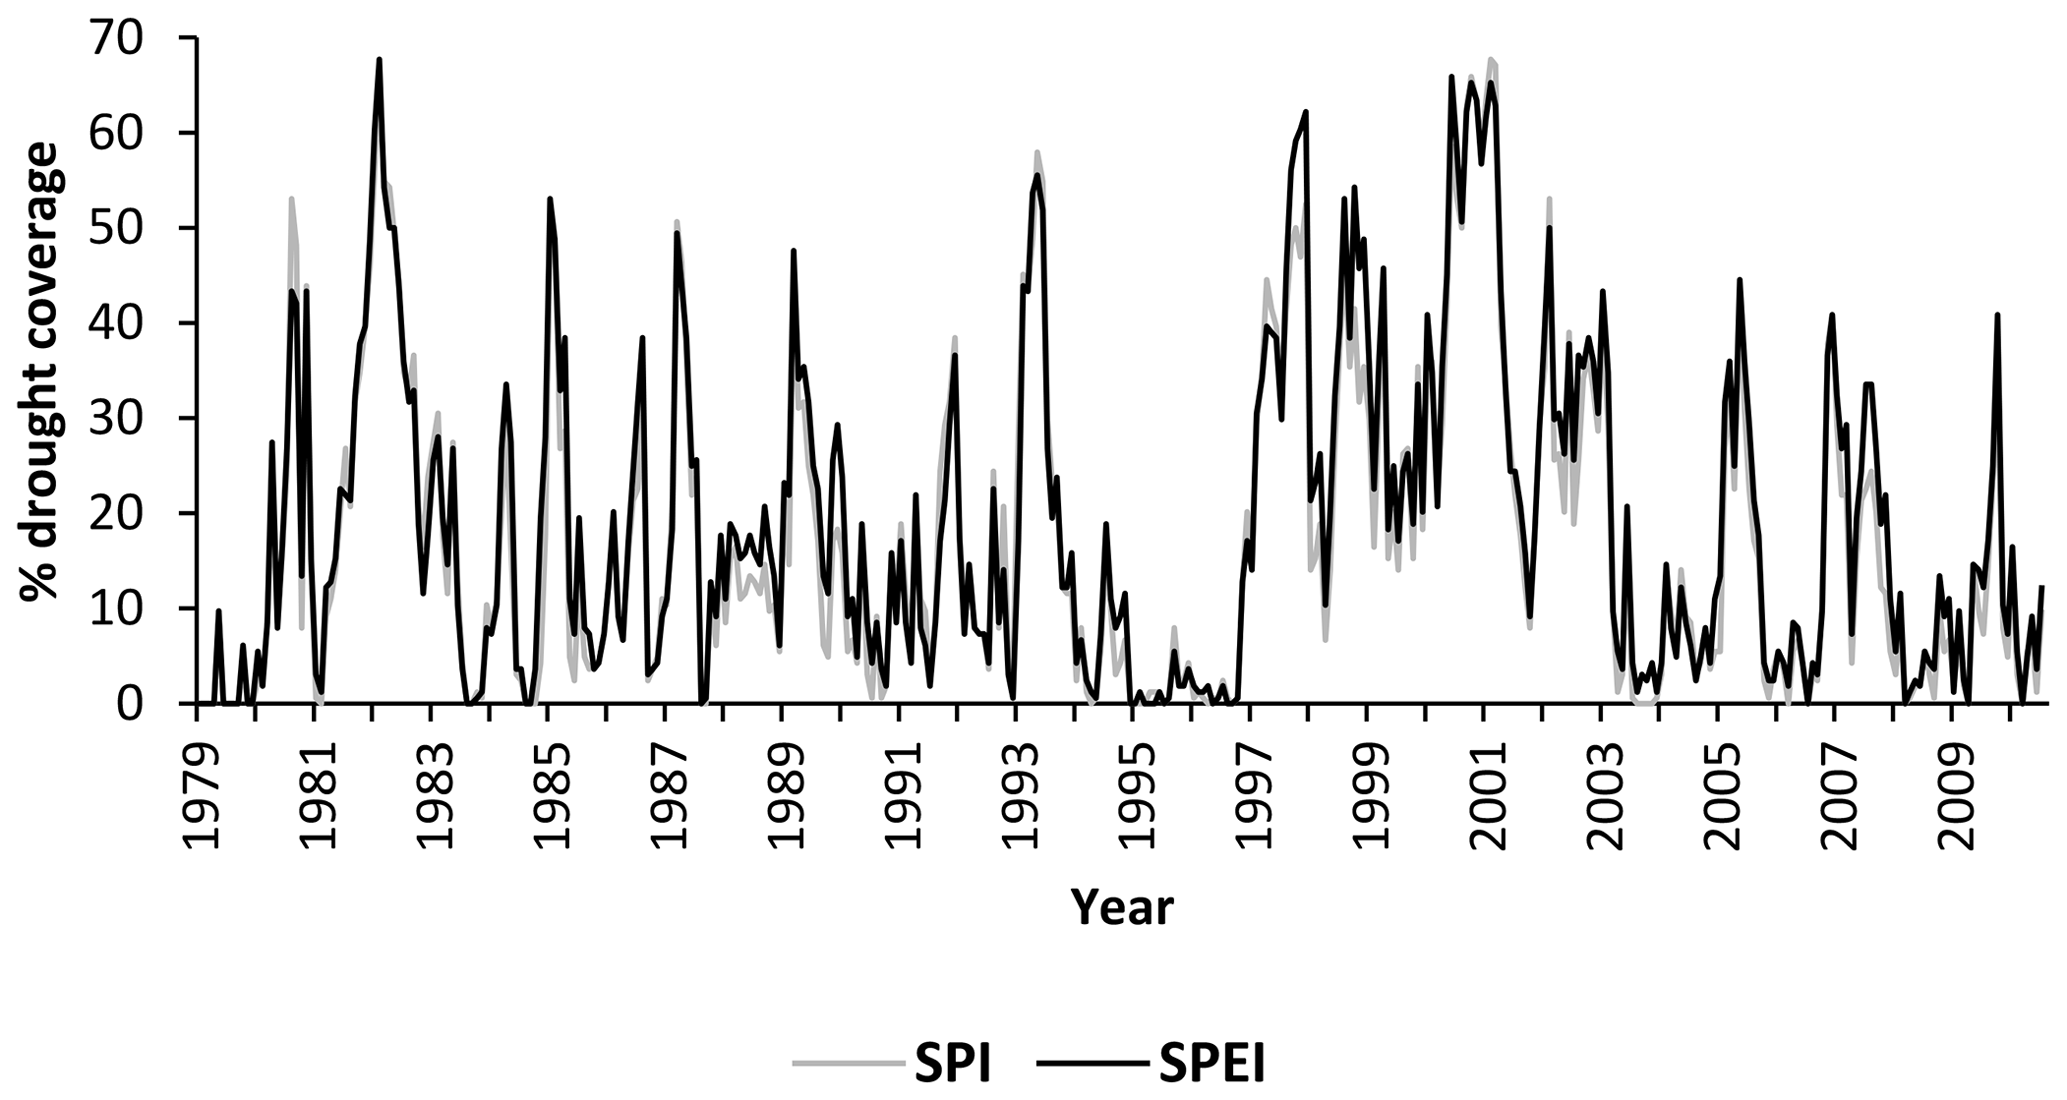
There is strong year-to-year variation in the spatial extent of drought conditions (ranging 0 % to 68 % coverage), with a relatively drought-free period between 1994–1996 followed by a longer period of enhanced drought extent (Fig. 1). There is no statistically significant (i.e. p≤0.05) trend in percentage area in drought for either the SPI or SPEI based on the Mann-Kendall test. Neither is there a statistically significant difference in the average area in drought between the indices over the whole 1979–2010 time series (Mann-Whitney test). However, when considering droughts of differing minimum spatial coverage, more substantial differences occur: for times with at least 10 % and 20 % of New Zealand in drought according to the SPEI, the median SPEI area in drought is significantly higher than the equivalent SPI coverage (by 3.7 % and 2.4 % respectively). There are no significant differences between indices for area in drought with a minimum coverage of 30 %, 40 % or 50 % of New Zealand.
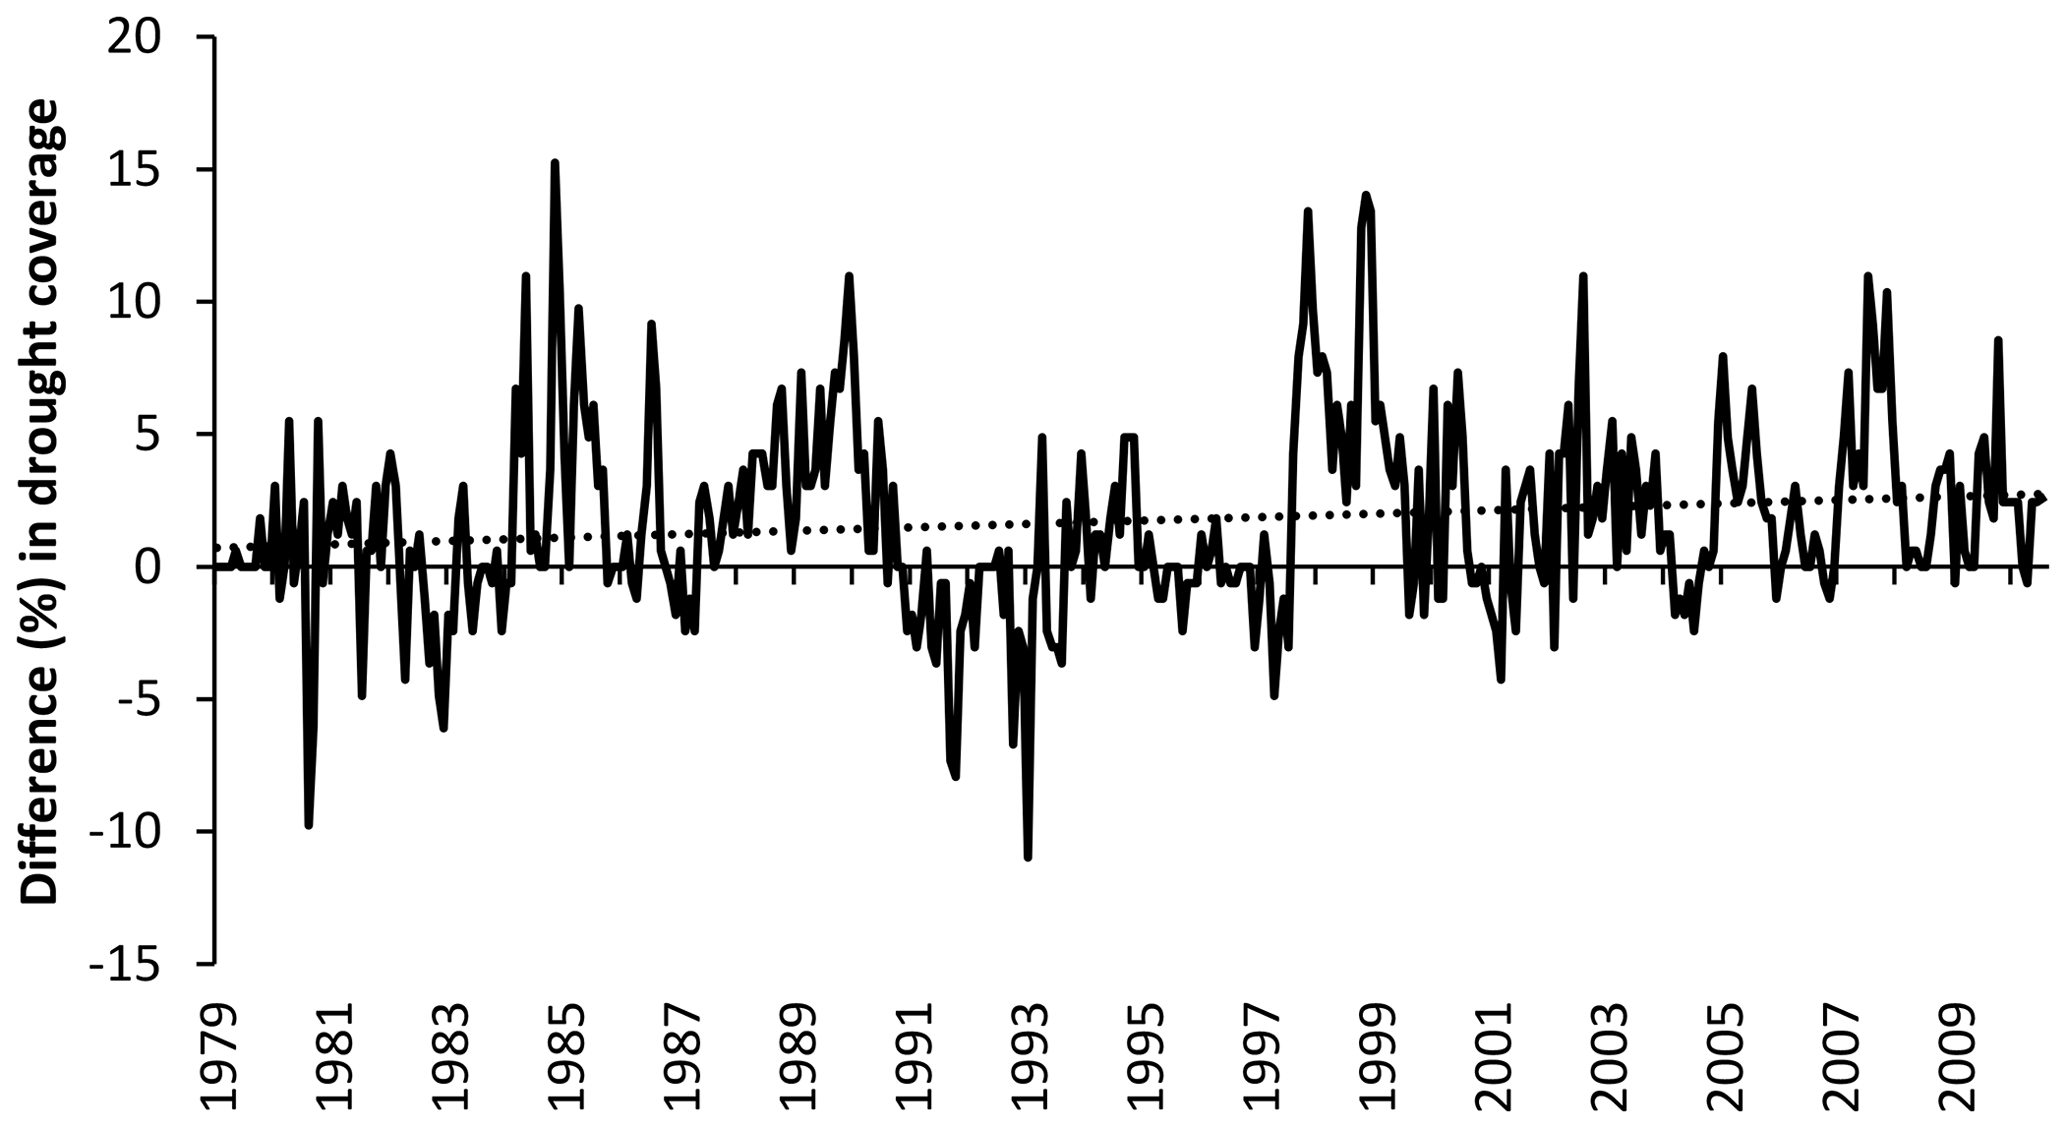
Figure 2SPEI-SPI difference in percentage area in drought. The dashed line indicates the linear trend fitted to the time series.
In addition to trends in droughts of different minimum coverage, there is a trend of increasing divergence between the entire SPEI and SPI drought area time series (Fig. 2), although the average over entire time series is not significantly different. The SPEI − SPI difference in percentage drought area increases over time, a trend that is statistically significant at p<0.01. Equivalent trends in divergence are also evident for droughts with at least 10 %, 20 % and 30 % coverage (but not >40 % or 50 % coverage). The average difference of area in drought between indices also approximately doubles between the first and second halves of the data set (a difference of 1.10 % for the first 15 full years, 2.34 % for the second 15 years). Furthermore, there is a reduction in the magnitude of events where SPI drought area is greater than SPEI area. For example, there are seven months where SPI drought covers >5 % more of New Zealand than the SPEI in the first half of the time series, and none in the second half (Fig. 2).
In addition to the increasing divergence over the study period, there are a series of relatively large event-specific differences. The greatest difference between indices occurred during the 1985–1986 drought event, and specifically during the development rather than at the peak of this event. The SPEI event began one month earlier than for the SPI, leading to a 15 % difference in national area in drought by the second (first) month of the SPEI (SPI) drought event. There are ten further instances of >10 % difference in drought coverage: these are most commonly associated with either SPEI events beginning earlier or retreating more slowly than SPI events. In addition, there are two instances where the peak coverage of the drought event is substantially greater for the SPEI.
There is a relatively consistent spatial pattern of differences between occurrence and magnitude of drought across all eleven drought events where SPEI coverage is more than 10 % greater than for the SPI. Specifically, the east coast of the South Island is generally drier according to the SPEI, as is the central-southern North Island, whereas drought in the far south and the central West Coast are typically less severe for the SPEI compared to SPI (Fig. 3). This pattern is highly consistent across all eleven of these high-difference events.
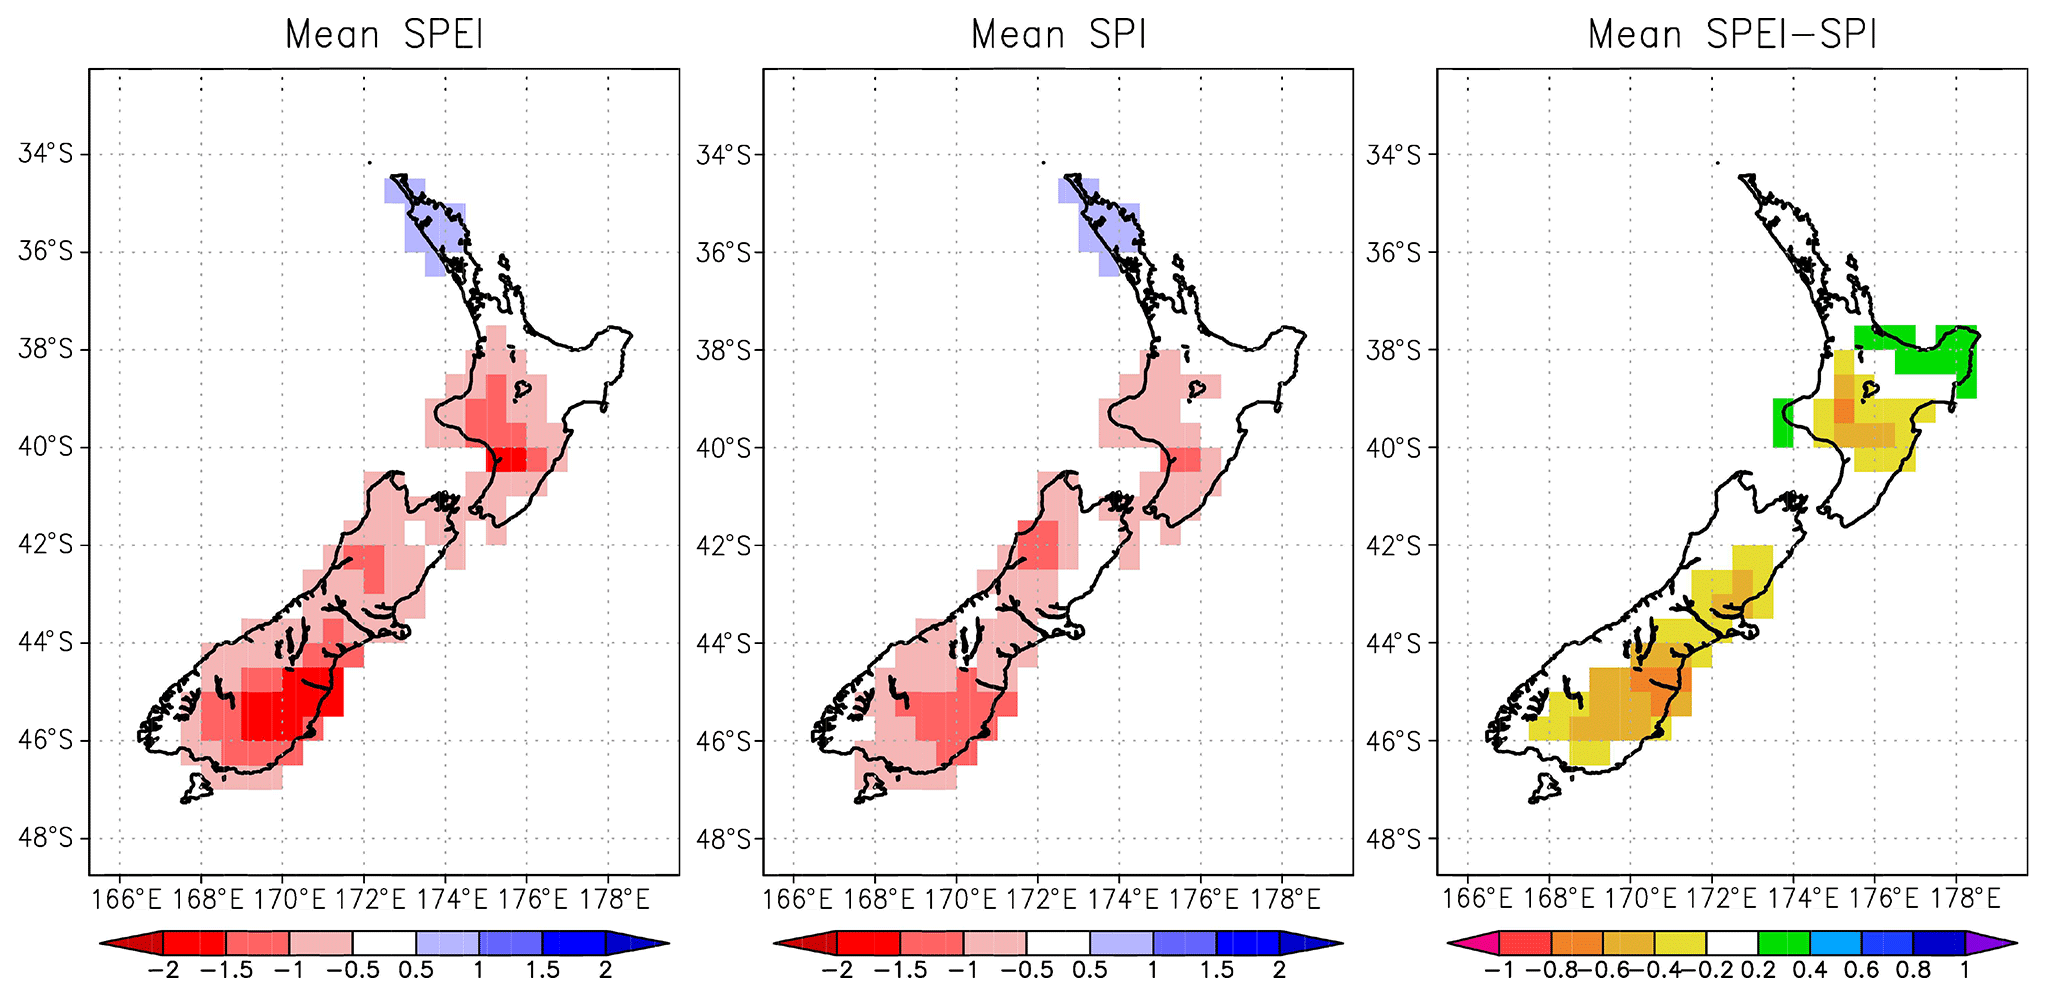
Figure 3Mean SPEI, SPI and SPEI-SPI difference over drought events where the SPEI area in drought is more than 10 % greater than for the SPI.
3.2 Regional variation
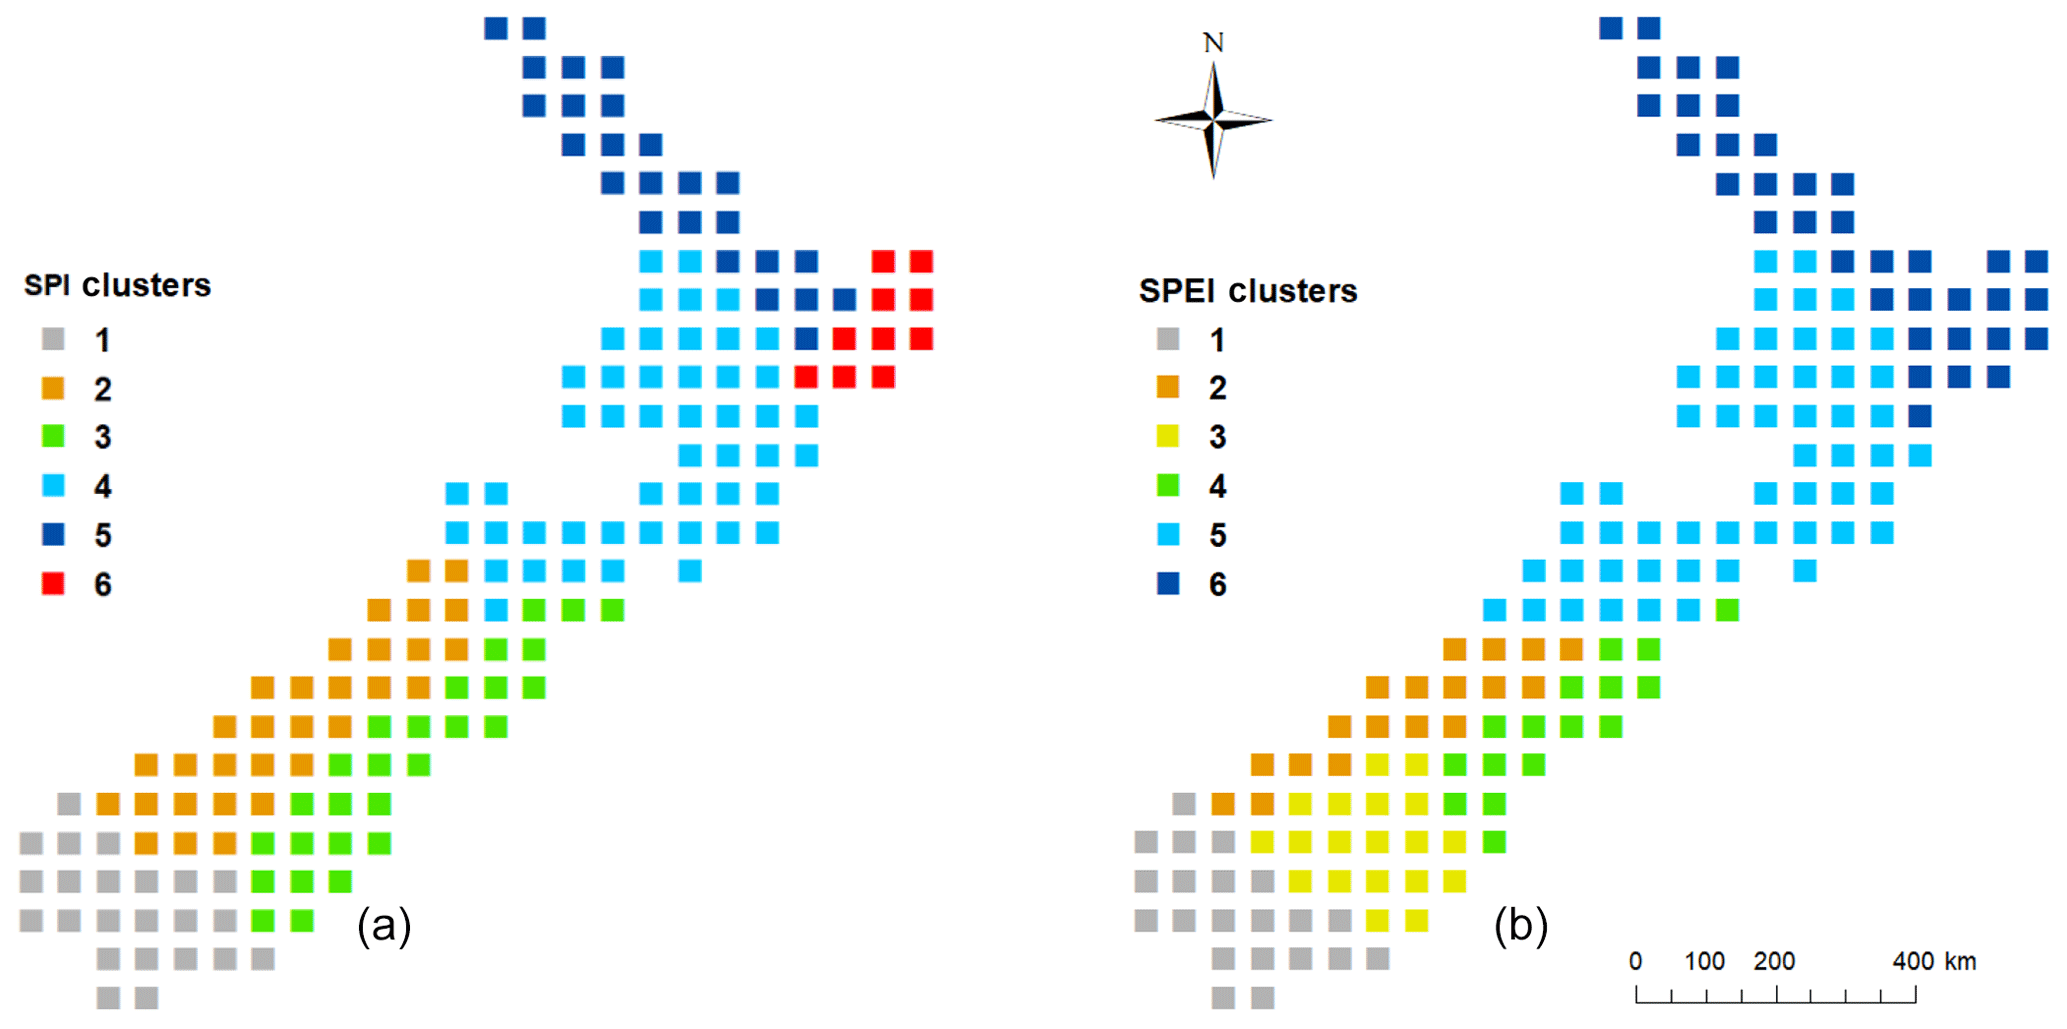
Analysis of clustering dendrograms, agglomeration coefficients and spatial expression led to the identification of six clusters for both the SPI and SPEI datasets (Fig. 4). Although both indices result in the same number of clusters, there are some differences in spatial expression. There are three particular differences of note. Firstly, the East Cape area of the North Island comprises a separate cluster (Cluster 6, C6) for the SPI, whereas for the SPEI C6 extends from this eastern region to the far north of the island. Secondly, the South Island West Coast cluster extends further inland for the SPI compared to the SPEI (C2), indicating a split at the Main Divide of the Southern Alps for the SPEI, but also including the downwind precipitation “spillover” zone under the SPI. Finally, the South Island East Coast is split between a northern and southern half for the SPEI (C3 and C4), but is a single cluster in the SPI classification (C3).
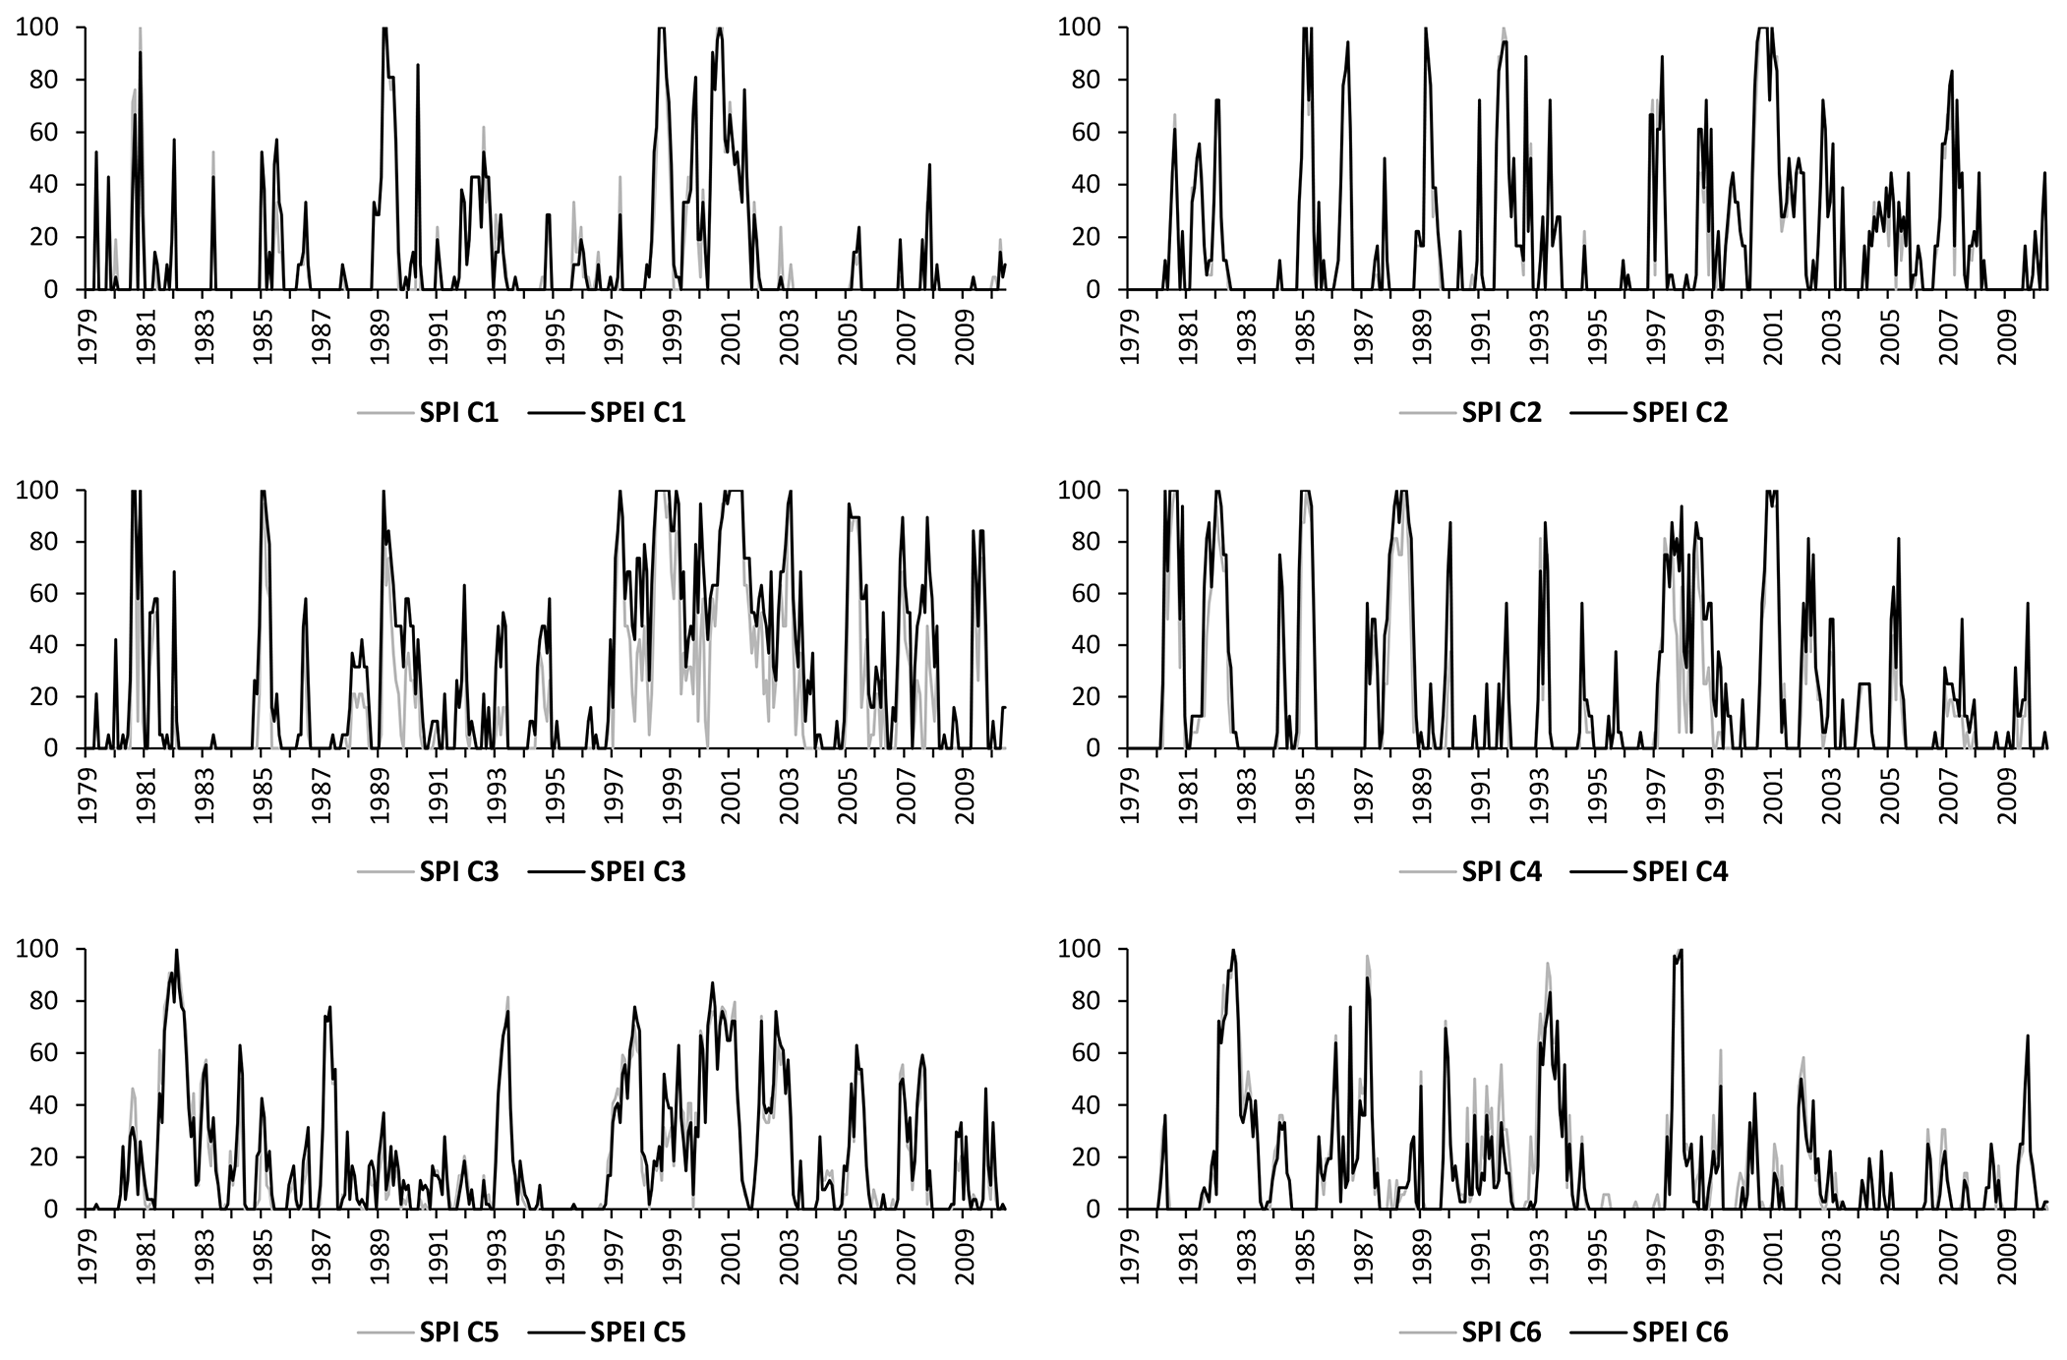
Figure 5Drought extent for SPEI cluster spatial groupings according to both SPEI and SPI data.
Each cluster shows some evidence of drought rich and drought poor periods (Fig. 5), ranging from 43 consecutive drought free months (SPI C6: August 2003 to February 2007) to 85 consecutive months with at least part of SPEI C3 in drought (May 1997 to May 2004), with an average of 66 % of this region in drought over this period, including 16 months at 100 % coverage. This drought-rich period for SPEI C3 corresponds to the drought-rich period identified at the national scale, and to a lesser extent is also present in all clusters except for the far north of the North Island (SPEI C6, SPI C5 and C6). Notwithstanding these differences in time series variation, there is very limited evidence of time series trends, with only SPEI C3 displaying a statistically significant rising trend, and SPEI C6, SPI C5 and 6 displaying weak but significant downward trends. Some clusters show a greater propensity for regionally extensive drought than others, with SPEI C5 and SPI C4 (both lower North/upper South Islands) each only showing one single month 100 % drought coverage event, compared to SPEI C3, which has a total of 22 months at 100 % drought coverage. Average area in drought across the study period also varies substantially between clusters, ranging from 12.5 %–30.4 % for the SPEI C1 and C4, and 12.4 %–19.1 % for SPI C1 and C4.
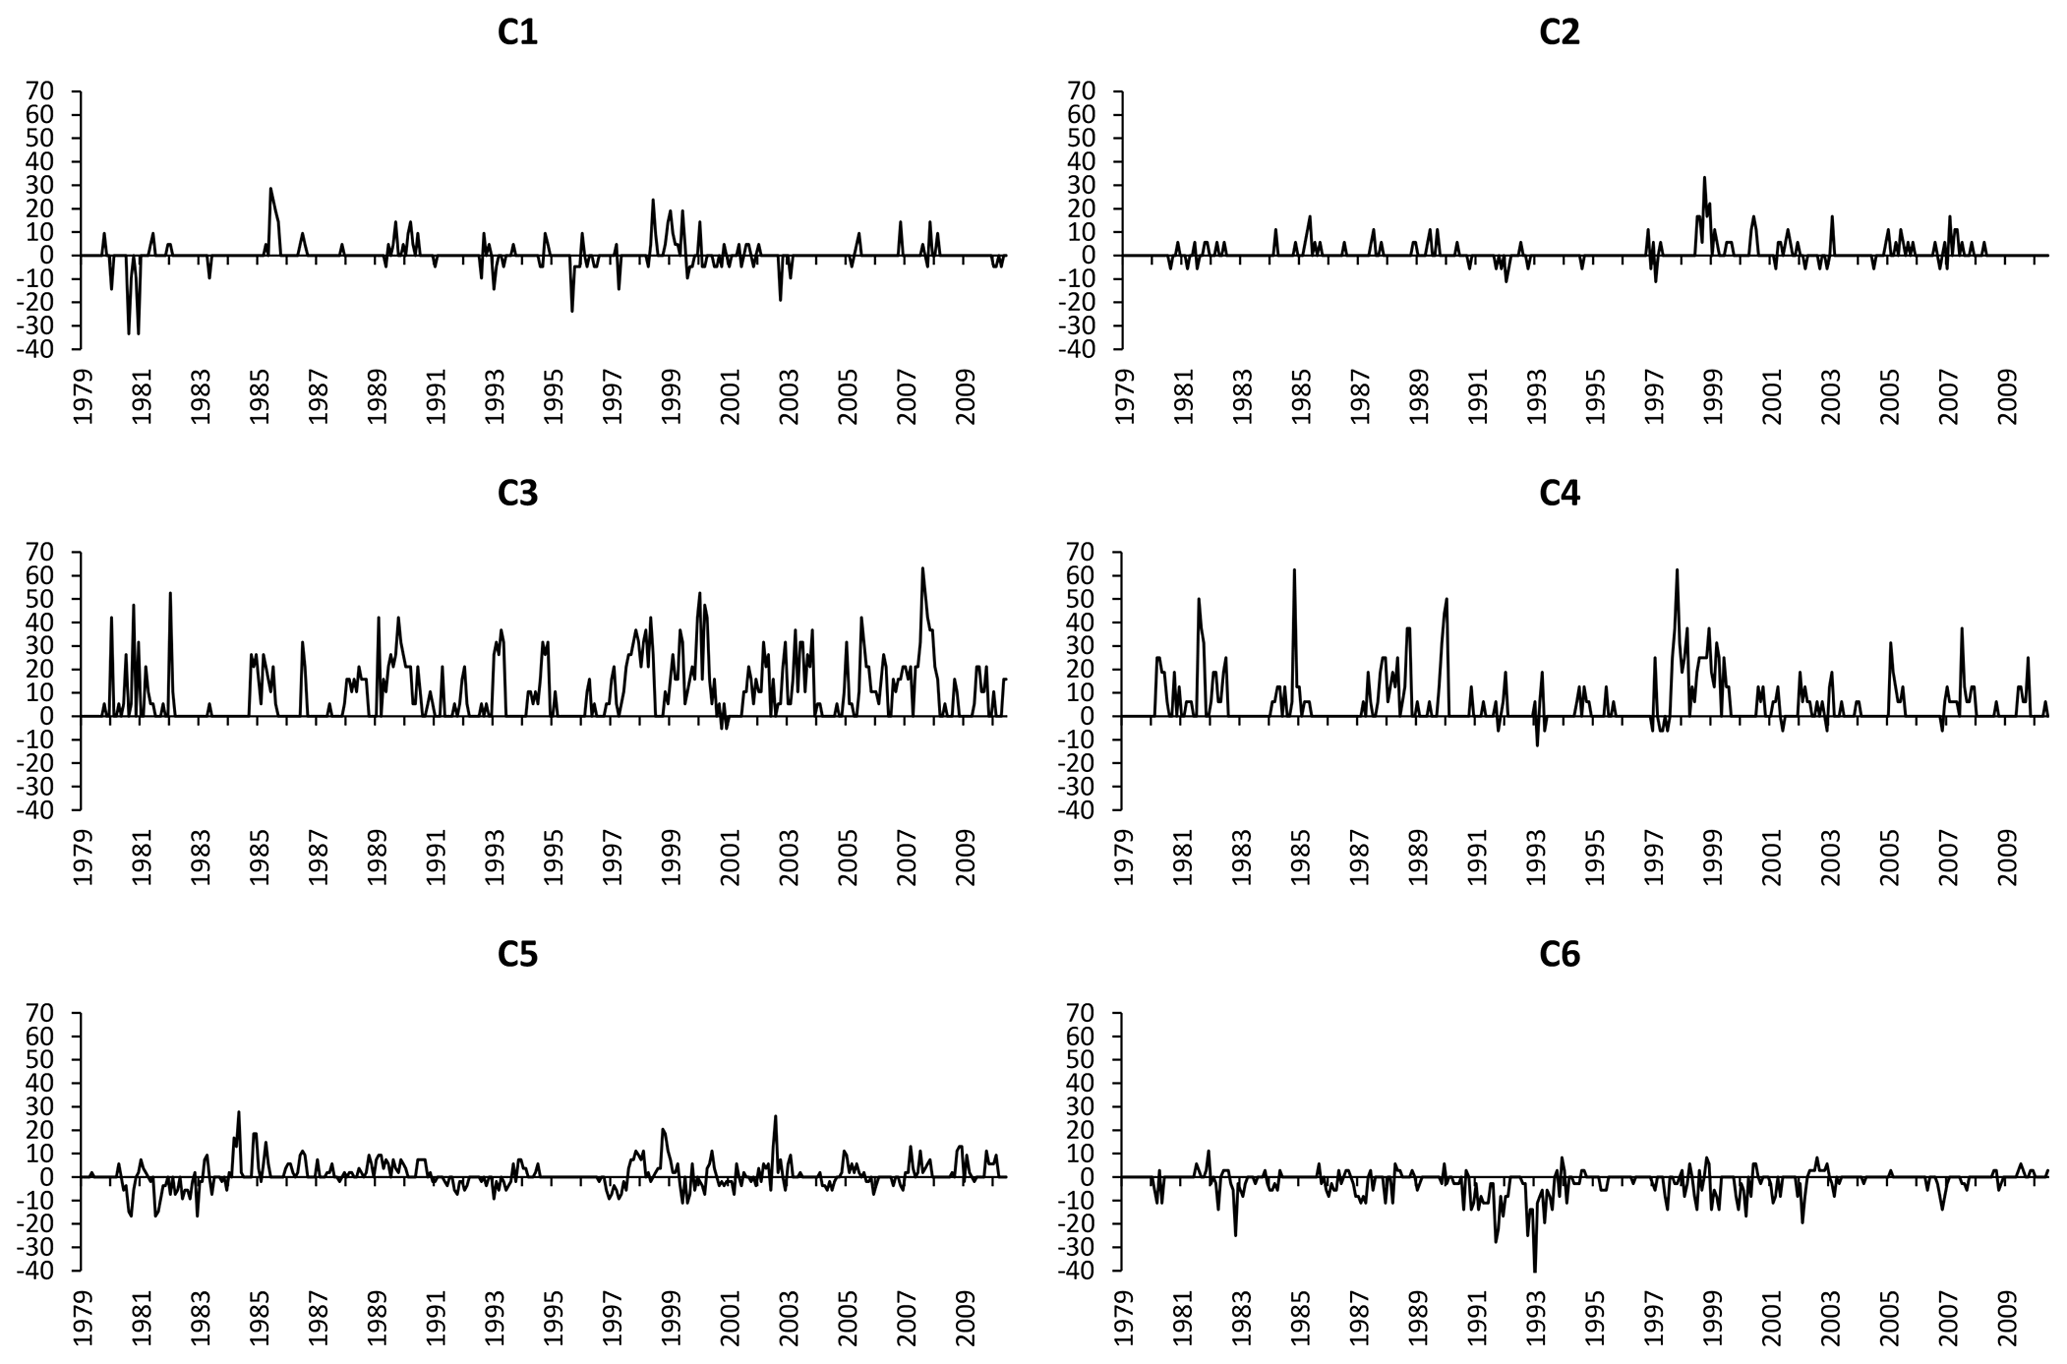
Figure 6Difference in drought extent for SPEI cluster spatial groupings (Fig. 4b) between SPEI and SPI data.
Overall, clusters with similar spatial expression between SPI and SPEI have very similar time series variation (i.e. the South Island southern and west coast clusters (C1 and C2 for both SPEI and SPI), and the upper South/lower North Cluster (SPEI C5 and SPI C4). Given the different spatial expression of drought regions in the east of the South Island and north of the North Island, it is instructive to calculate area in drought within the spatial extent of each of SPEI C3, C4 and C6 according to both the SPI and SPEI, and vice versa. Accordingly, it is possible to directly compare the frequency and extent of regional drought occurrence between the SPEI and SPI indices (Fig. 6). Use of the SPEI results in greater drought extent in the area of SPEI C1–5. Differences are relatively small for C1 (southern South Island), C2 (South Island west coast) and C5 (upper South Island to lower and mid North Island). Much larger differences are present in the two South Island east coast clusters, and particularly for the more southerly C3, where on average an additional 10 % of the region is in drought for the SPEI vs. SPI, and a peak event-based difference of 63 %. This is followed by the more northern South Island east coast cluster, where the mean drought coverage is 5.5 % higher for the SPI, with a peak event-based difference of 62.5 %. The difference is still large when the east coast is combined into a single cluster (as under the SPI-based classification). In this case of the SPI C3 extent, there is a mean of 7.5 % additional drought coverage according to the SPEI vs. SPI. In contrast to C1–C5, for SPEI C6 the SPEI indicates a slightly lower area in drought compared to the SPI. Reversing the calculation to consider SPEI drought coverage within the two northern SPI clusters, the SPEI again results in a lower spatial extent of drought across both clusters, with this difference slightly greater for the (eastern) C6.
Just as there are weak or absent trends for area in drought at a national scale, there are mostly similarly weak trends for divergence between the two indices at the regional scale. The only exception to this is for the SPEI C3 region, where both indices show increasing drought, but the SPEI increase is greater than corresponding increase for SPI, resulting in a statistically significant divergence between the indices.
The proportion of New Zealand in drought (SPEI and SPI , “moderate drought”) is generally similar for both indices (Fig. 1). The two times series are highly correlated, and the mean difference across the time series is small (+1.72 %) and not statistically significant. Combined with the additional uncertainty that PET adds to a drought index (both from PET method and application in water limited situations), it is initially questionable whether the SPEI offers much net benefit as a drought index compared to the SPI. However, differences between the indices do become statistically significant once the times with very low and high drought coverage have been removed (i.e. coverage less than 10 % and greater than 30 %) indicates that use of the full meteorological water balance (i.e. precipitation and PET) is most important for identifying drought occurrence of intermediate national coverage. These findings are further emphasised by analysis of the eleven instances where the SPEI coverage is >10 % greater than for the SPI. With just two instances of higher peaks for the SPEI (where SPI drought coverage instead reaches a plateau: e.g. May 1998), the majority of instances occur at times of intermediate drought coverage, either where development of a SPEI event has started earlier compared to the SPI (e.g. May 1985), or where a SPI event has declined more rapidly than the SPEI (e.g. November 1984). As such, inclusion of the full meteorological water balance appears to have most impact for identifying both initial drought development and drought termination. In consequence, when the influence of PET is included, drought onset is typically earlier and drought termination more gradual. In contrast, inclusion of PET (on average) has a non-significant effect on the peak spatial extent of large drought events, indicating that PET is ultimately a second-order driver of national-scale drought event coverage in New Zealand – peak spatial extent of large droughts is driven primarily by rainfall deficit. This may reflect the precipitation-dominated climate in many areas (e.g. South Island west coast, where P is approximately four times higher than PET), together with the absence of marked seasonality in rainfall totals in some locations and importance of seasonal snow storage and melt in others. A focus on water deficits at shorter timescales than six months (i.e. more seasonally-confined, and closer to the typical timescale of meteorological drought) may also result in an increased influence of PET on the identification of water deficits.
In addition to the differences in spatial extent of moderate droughts averaged over the time series, these differences show statistically significant increases over the course of the time series. In this instance, it is only the most severe droughts (>40 % coverage) that do not show a statistically significant trend of divergence between SPI and SPEI coverage. So, whilst the spatial extent of the largest droughts may be driven primarily by rainfall, PET appears to be increasingly important as a cause of drought at moderate spatial extents. This corresponds to findings elsewhere, for example in southern Europe where increasing PET combined with decreasing precipitation has caused increasing meteorological water balance drought (Stagge et al., 2017; Spinoni et al., 2015, 2017).
The largest differences in drought coverage between the SPI and SPEI are focussed on central Otago, the central and southwestern North Island, and eastern parts of the North Island (Figs. 3 and 6). For the latter region use of the SPEI typically results in reduced drought compared to the SPI, with the reverse true for the former two regions. These differences are consistent with the results of the cluster analysis. Firstly, by different regional groupings: under the SPEI, separate regions are identified along the east coast of the South Island, but not for the SPI. Conversely, a single region is present from the north of the North Island across to the far east of the North Island for the SPEI, whereas this eastern area is part of a separate region with the SPI. Secondly, by differences between SPEI and SPI time series of drought for each region. Here, locations where precipitation or precipitation and PET dominate as drivers of drought become clear, and largely follow regional differences in spatial coverage of drought as identified in Fig. 3. Accordingly, the two South Island east coast SPEI regions (C4 and especially C3) record both greater drought than the SPI for this area and increasing divergence between the indices (Figs. 3 and 6). These relatively strong (and increasing) differences are likely linked to this being the region with the most continental climate in New Zealand – i.e. hot summers, cold winters, and low annual precipitation (<350 mm in places). Accordingly, this is an area where high PET rates occur, together with a substantial climatological water balance deficit, and also where precipitation deficits are most likely to be accompanied by high temperatures (and so PET). Again, these results bear comparison to Europe, where it is the hotter and drier regions (i.e. southern Europe) where drought has increased the most, and where divergence between the SPI-SPEI indices is strongest (Stagge et al., 2017).
The central and southwestern North Island is another prominent region where the SPEI often indicates more widespread drought compared to the SPI, but here there are negligible differences in cluster spatial expression. Furthermore, time series variation of the area in drought for this cluster (SPEI C5, SPI C4) is relatively similar between the two indices, especially compared to the South Island east coast clusters (Fig. 6). Closer analysis of differences between the C5/C4 time series reveals that, unlike for the South Island east coast clusters, the number of instances where SPEI drought is more widespread is relatively well balanced against events SPI drought is greater. So in some instances, inclusion of PET leads to greater extent of drought being identified, and in other instances in the inclusion of PET ameliorates drought extent for this region.
The different spatial expression of clusters in the eastern North Island reflects the apparent amelioration of drought coverage by the inclusion of PET, with relatively few and weak instances where SPEI coverage is greater than for the SPI. Instead, more frequent and wider coverage (up to 60 %) events occur for the SPI. The increased severity of SPI droughts indicates that precipitation deficits in this location occur at times of low PET.
At the national scale for New Zealand there are few overall differences in the area in drought whether or not standardised PET is included alongside precipitation in the drought metric. Closer examination reveals some differences in drought at moderate spatial extents (>10 % and <40 % of New Zealand land surface area), which typically occurs during drought development or termination, rather than peak drought extent. As such it appears that inclusion of the full meteorological water balance in the drought index is more important for the duration of drought events, rather than their peak spatial extent. The finding of regional hotspots of SPI − SPEI differences, and trends in such differences, reveals that New Zealand is subject to similar changes in the role of PET for drought occurrence as have been found elsewhere in the world – except that these are confined to particular parts of the highly spatially variable New Zealand climate. Overall, this variation in climate, the dominance of precipitation over PET in many parts, and the overall temperate maritime climate regime mean that PET remains more of a secondary driver of drought characteristics than has been found for many other locations.
James H. Stagge (University of Oslo – now University of Ohio) provided the SPI and SPEI data, using the data and methods described in Stagge et al. (2015).
DGK designed the analyses and EJT carried them out. DGK prepared the manuscript, with assistance from EJT.
The authors declare that they have no conflict of interest.
This article is part of the special issue “Hydrological processes and water security in a changing world”. It is a result of the 8th Global FRIEND–Water Conference: Hydrological Processes and Water Security in a Changing World, Beijing, China, 6–9 November 2018.
Fitzharris, B. B.: The 1992 electricity crisis and the role of climate and hydrology, New Zeal. Geogr., 48, 79–83, 1992.
McKee, T. B., Doesken, N. J., and Kleist, J.: The relationship of drought frequency and duration to time scales, Proceedings of the 8th Conference on Applied Climatology vol. 17, no. 22, American Meteorological Society, Boston, MA, USA, pp. 179–183, 1993.
Mishra, A. K. and Singh, V. P.: A review of drought concepts, J. Hydrol., 391, 202–216, 2010.
MPI: Four Degrees of Global Warming: Effects on the New Zealand Primary Sector, MPI Technical Information Paper No: 2013/49, prepared for the Ministry for Primary Industries, 180 pp., 2013.
Reisinger, A., Kitching, R. L., Chiew, F., Hughes, L., Newton, P. C. D., Schuster, S. S., Tait, A., and Whetton, P.: Australasia, in: Climate Change 2014: Impacts, Adaptation, and Vulnerability. Part B: Regional Aspects. Contribution of Working Group II to the Fifth Assessment Report of the Intergovernmental Panel on Climate Change, edited by: Barros, V. R., Field, C. B., Dokken, D. J., Mastrandrea, M. D., Mach, K. J., Bilir, T. E., Chatterjee, M., Ebi, K. L., Estrada, Y. O., Genova, R. C., Girma, B., Kissel, E. S., Levy, A. N., MacCracken, S., Mastrandrea, P. R., and White, L. L., Cambridge University Press, Cambridge, United Kingdom and New York, NY, USA, pp. 1371–1438, 2014.
Salinger, J. M. and Mullan, A. B.: New Zealand climate: temperature and precipitation variations and their links with atmospheric circulation, Int. J. Climatol., 19, 1049–1071, 1999.
Sheffield, J., Wood, E. F., and Roderick, M. L.:Little change in global drought over the past 60 years, Nature, 491, 435–438, 2012.
Spinoni, J., Naumann, G., Vogt, J., and Barbosa, P.: European drought climatologies and trends based on a multi-indicator approach, Glob. Planet. Chang., 127, 50–57, 2015.
Spinoni, J., Naumann, G., and Vogt, J.: Pan-European seasonal trends and recent changes of drought frequency and severity, Glob. Planet. Chang., 148, 113–130, 2017.
Stagge, J. H., Tallaksen, L. M., Gudmundsson, L., Van Loon, A. F., and Stahl, K.: Candidate distributions for climatological drought indices (SPI and SPEI), Int. J. Climatol. 35, 4027–4040, 2015.
Stagge, J. H., Kingston, D. G., Tallaksen, L. M., and Hannah, D. M.: Observed drought indices show increasing divergence across Europe, Sci. Rep.-UK, 7, 14045, https://doi.org/10.1038/s41598-017-14283-2, 2017.
Tallaksen, L. M. and Van Lanen, H. A. J. (Eds.): Hydrological Drought. Processes and Estimation Methods for Streamflow and Groundwater, Developments in Water Science, 48, Elsevier Science B.V., Amsterdam, 579 pp., 2004.
Van Lanen, H. A. J., Laaha, G., Kingston, D. G., Gauster, T., Ionita, M., Vidal, J.-P., Vlnas, R., Tallaksen, L. M., Stahl, K., Hannaford, J., Delus, C., Fendekova, M., Mediero, L., Prudhomme, C., Rets, E., Romanowicz, R. J., Gailliez, S., Wong, W. K., Adler, M.-J., Blauhut, V., Caillouet, L., Chelcea, S., Frolova, N., Gudmundsson, L., Hanel, M., Haslinger, K., Kireeva, M., Osuch, M., Sauquet, E., Stagge, J. H., and Van Loon, A. F.: Hydrology needed to manage droughts: the 2015 European case, Hydrol. Process., 30, 3097–3104, https://doi.org/10.1002/hyp.10838, 2016.
Van Loon, A. F. and Van Lanen, H. A. J.: A process-based typology of hydrological drought, Hydrol. Earth Syst. Sci., 16, 1915–1946, https://doi.org/10.5194/hess-16-1915-2012, 2012.
Vicente-Serrano, S. M., Beguería, S., and López-Moreno, J. I.: A multi-scalar drought index sensitive to global warming: the standardized precipitation evapotranspiration index – SPEI, J. Climate, 23, 1696–1718, 2010.
Weedon, G. P., Balsamo, G., Bellouin, N., Gomes, S., Best, M. J., and Viterbo, P.: The WFDEI meteorological forcing data set: WATCH Forcing Data methodology applied to ERA-Interim reanalysis data, Water Resour. Res., 50, 7505–7514, https://doi.org/10.1002/2014WR015638, 2014.
Wilhite, D.: Drought: A Global Assessment, Vol I & II, Routledge Hazards and Disasters Series, Routledge, London, UK, 2000.
WMO (World Meteorological Organisation): Standardized Precipitation Index – User Guide, WMO-No. 1090, Geneva, 2012.