the Creative Commons Attribution 4.0 License.
the Creative Commons Attribution 4.0 License.
 | 16 Sep 2020
The challenges of hydrological drought definition, quantification and communication: an interdisciplinary perspective
Kerstin Stahl
Jean-Philippe Vidal
Jamie Hannaford
Erik Tijdeman
Gregor Laaha
Tobias Gauster
Lena M. Tallaksen
Numerous indices exist for the description of hydrological drought. The EURO FRIEND-Water Low flow and Drought Group has repeatedly discussed changing paradigms in the perception and use of existing and emerging new indices for hydrological drought identification and characterization. Group members have also tested the communication of different indices to stakeholders in several national and international transdisciplinary research projects. This contribution presents the experience gained with regard to the purpose and applicability of different classes of drought indices. A recent paradigm shift is the use of anomalies, traditionally from climatology, in hydrology. For instance, anomaly-based indices, such as the Standardized Streamflow Index (SSI) and the variable threshold level method to define streamflow deficiencies, are used increasingly for real-time monitoring. How these indices relate to low flows and their impacts may have become less clear as a result. Assessments of the severity of a particular drought may also differ depending on whether return periods based on traditional low flow or drought frequency analyses or whether SSI time series index values are used. These experiences call for a systematic comparison, classification and evaluation of different low flow and drought indices and their usages.
- Article
(1139 KB) - Full-text XML
- BibTeX
- EndNote


Numerous indices exist for the definition and description of hydrological drought, which here refers primarily to streamflow drought. Hydrological drought indices have been developed and used for a number of purposes. These include, but are not limited to, planning of water resources/flow allocations, analysis of temporal trends and the influence of climate change, analysis of spatial patterns and regionalization of drought characteristics (estimation at the ungauged site), large-scale comparative monitoring (and forecasting) of river flows and drought conditions, and drought vulnerability and risk analysis. The purposes these indices serve therefore vary and may also have changed over time.
The EURO FRIEND-Water Low flow and Drought Group has repeatedly discussed changing paradigms and advantages and disadvantages of existing and emerging new indices for hydrological drought identification and characterization. Group members have also tested the communication of different types of drought indices to stakeholders in various national and international transdisciplinary research projects on drought risk management. The objective of this contribution is to review some of the experience gained with regard to the origin of well-known drought indices, their statistical basis and changing purposes and applications over time. The review is a collection of thoughts and not a complete overview. It aims to spawn further discussion and to provide a starting point for a more comprehensive classification of the multitude of indices and their recommended usage.
A comprehensive description of low flow and streamflow drought indices can be found e.g., in Tallaksen and van Lanen (2004) and WMO (2005). Hydrological drought indices are mostly based on time series of gauged or simulated streamflow (catchment scale) and occasionally groundwater levels; but also modelled runoff (grid cell scale) has been used. A wide range of approaches exists that allow to determine the occurrence, magnitude and frequency of a drought or extreme low flow event at a given site. There are many potential ways of classifying these approaches.
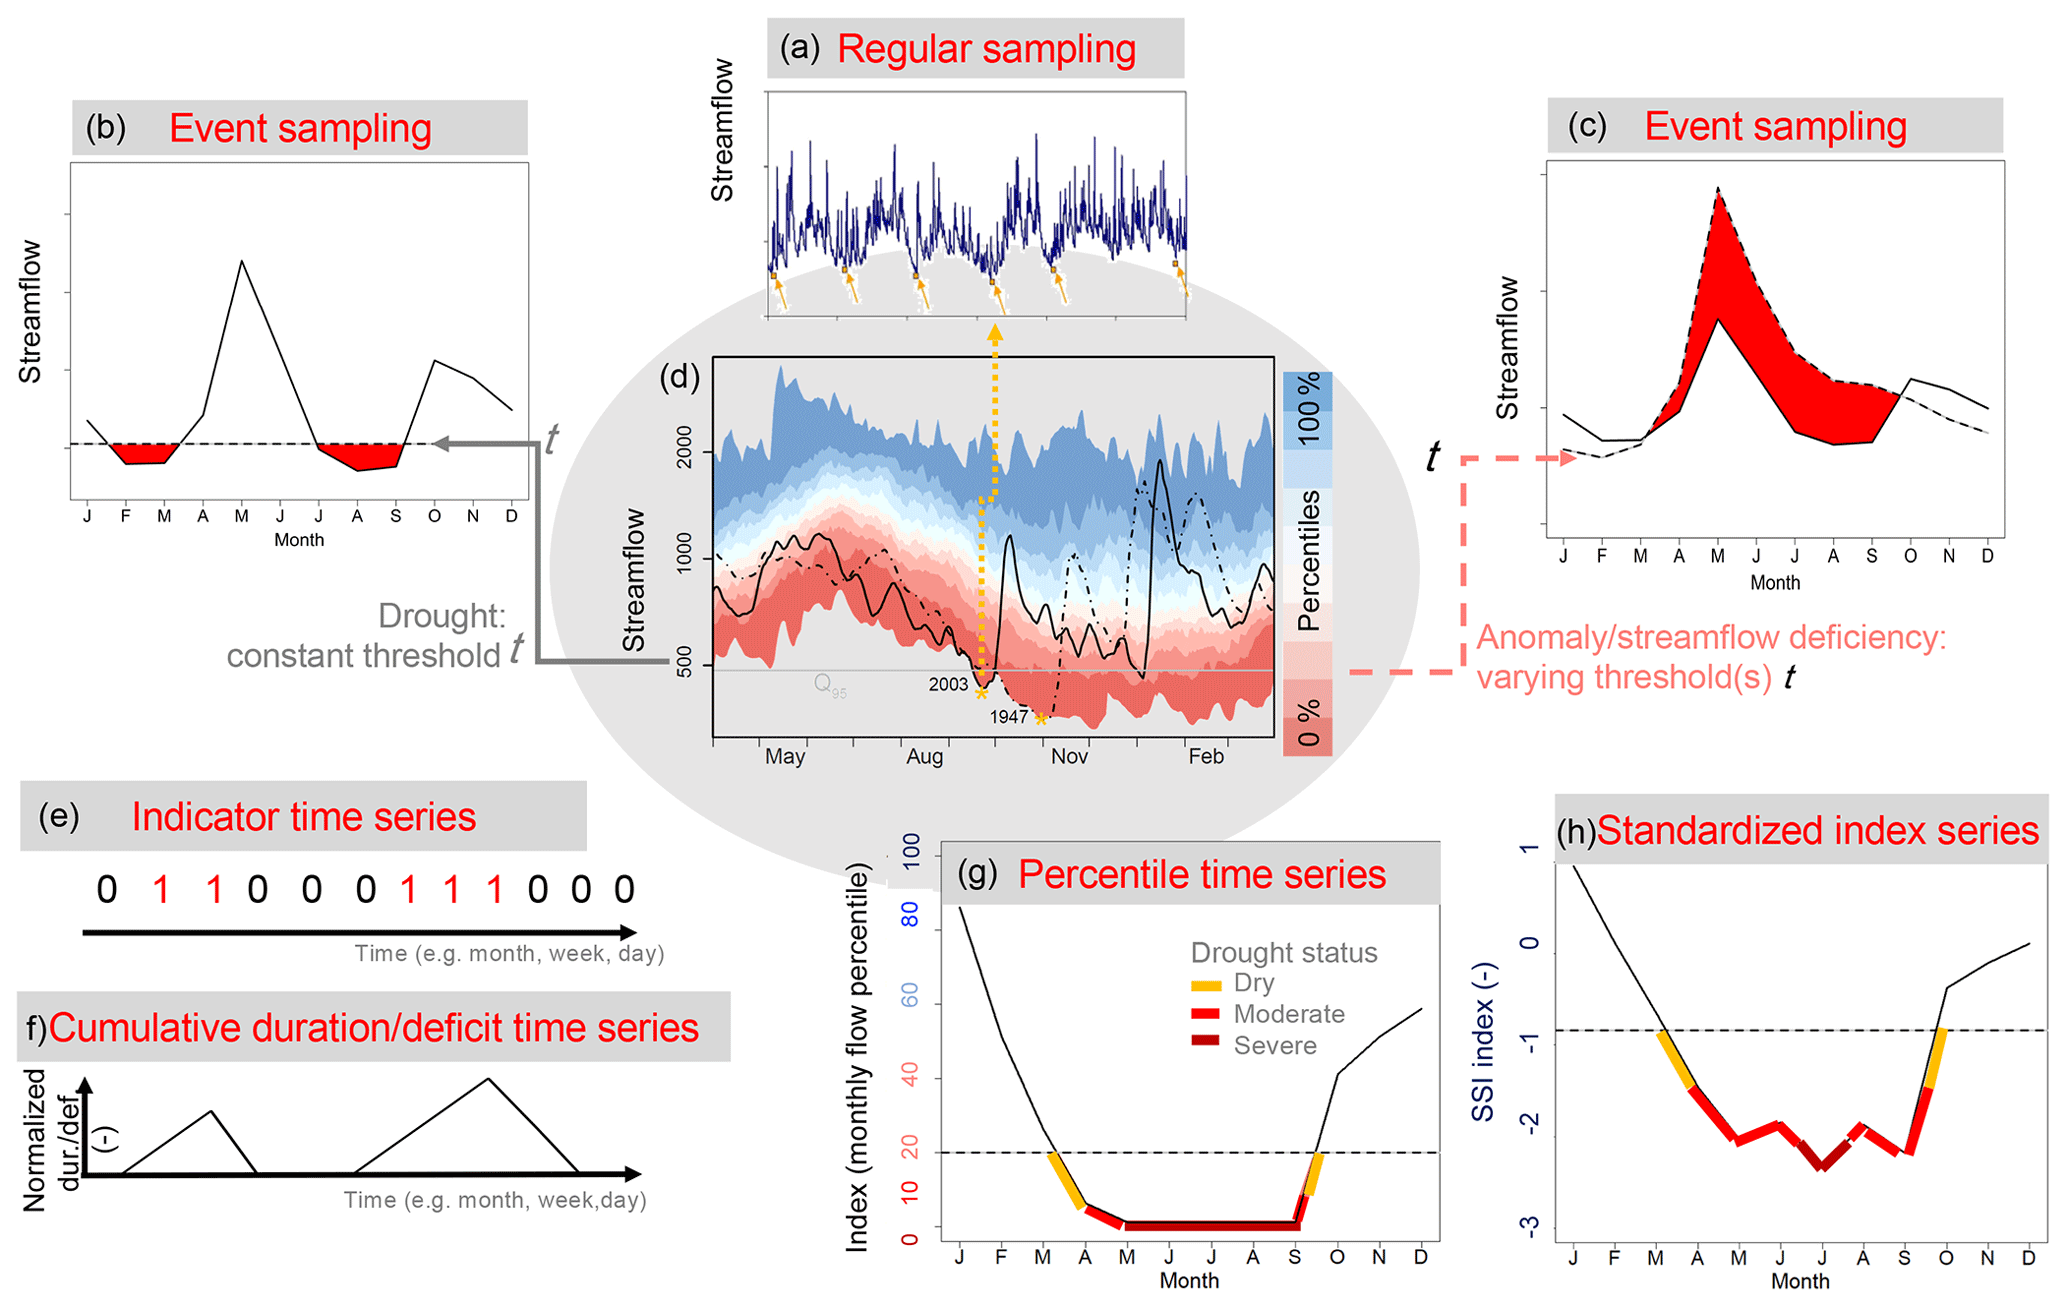
Figure 1Schematic illustration of low flow and drought indexing: the upper part shows indices derived with (a) regular sampling (e.g. annual minima) and (b) event sampling with constant thresholds (e.g. Q95 of the period-of-record flow duration curve) or (c) with a varying threshold; the lower part shows time series of a drought or low flow status indexed with (e) binary indicators for flow below a threshold, (f) cumulative durations/deficits derived from those, (g) timeseries transformed into percentiles and (h) standardized indices. Graphs are schematic for illustrative purpose and based on different data and sources, with an example of underlying streamflow data given in (d).
Tallaksen and van Lanen (2004) define a low flow or drought index as a “single-value index”, noting that alternative terms used include “statistic”, “measure”, “parameter” and others. Such an index can be derived in different ways, (i) sampled at regular intervals, e.g. one value per year, and then averaged, which is commonly done to derive low flow indices (Fig. 1a) or (ii) sampled as event characteristics with a particular set of criteria that define the event, which is often done to obtain drought event characteristics (Fig. 1b, c). Besides averaging, also probability distributions may be fitted to a sample of low flow values or drought event characteristics to derive an index value corresponding to a particular return period T.
Low flow indices include statistics such as a particularly rare (hence extreme) quantile of the flow duration curve, e.g. the flow exceeded 95 % of the time (Q95), the mean annual n-day minimum flow, MAM(n-day), or the value associated with a given return period (AM-n-dayT). Drought event characteristics are identified using the threshold level method or the sequent peak algorithm. Resultant indices include mean values or return periods of drought duration, deficit volume (severity), and intensity (severity/duration) defined from events below the threshold (τ). Often a low flow index is used as τ to define drought event characteristics. The threshold may be constant (Fig. 1b) or variable (Fig. 1c).
Not only the interdisciplinary tradition of using the term “index” for a single value, in drought research and management, also index-time series are common. Several such drought index time series can be created, some of which stem from single value indices. Streamflow series may be transformed and classified according to a given drought status based on the distribution of the entire time series (Fig. 1g, h) or with respect to the time of the year, i.e. a particular calendar month (week or day) (Fig. 1d). Similar to the single-value indices, this distinction is important for the interpretation of the index (Sect. 3). Indices derived from streamflow (or runoff) drought time series include the use of empirical percentiles. Furthermore, standardized streamflow or runoff indices, SRI, SSI and their variations, such as SFI for modelled streamflow by Vidal et al. (2010) or SMRI based on rain and snowmelt by Staudinger et al. (2014), have been developed. Theoretically, these indices could be calculated for different accumulation periods of n months as “SSI-n”, similar to the standardized precipitation indices SPI-n. As streamflow already integrates the hydrometeorology of the past months, we only consider monthly streamflow (sometimes called SSI-1, but for simplicity here called SSI). Figure 1g and h show that the shapes of the resulting transformed hydrographs may differ. Including a drought threshold into the definition allows to derive time series expressed, for example, as a binary drought/no-drought variable (Fig. 1e), which have been used e.g. to study changes over time due to regulation (Tijdeman et al., 2018), and map the area affected by drought (Tallaksen and Stahl, 2014). Alternatively, a cumulative duration or deficit can be derived (Fig. 1f) as for example for the Low Flow Index (LFI) of the European Drought Observatory (Cammalleri et al., 2017). For spatially simulated runoff, a timeseries of the “area in drought” within a particular region may be derived, and many others.
In summary, low flow and drought indices may be single value indices or time series indices that are derived from streamflow characteristics sampled at regular or irregular (event-based) intervals. The indices also differ regarding the conditions they are being related to (next section).
Drought is often broadly defined as a temporary deviation of normal water availability. As described in the previous section, “normal” can be defined with respect to different thresholds, either derived from the entire year's streamflow record or derived from a seasonal window (day of year, week of year, month of year, etc.). The early tradition in hydrology is the former. It involves defining drought by a distinct constant threshold of streamflow and is therefore directly linked to low flow situations.
For hydrological regimes with distinct seasonal variation and/or seasonally different water uses, it may be useful to vary the threshold to define drought throughout the year. Tallaksen and van Lanen (2004) describe both daily and monthly varying thresholds, stressing that the derived characteristics describe relative “streamflow deficiencies or anomalies”, which is distinctly different from the absolute “drought deficit” in the original threshold level method. The varying threshold level method has later been modified and deficiencies are now often also termed “drought events” (e.g. van Loon and van Lanen 2012, among many others), even though the event may occur during the wet season. However, impacts on the water availability for a particular use may not be felt until later in the year during the low flow season, or not at all if the deficit is recovered or of limited importance.
The use of daily, weekly or monthly anomalies that are categorized to create index time series for drought, is a relatively recent development within hydrology. The paradigm of drought as an anomaly with respect to the time of the year, has been adopted from the discipline of climatology and climate modelling. In addition, the use of a Standardized Streamflow Index (SSI) may have been spawned by WMO's recommendation of the Standardized Precipitation Index (SPI) as a uniformly applicable index. Van Loon and van Lanen (2012) describe typical processes leading to such anomaly-defined below-threshold events in different regimes. Anomalies have the advantage of often being more consistent regionally as they filter local catchment-specific modifications to meteorological input. Caillouet et al. (2017) capitalized on the advantages of both approaches by using a combination of fixed and variable thresholds for the reconstruction of historic extreme low flows in France. So far, however, the comparison between the two approaches and the implications of a paradigm shift for hydrology have not been given much systematic thought. In summary, a more integrated view on drought across the disciplines and their conventions appears useful. There may be certain demands on the definition of hydrological drought given its purpose, which suggest a careful evaluation of the drought and anomaly paradigms. Most practitioners highlight that they use particular flow levels rather than anomalies as triggers for management actions. Clarifying the various interpretations of drought events as defined using different approaches and their link to major environmental, economic and societal impacts and drought management aspects, are therefore important.
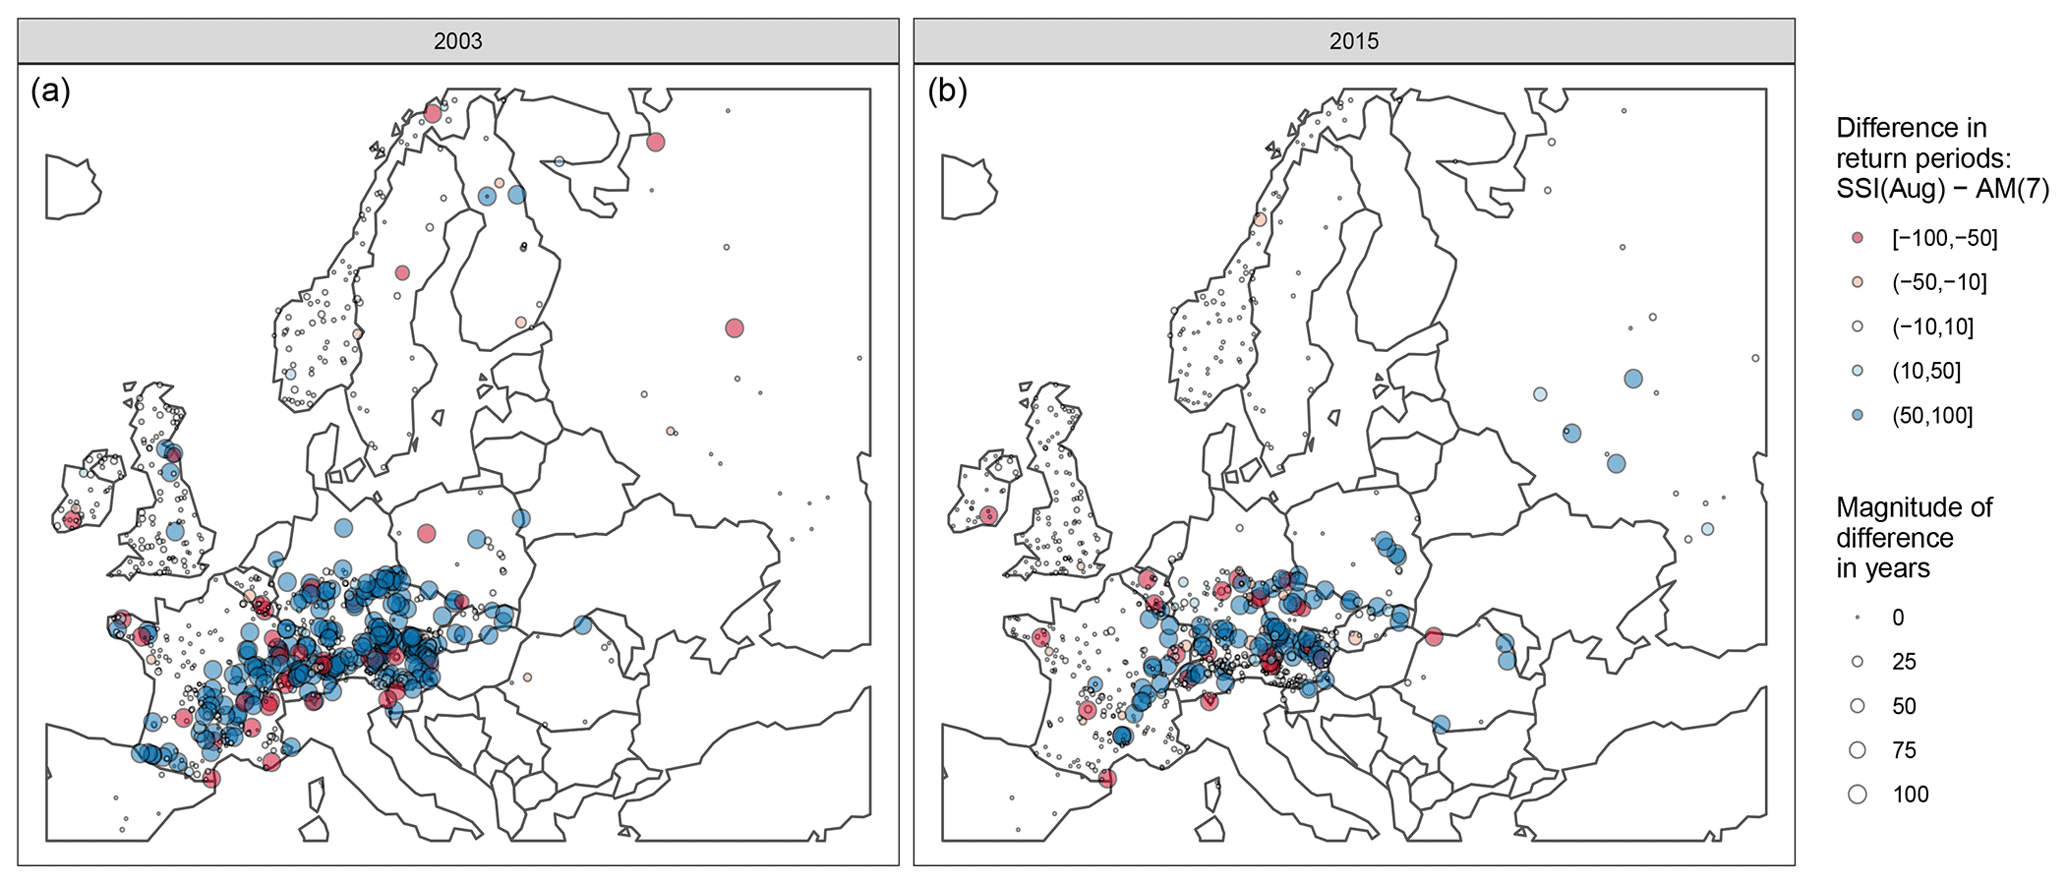
Figure 2Difference in the return periods T of the droughts in 2003 (a) and 2015 (b) estimated by SSI(August) and AM(7) with differences given in Years as: TSSI(August)–TAM(7), resulting in positive differences (blue colors), where TSSI estimates a higher T (more severe event) and negative differences (red colors), where TAM(7) estimates a more severe event. Methods and data are based or an extension of the streamflow drought dataset from Laaha et al. (2017).
Members of the EURO FRIEND-Water Low Flow and Drought Group have over time experienced changing paradigms in low flow and drought indices, including and beyond the use of anomalies. Particularly cross-disciplinary and transdisciplinary projects have added new demands and viewpoints. Collaborations with climatologists and large-scale hydrology modelers on climate change projects have, for example, promoted the use of monthly anomalies similar to precipitation and the derivation of spatial and temporal drought characteristics below a threshold as described above. The approach is robust as large-scale models tend not to represent absolute streamflow values very accurately (e.g. Gudmundsson et al., 2014). It also allows to communicate future relative changes. Nevertheless, it presents a change from the traditional viewpoint of hydrological drought as extreme low flow with immediate impacts, e.g. on river habitats and water use restrictions, to a relative lower seasonal flow, which may not have simultaneously impacts. Another change in paradigm has been the use of less extreme thresholds for drought definition, i.e. from a commonly used threshold of 10 % or lower daily streamflow exceedance probabilities, to monthly quantiles in the 20 % range. Whether this may result in an altered perception of the extremeness of drought overall needs to be investigated.
Another recent development is that many regions or countries have – or are in the process of – establishing drought monitoring and early warning online systems as an important component of drought risk management. Such continuous monitoring, based on observation or simulation data, requires time series indices and the result is often displayed spatially on maps. In their review of existing systems, Bachmair et al. (2016) found that only few use hydrological drought indices. Those that do tend to use anomaly-based time series indices such as monthly percentiles (e.g. US Drought Monitor), SSI (e.g. UK Drought Portal), or the LFI (European Drought Observatory). Still, national river flow monitoring is often separate and has traditionally focused on floods. There appears to be no consensus how to monitor low flows continuously as part of drought monitoring. Many different approaches exist. Some of the national mapping-based river flow monitoring in Europe simply mark stations with daily flow below the mean or below the 25th percentile or use a combination of percentiles and mean annual minimum flows (e.g. Bavaria's Low flow information service website https://www.nid.bayern.de/, last access: 2 August 2020).
The estimation of return periods is another paradigm that has a long tradition in hydrological planning, mainly for design flood estimation. Return periods for low flows and drought have been studied extensively and e.g., allowed a comparison of the severity of particular drought events (e.g. Laaha et al., 2017). So far little work has been done to compare the probability of a low flow or drought index derived from regular or event-based sampling with for instance the SSI in a particular month of a drought. Figure 2 shows such a comparison, i.e. the spatial distribution of the differences between return periods estimated from a traditional low flow frequency analysis of the AM(7) and the SSI of the month of August, for the droughts of 2003 and 2015 based on a large sample of streamflow records in Europe. For simplicity, August was assumed here to have been the most severe month everywhere, which may cause some of the differences. Nevertheless, August was one of the peak drought months in both 2003 and 2015 and notable differences between return periods can be seen. Further details on this study, including data and methods, are given in Laaha et al. (2017). The study suggests that similar comparisons may provide useful insights into how to interpret the severity of droughts using different indices.
Another inter- and transdisciplinary task supporting drought management, is the mapping of drought vulnerability and risk. Such maps may help to set regional priorities and are often constructed by indexing vulnerability factors that relate to drought sensitivity, adaptive capacity and exposure. FRIEND members have experienced that in particular the popular SPI-based time series indices, perhaps because they are widely known from drought information systems, are often falsely considered suitable for such a purpose. The question of distinguishing regions that are more or less prone to drought (exposed to drought) require single-value indices that are able to reveal differences in real water availability.
These examples only provide a small selection of paradigm shifts and emerging issues noticed by the group. Many further experiences exist and should be thoroughly discussed and evaluated in terms being `fit for purpose' and easy to communicate.
The high diversity of drought definitions and related indices appears to have further increased over the past years. Some shifts in paradigms have taken place as a consequence of changing use and emerging applications: Indices used for streamflow monitoring purposes, for example, and indices used as reference values for climate change adaptation studies, need to be different and fit for purpose. This may require either comparative anomalies or quantitative targets. Members of the EURO FRIEND-Water Low flow and Drought group have experienced different preferences in the use of drought indices among stakeholders in different disciplines and countries. Overall there are some indications of shifting preferences towards more use of anomaly-based definitions and less extreme thresholds, though robust conclusions will require a better survey of practices of index usage. A guide to the interpretation, comparability and recommended usage of the wealth of indices is therefore needed.
Details on streamflow data collection are given in the cited source: Laaha et al. (2017). Most data is available from the GRDC portal https://portal.grdc.bafg.de (last access: 2 August 2020), which contains the former FRIEND European Water Archive.
All co-authors contributed to the manuscript design, content and editing. KS, ET, GL and TG made the figures.
The authors declare that they have no conflict of interest.
This article is part of the special issue “Hydrological processes and water security in a changing world”. It is a result of the 8th Global FRIEND-Water Conference: Hydrological Processes and Water Security in a Changing World, Beijing, China, 6–9 November 2018.
This research has been supported by the Deutsche Forschungsgemeinschaft (grant no. STA632/3-1) and the Natural Environment Research Council (grant no. NE/R016429/1 (UK-SCAPE)) and Austrian Climate Research Program ACRP, project DALF-Pro (GZ B464822).
Bachmair, S., Stahl, K., Collins, K., Hannaford, J., Acreman, M., Svoboda, M., Knutson, C., Smith, K., Wall, N., Fuchs, B., Crossman, N., and Overton, I.: Drought indicators revisited: the need for a wider consideration of environment and society, Wiley Interdisciplinary Reviews Water, https://doi.org/10.1002/wat2.1154, 2016.
Caillouet, L., Vidal, J.-P., Sauquet, E., Devers, A., and Graff, B.: Ensemble reconstruction of spatio-temporal extreme low-flow events in France since 1871, Hydrol. Earth Syst. Sci., 21, 2923–2951, https://doi.org/10.5194/hess-21-2923-2017, 2017.
Cammalleri, C., Vogt, J., and Salamon, P.: Development of an operational low-flow index for hydrological drought monitoring over Europe, Hydrol. Sci. J., 62, 346–358, https://doi.org/10.1080/02626667.2016.1240869, 2017.
Gudmundsson, L., Wagener, T., Tallaksen, L. M., and Engeland, K.: Evaluation of nine large-scale hydrological models with respect to the seasonal runoff climatology in Europe, Water Resour. Res., 48, W11504, https://doi.org/10.1029/2011WR010911, 2012.
Laaha, G., Gauster, T., Tallaksen, L. M., Vidal, J.-P., Stahl, K., Prudhomme, C., Heudorfer, B., Vlnas, R., Ionita, M., Van Lanen, H. A. J., Adler, M.-J., Caillouet, L., Delus, C., Fendekova, M., Gailliez, S., Hannaford, J., Kingston, D., Van Loon, A. F., Mediero, L., Osuch, M., Romanowicz, R., Sauquet, E., Stagge, J. H., and Wong, W. K.: The European 2015 drought from a hydrological perspective, Hydrol. Earth Syst. Sci., 21, 3001–3024, https://doi.org/10.5194/hess-21-3001-2017, 2017.
Staudinger, M., Stahl, K., and Seibert, J.: A drought index accounting for snow, Water Resour. Res., 50, 7861–7872, https://doi.org/10.1002/2013WR015143, 2014.
Tallaksen, L. M. and van Lanen, H. A. J. (Eds): Hydrological drought – Processes and Estimation Methods for Streamflow and Groundwater Development in Water Sciences no. 48, Elsevier Publ., The Netherlands, 579 pp., 2004.
Tallaksen, L. M. and Stahl, K.: Spatial and temporal patterns of large-scale droughts in Europe: model dispersion and performance, Geophys. Res. Lett., 41, 429–434, https://doi.org/10.1002/2013GL058573, 2014.
Tijdeman, E., Hannaford, J., and Stahl, K.: Human influences on streamflow drought characteristics in England and Wales, Hydrol. Earth Syst. Sci., 22, 1051–1064, https://doi.org/10.5194/hess-22-1051-2018, 2018.
Van Loon, A. F. and Van Lanen, H. A. J.: A process-based typology of hydrological drought, Hydrol. Earth Syst. Sci., 16, 1915–1946, https://doi.org/10.5194/hess-16-1915-2012, 2012.
Vidal, J.-P., Martin, E., Franchistéguy, L., Habets, F., Soubeyroux, J.-M., Blanchard, M., and Baillon, M.: Multilevel and multiscale drought reanalysis over France with the Safran-Isba-Modcou hydrometeorological suite, Hydrol. Earth Syst. Sci., 14, 459–478, https://doi.org/10.5194/hess-14-459-2010, 2010.