the Creative Commons Attribution 4.0 License.
the Creative Commons Attribution 4.0 License.
 | 16 Sep 2020
Hydrological Drought Characteristics Based on Groundwater and Runoff Across Europe
Samuel Jonson Sutanto
Henny A. J. Van Lanen
Hydrological drought often gets less attention compared to meteorological drought. For water resources managers, information on hydrological drought characteristics is prerequisite for adequate drought planning and management. Therefore, the aim of this study is to analyse hydrological drought characteristics in the pan-European region based on past drought events from 1990 to 2017. The annual average drought duration, deficit volume, onset, termination, and intensity during drought years were calculated using daily runoff and groundwater data. All data were simulated with the LISFLOOD hydrological model (resolution 5×5 km) fed with gridded time series of observed weather data. Results based on runoff and groundwater data show that regions in Northeast to Southeast Europe, which stretched out from Poland to Bulgaria, were identified as profound regions to severe hydrological drought hazards. The most severe droughts during our study period were observed in 1992 to 1997, where on average Europe experienced drought events, which lasted up to 4 months. Long average drought durations up to 4 and 8 months in runoff and groundwater occurred in a few parts of the European regions (around 10 % area). Longer drought durations and a lower number of drought events were found in groundwater drought than in runoff, which proved that slow responding variables (groundwater) are better in showing extreme drought compared to fast responding variables (runoff). Based on our results, the water managers can better prepare for upcoming drought and foster drought adaptation actions.
- Article
(7898 KB) - Full-text XML
- BibTeX
- EndNote


Drought by definition is a sustained and regionally-extensive period of below-average natural water availability. The spatial and temporal characteristics of drought vary from one region to another (Tallaksen and Van Lanen, 2004). Compared to other flashy natural hazards, such as floods, flash floods, and landslides, drought events develop slower and sometimes unnoticed, but have comparable devastating impacts in terms of economy, society, and environment (Mishra and Singh, 2010). Based on its types, droughts are generally classified into four categories: meteorological drought, soil moisture drought or agriculture drought, hydrological drought, and socio-economic drought (Tallaksen and Van Lanen, 2004; Mishra and Singh, 2010; Van Loon, 2015). Meteorological drought is defined as a lack of precipitation, possibly combined with increased evapotranspiration, over a region for a period of time. Soil moisture drought occurs when the supply of moisture to vegetation decreases leading to yield reduction or even crop failure. Hydrological drought is related to negative anomalies in surface and subsurface water (including groundwater). Socio-economic drought refers to the failure of water resources systems associated with the impacts of the three aforementioned drought types.
All these four drought types in general are triggered by atmospheric conditions. A prolonged lack of precipitation (meteorological drought) can propagate through the soil moisture, which in turn, affects the whole hydrological systems, resulting in soil moisture drought and hydrological drought, respectively (Peters et al., 2003; Tallaksen and Van Lanen, 2004; Van Loon and Van Lanen, 2012). This might be a reason that droughts often are viewed from a climatic perspective, by only looking at anomalies in climatic variables, such as precipitation and temperature (Herring et al., 2015; Heim, 2015). Another reason is data availability and access. Climatic data are largely available compared to hydrological data, such as discharge, runoff, and groundwater. Based on these reasons, hydrological droughts have received lesser attention than meteorological drought.
Although meteorological drought has ben intensively studied in the past (Llyod-Hughes and Saunders, 2002; Stagge et al., 2017; Bachmair et al., 2018), many recent studies showed that droughts could not be simply characterized by a lack of precipitation alone (Teuling et al., 2013; Haslinger et al., 2014). Minor meteorological drought may not develop into a hydrological drought, but a series of meteorological droughts can evolve into one long hydrological drought. Specific hydrological drought studies also indicate that hydrological drought diverges from meteorological drought due to its complex phenomenon and different catchment characteristics (Peters et al., 2003; Vidal et al., 2010; Van Dijk et al., 2013; Van Loon and Van Lanen, 2012; Van Lanen et al., 2013; Wanders et al., 2017). Moreover, drought impacts, such as water supply, water-borne transport, and hydropower energy production are more closely linked with hydrological drought rather than with meteorological ones. Understanding hydrological drought characteristic, therefore, is a key for the management and assessments of water resources under drought (Van Lanen et al., 2016). Hence, information on hydrological drought characteristics is prerequisite for adequate drought planning and management.
In this study, hydrological drought characteristics, such as drought duration, deficit volume, onset, termination, and intensity, in the pan-European region were analysed based on past drought events from 1990 to 2017. While many studies have mainly focused on precipitation or soil moisture drought (Spinoni et al., 2016; Haslinger et al., 2014), this study analysed drought characteristics based on runoff and groundwater data. Groundwater is slower responding than, e.g., precipitation and streamflow. It is one of the most important components for the development of hydrological drought (Van Lanen et al., 2013). Thus, the information derived from the hydrological drought characteristics will give additional value to better understanding of droughts in Europe and support water resources managers for managing and planning drought in their regions.
2.1 Data
Groundwater and runoff data for the pan-European region were simulated using the LISFLOOD hydrological model fed with gridded time series of observed weather data (thereafter called the LISFLOOD simulation forced with observations, SFO) (De Roo et al., 2000; Van der Knijff, 2008). The model calculates a complete water balance every 6 h or daily for every grid-cell (5 by 5 km in total 259 023 land cells) within the model domain in Europe. Spatially-distributed thematic data on soil, vegetation, and land use obtained from European datasets were used to set up the LISFLOOD model. A calibration was carried out using river discharge data in 258 catchments by tuning parameters that control snowmelt, overland flow, river flow, infiltration, residence times in the soil and subsurface (Feyen and Dankers, 2009; Forzieri et al., 2014). This spatially-distributed rainfall runoff model has initially been used within the European Flood Awareness System (EFAS) to provide data for flood monitoring and warnings (Thielen et al., 2009; Van der Knijff et al., 2010). Later it has been extended to a drought early warning system within the EU ANYWHERE project (Sutanto et al., 2020). The model was run from 1990 to present. In the study, however, we only used the model data from 1990 to 2017 for runoff with missing data in 2013 and 2014 for runoff, and in 2013 and 2017 for groundwater. For groundwater data, we summed groundwater data from upper layer and deep layer.
2.2 Method
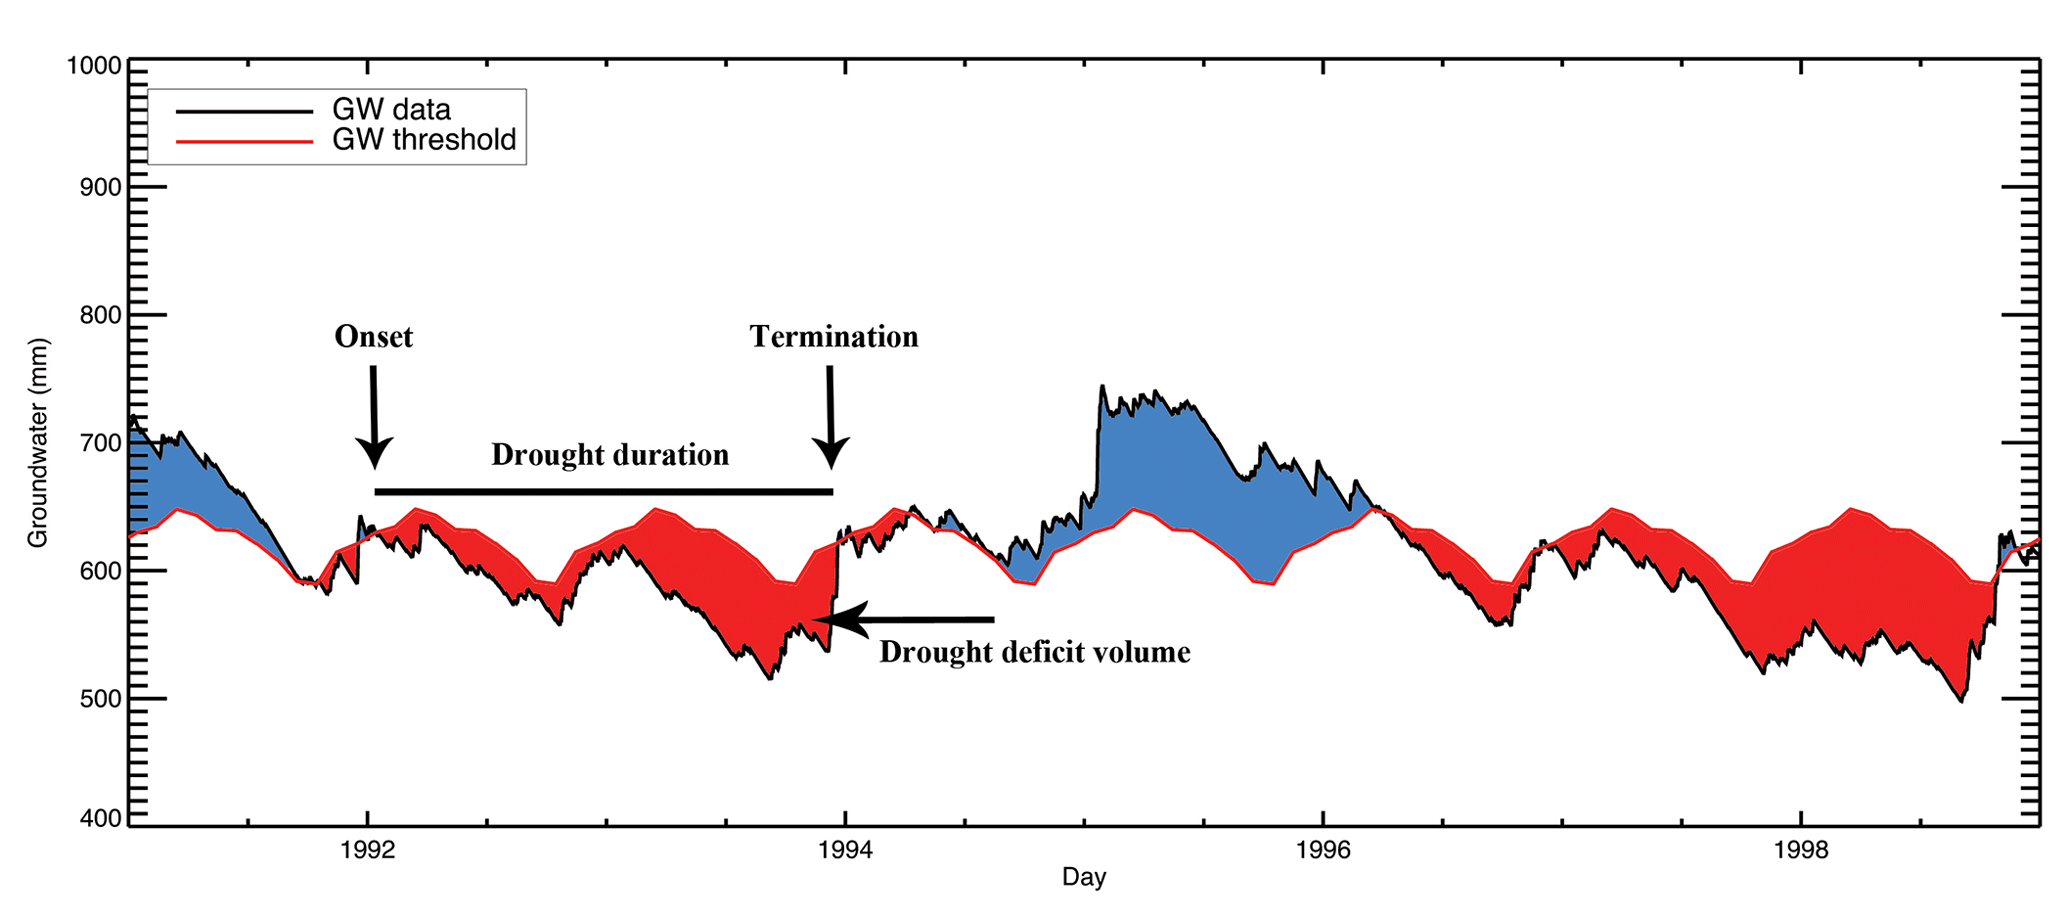
Drought events were determined using the variable threshold method (Yevjevich, 1967; Hisdal et al., 2004). Drought starts when the groundwater or runoff data fall below a certain threshold value and ends when it is equal or rises above the threshold (Eq. 1). In this study, the threshold values were derived from the 80th percentile of the duration curve (Q80, Hisdal et al. (2004); Van Loon and Van Lanen (2012)).
where is the drought occurrence for the hydrological variable k, grid cell x and y, and day t (time step). is the targeted hydrological variable, and is the 30 d moving average of the variable threshold. is a binary variable; one if a drought event is found (negative, red color in Fig. 1) and zero if no drought event is found (positive, blue color in Fig. 1).
Using the threshold method, the following drought characteristics can be quantified for each drought event: drought duration (day), drought deficit volume for runoff (mm), onset (day), termination (day), and intensity (mm d−1) (see also Fig. 1). The duration of a drought event is defined as the number of uninterrupted time steps (day) with a hydrological variable below the threshold value. In our study, the duration of drought is calculated as total duration of all drought events for each year.
where is the total drought duration (day) for hydrological variable k, grid cell x and y, and year z. i is the day number in the particular year z, which is 365 for none-leap year and 366 for a leap year.
The deficit volume of a drought event is defined as the sum of the deficit volumes over a number of uninterrupted time steps (day) with a hydrological variable below the threshold value. We also calculated the drought deficit volume as total deficit volume of all drought events for each year (in mm).
where is the total deficit volume in runoff drought in mm for hydrological variable k, grid cell x and y, and year z.
Drought onset and termination are defined as the starting date and ending date of drought event over a number of uninterrupted time steps with a hydrological variable below the threshold value. In this study, we selected the onset and termination date from the longest drought event (duration) in each year.
Drought onset and termination are defined as the starting date and ending date of drought event over a number of uninterrupted time steps with a hydrological variable below the threshold value. In this study, we selected the onset and termination date from the longest drought event (duration) in each year.
During the period from 1990 to 2017, many parts of Europe suffered from noticeable droughts, such as in 1991–1995, 1996–1997, 2000, 2003, 2004–2007, 2010, 2011, 2015 (Stagge et al., 2013; Spinoni et al., 2015; Van Lanen et al., 2016). Those events are captured well in the hydrological drought analyses using groundwater droughts in South-West Germany obtained from the LISFLOOD SFO model output from 1991–1997, as an example (Fig. 1). In that period, at least two major drought events clearly showed up. The first drought event occurred from the end of 1991 to the beginning of 1994 and then the next major drought event occurred from the beginning of 1996 to the end of 1998. The capability of the LISFLOOD model to simulate hydrological droughts (here runoff and groundwater) opens an opportunity to determine drought characteristics across Europe that will be presented in the next sub chapters.
3.1 Drought duration
Annual drought duration was calculated from the total number of days when the hydrological variable was below the predefined threshold in each year. These durations were then averaged in order to obtain the spatially-distributed average drought duration in Europe over the period 1990–2017 (see Fig. 2a and b for runoff and groundwater, respectively). This was only done for the drought years, that is, years with at least one day in drought. Thus, the analysis excludes non-drought years. The number of drought years may differ per cell and per variable (groundwater, runoff). Our results show that the groundwater drought has a longer duration than the runoff drought. In many parts of Europe, the duration of drought in groundwater can be twice longer than in runoff. The longest drought duration for both runoff and groundwater are detected in the east of Europe (starting from Poland stretching out to Bulgaria), as well as in Northwest Russia, with duration from 200 to 300 d for runoff (7–10 months, Fig. 2a) and from 300 to 330 d for groundwater (10–11 months, Fig. 2b). North, West, and South Europe in general have similar drought durations, with durations around 90 d for runoff (3 months) and 150 d for groundwater (5 months).
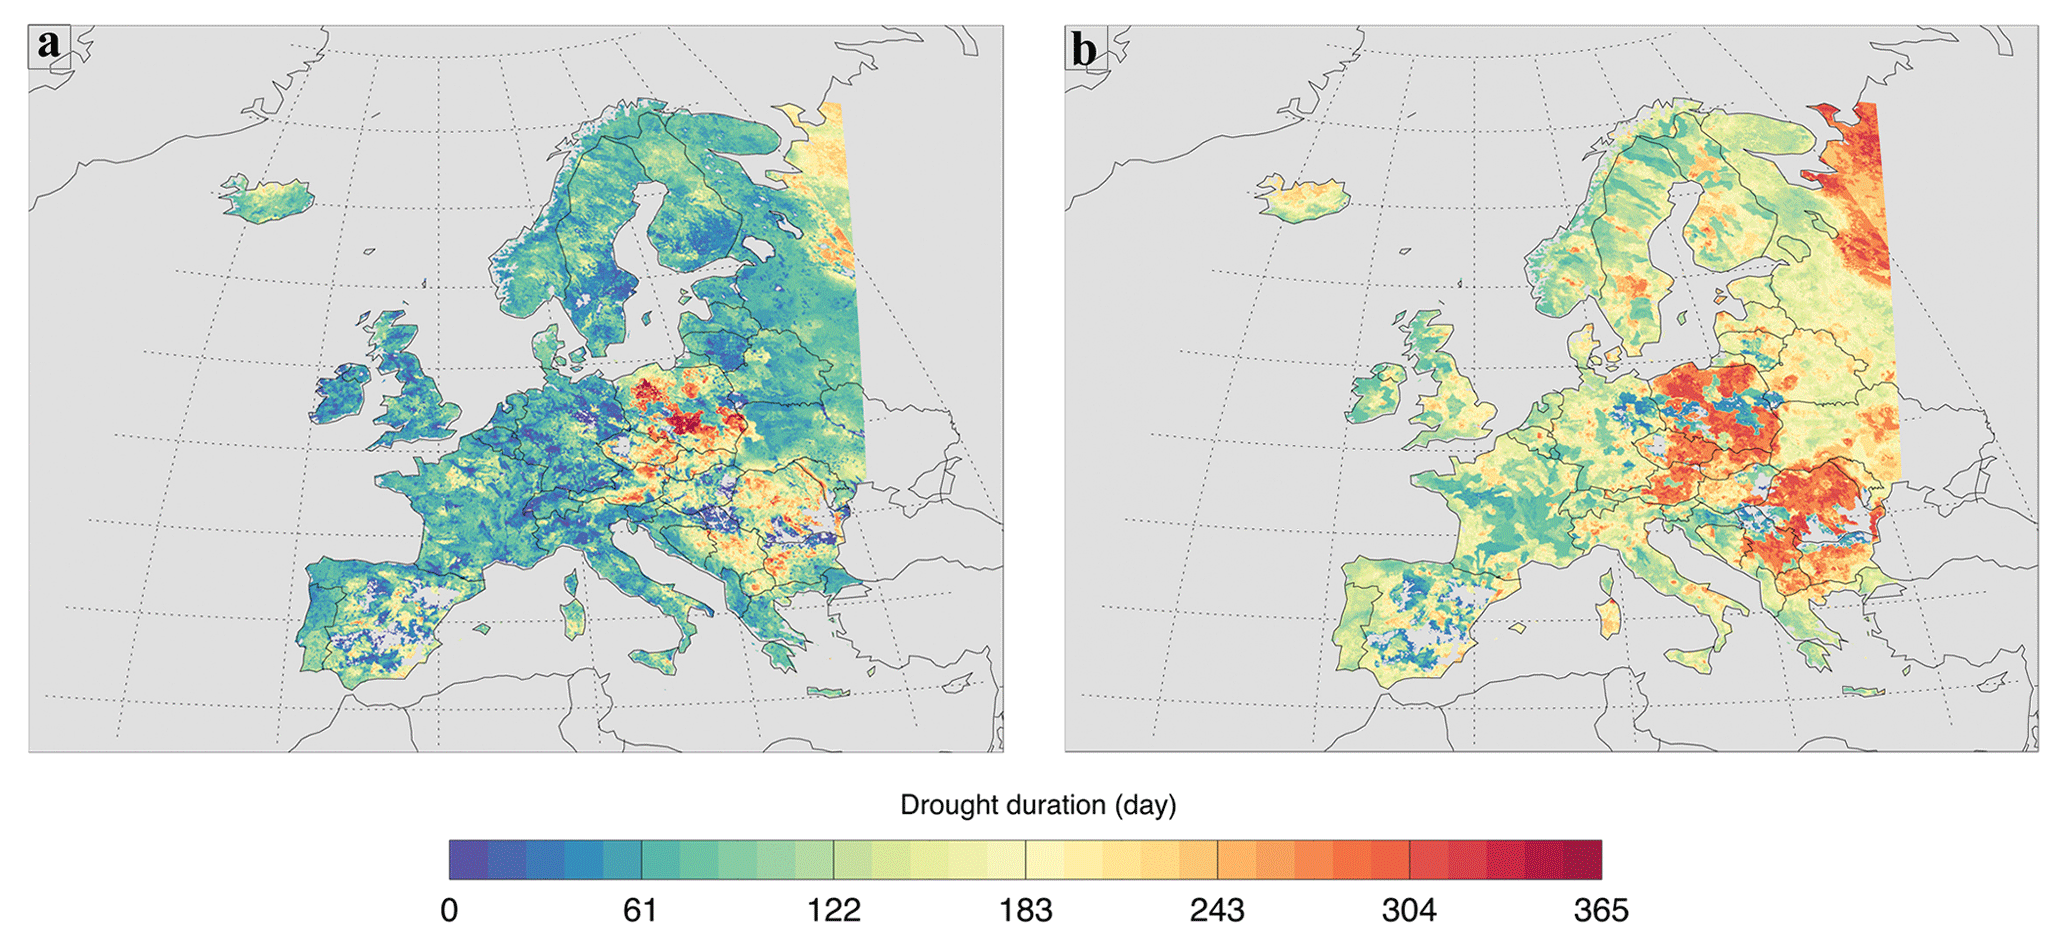
Figure 2Spatial distribution of the average annual drought duration (days per year in drought years) derived from drought in runoff (a) and groundwater (b), over the period 1990–2017. Non-drought years are excluded.
The longest drought duration show up in groundwater compared to runoff, which indicates drought propagation (Peters et al., 2003; Van Lanen and Tallaksen, 2007; Van Loon and Van Lanen, 2012; Van Loon et al., 2012). Drought events become longer when moving from precipitation, soil moisture to subsurface or groundwater storage, associated with fast and slow responding variables (Tallaksen et al., 2009; Van Lanen et al., 2013). Runoff usually takes an intermediate position. The fast responding variables, such as precipitation, and to a lesser extent such as, runoff and discharge, in principle, have shorter drought durations, but a higher number of drought events. On the other hand, slowly responding variables, such as groundwater, have longer drought duration but lesser drought occurrences (Fig. 3). This can be seen, for instance, in Eastern Europe, such as Latvia, Lithuania, Belarus, and Ukraine, where the drought duration is high (∼200 d, Fig. 2b), the number of drought events in groundwater is low (∼10 events from 1990–2017, Fig. 3b). Runoff shows lesser drought duration (∼60 d, Fig. 2a) but higher number of drought years (∼20 events, Fig. 3a).
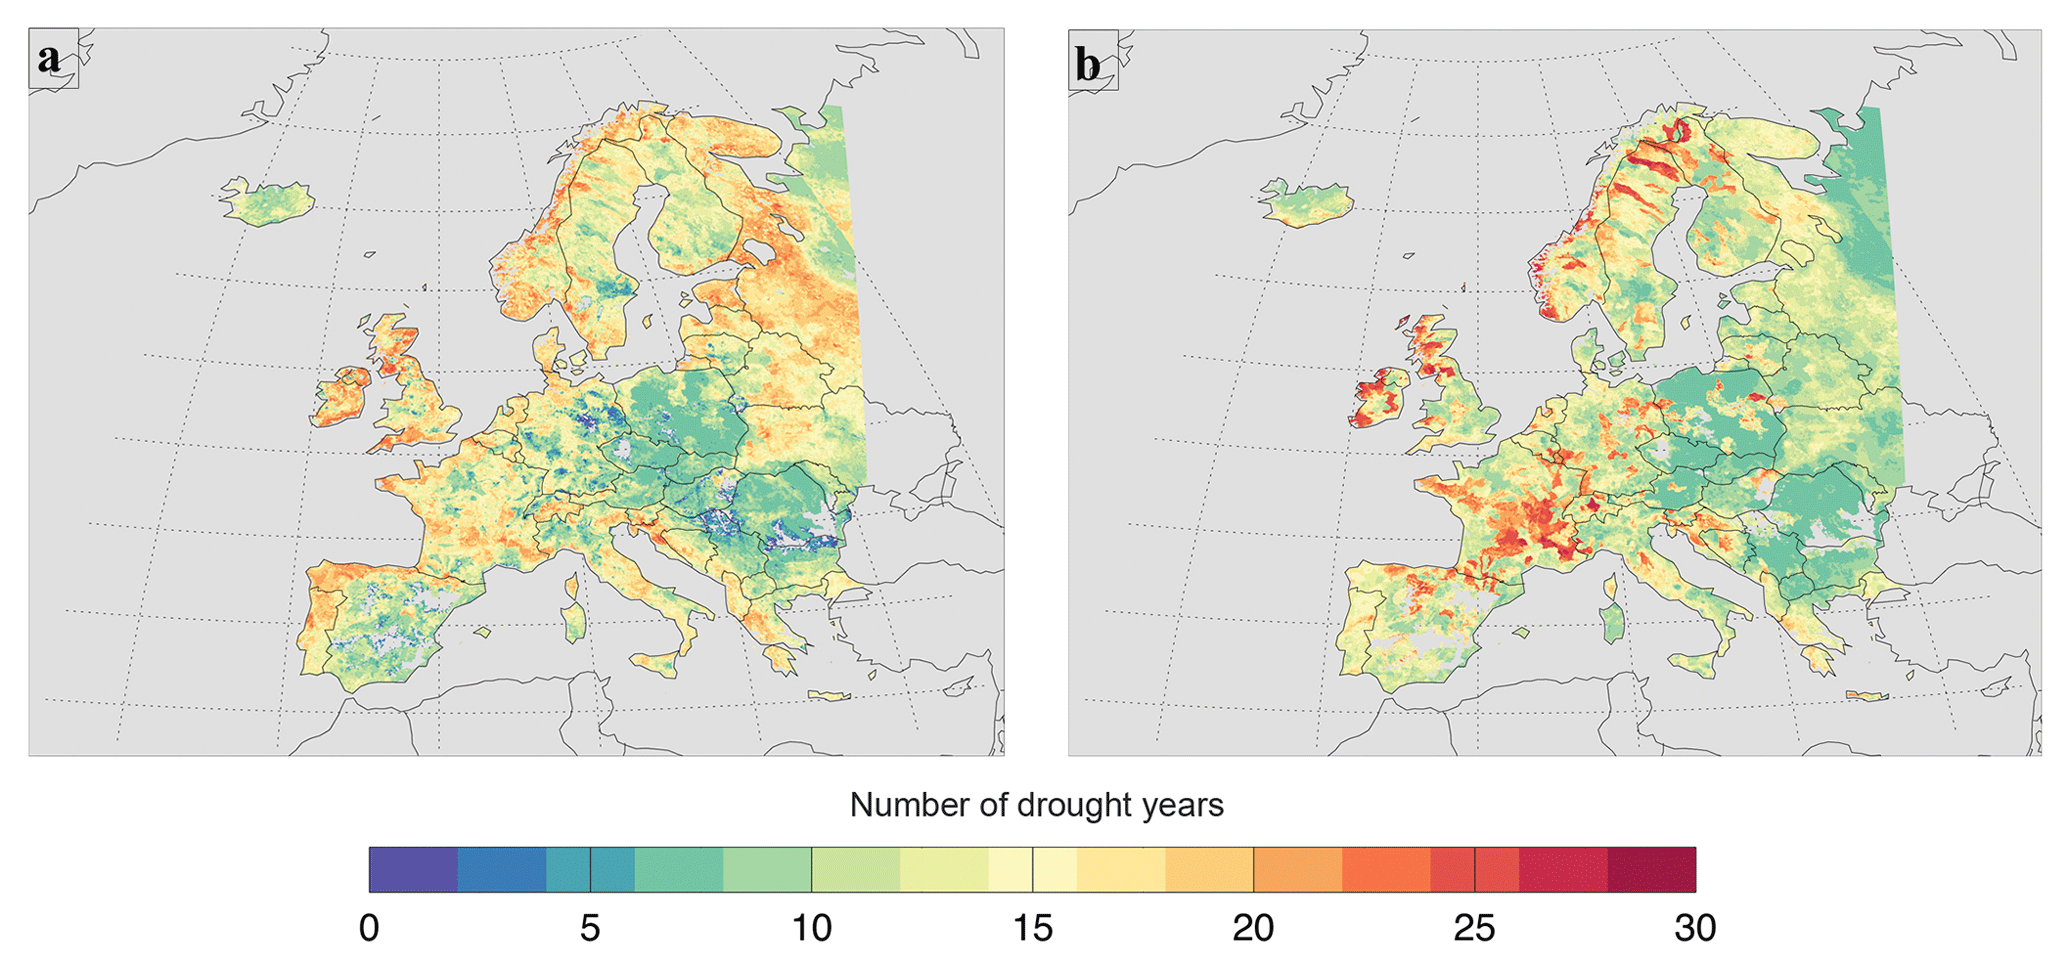
Figure 3Spatial distribution of the number of drought years derived from drought in runoff (a) and groundwater (b) over the period 1990–2017.
3.2 Drought deficit volume and intensity
Similar like drought duration, the highest drought deficit volumes based on runoff are situated in the east of Europe (starting from Poland stretching out to Bulgaria), as well as in Northwest Russia (Fig. 4a). This was expected, since the longer the drought, the more water would be lost. In these regions on average, availability of runoff water is around 20 to 40 mm lower than normal during the drought years (Fig. 4a). In addition, the eastern European regions also suffer from high groundwater drought intensity (Fig. 4b). On average, more than 100 mm d−1 of groundwater is lost during the drought years in these regions.
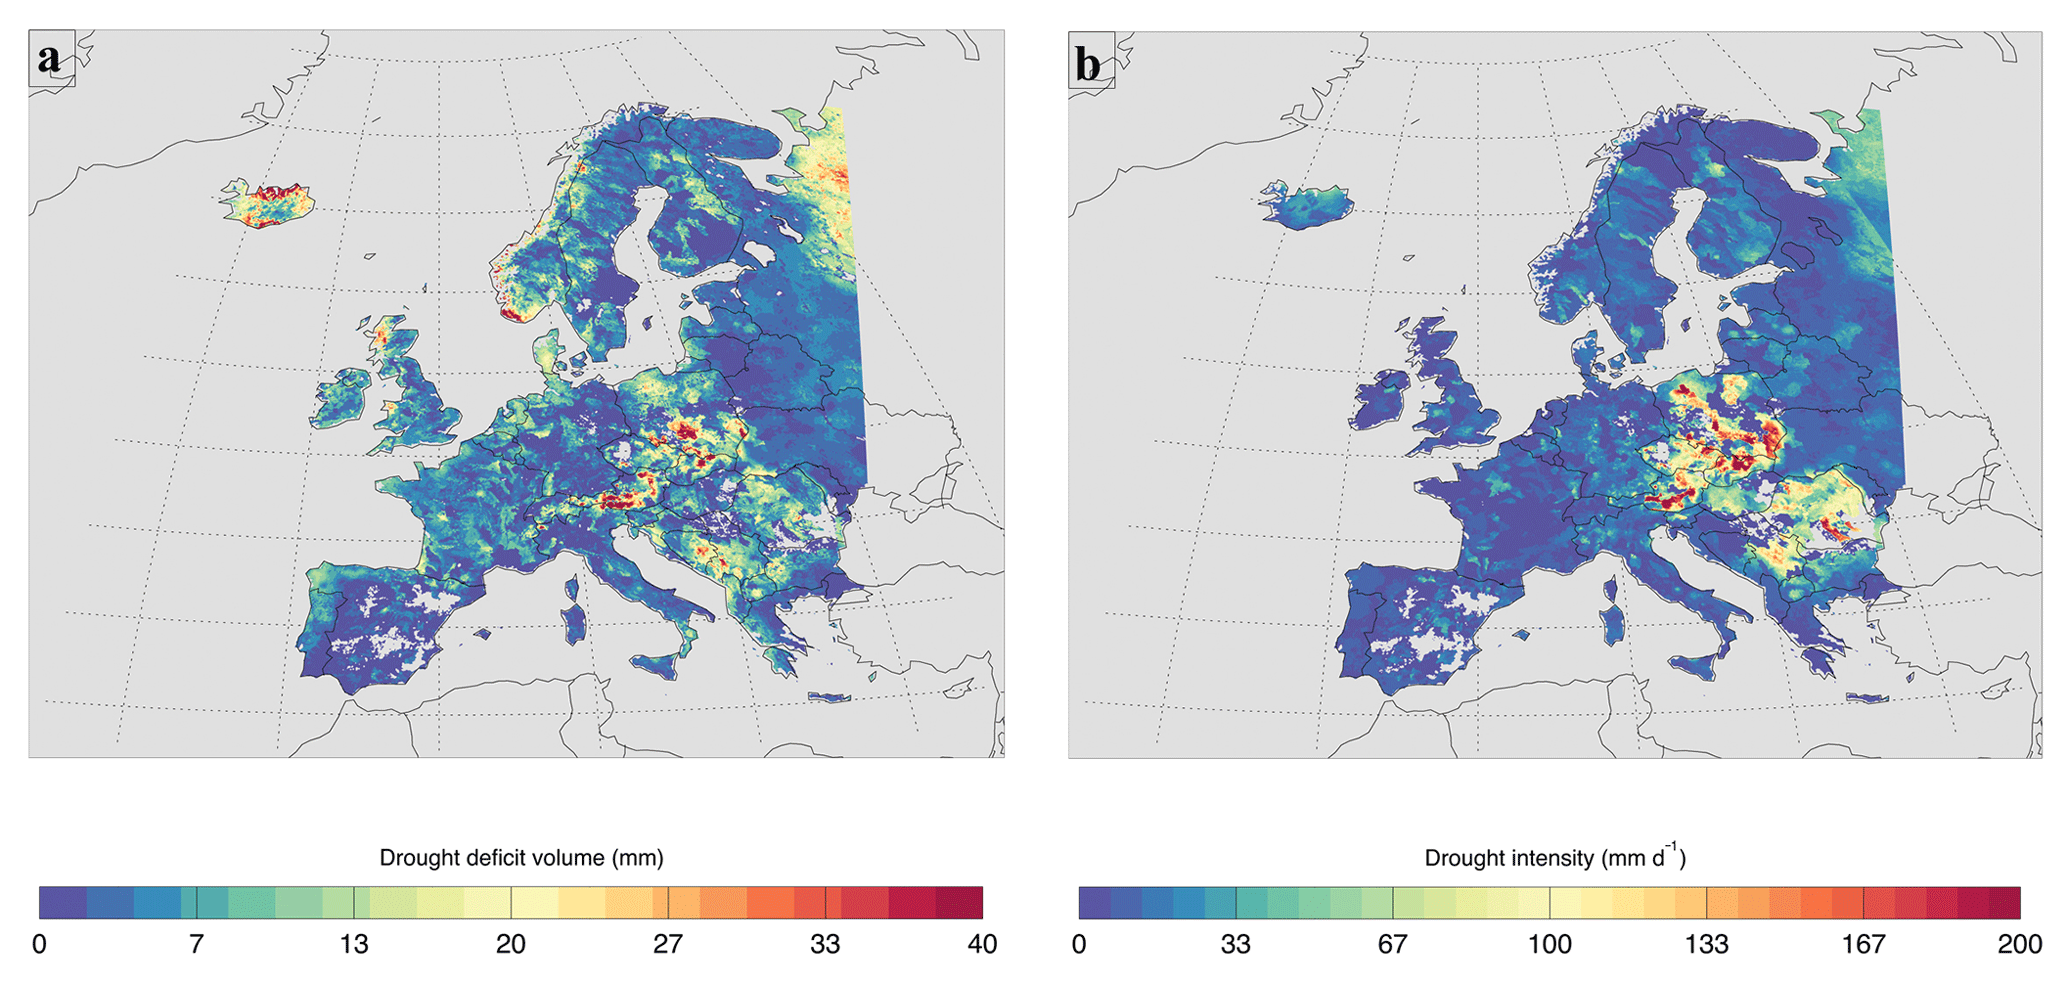
Figure 4Spatial distribution of the average annual drought deficit volume (mm per year in drought years) derived from drought in runoff (a) and the average annual drought intensity (mm per day in drought years) derived from drought in groundwater (b), over the period 1990–2017. Non-drought years are excluded.
One interesting phenomenon was found in Iceland. The island, which has similar drought durations as West Europe (3 months for drought in runoff, Fig. 2a), has higher drought deficit volumes. Drought events in Iceland are frequent, but have short drought durations. Hydrological variables fluctuate more in West Europe, resulting in higher threshold values and a larger deviation from the threshold. Early and/or late snow accumulation and melting may also play a significant role for droughts in this region e.g., cold and warm snow season drought (Van Loon and Van Lanen, 2012; Van Loon et al., 2012).
3.3 Drought onset and termination
The calculation of drought onset and termination is different to that of the calculation of drought duration and deficit volume. For drought onset and termination, we determine the onset and termination day only for the longest drought event in each year, meaning that we neglected droughts in a certain year with shorter duration. This means that the difference between onset day and termination day does not reflect the aforementioned drought duration (Sect. 3.1). One should keep in mind that drought duration and deficit volume were calculated from all drought events occurring in a year.
Figure 5a and b show the average onset and termination day, respectively, obtained from the longest drought event in each year for runoff over the years 1990–2017. In general, Europe can be divided into two regions based on the drought onset. Eastern Europe has earlier drought onsets (spring) than West Europe (summer). However, most of Europe has a similar drought termination day, which is in autumn. This implies that Eastern Europe has more extended drought durations for the longest drought than the West. If we deduct the termination day from the onset day, the most extended drought duration is situated in the same regions as those regions having the lengthiest total drought duration (Fig. 2a).
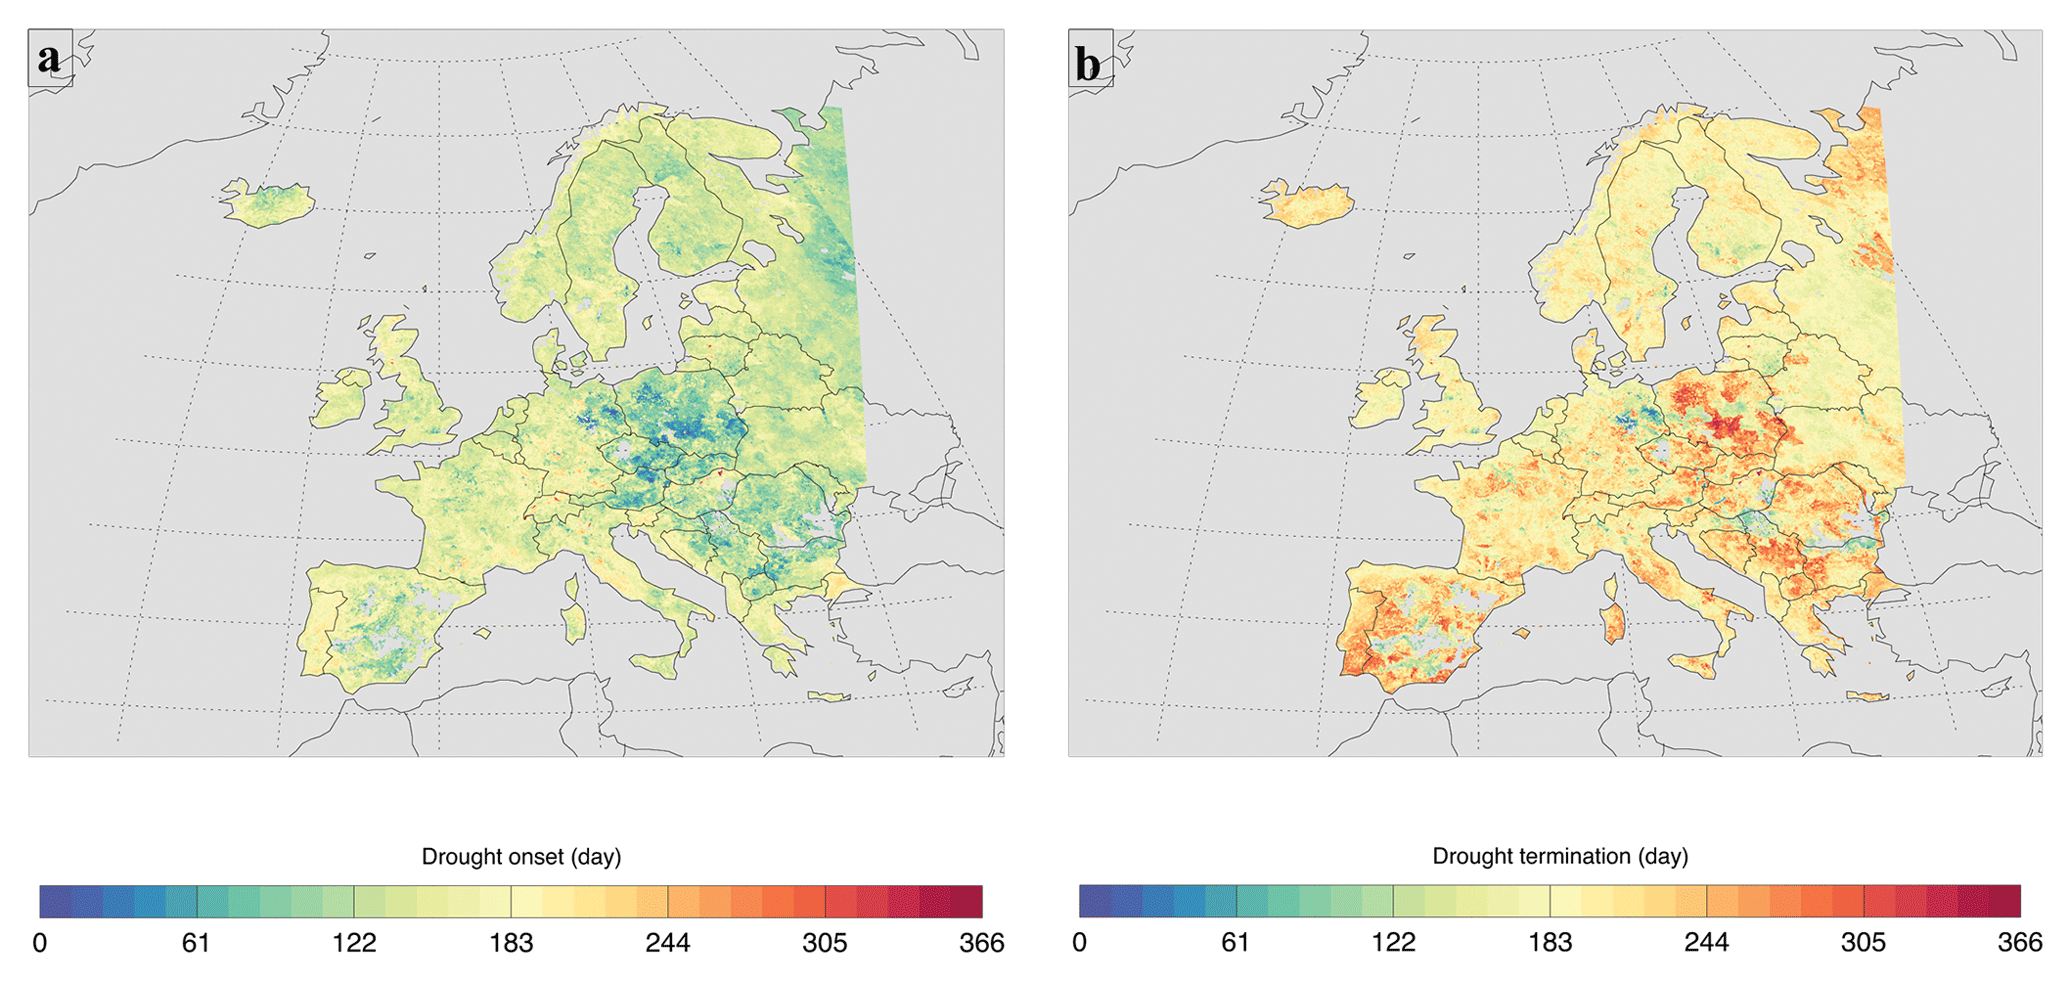
Figure 5Spatial distribution of the average drought onset (a) and termination (b) of the longest drought per year (in drought years) derived from drought in runoff over the period 1990–2017. Non-drought years are excluded.
Compared to runoff, the average onset day of the longest drought in each year for groundwater is earlier with a onset day of 150 (May) for most of European regions and of 60 (February) for Northeast to Southeast European regions (Fig. 6a). However, the average termination day of the longest drought in each year for groundwater is later than for runoff, with day numbers of 210 (July) to 365 (December) (Fig. 6b). Again, if we deduct the termination day from the onset day, the most extended drought duration of the longest drought per year is situated in the same regions as those having the maximum total drought duration (Fig. 2b). However, average drought duration of the longest drought is close to the average total annual drought duration. This indicates that groundwater drought tends to have longer drought durations and a lower number of drought events than drought in runoff.
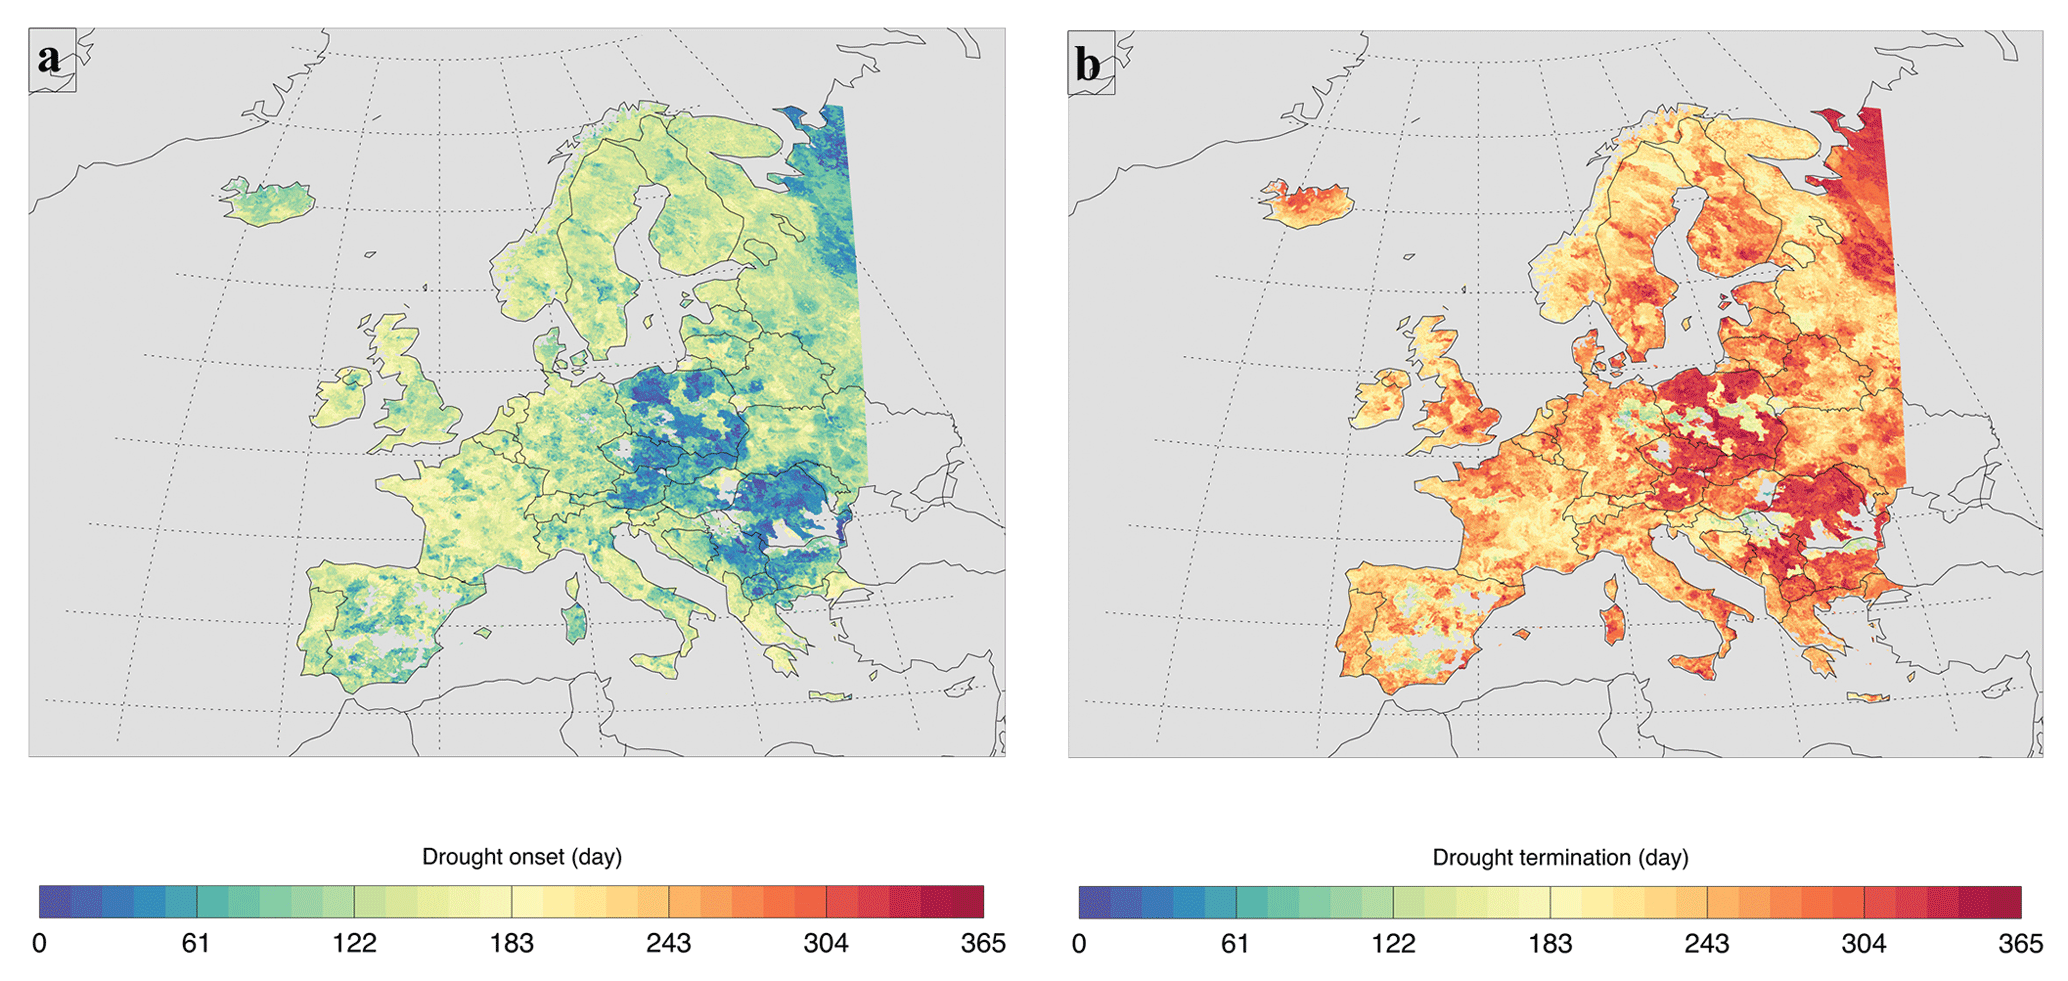
Figure 6Spatial distribution of the average drought onset (a) and termination (b) of the longest drought per year (in drought years) derived from drought in groundwater over the period 1990–2017. Non-drought years are excluded.
3.4 Summary of European hydrological drought characteristics
In the previous sections, we presented spatially-distributed average annual drought characteristics for Europe. In this section, drought characteristics for each year and averaged for the whole Europe are presented. Table 1 shows the spatially-averaged drought duration, deficit volume (only in runoff), onset and termination of the longest drought, and drought intensity in runoff and groundwater. The longest total drought durations occurred in 1992–1993 and 1996 in runoff, and in 1992–1993 and 1995–1997 in groundwater. During these drought years, drought occurred up to 2.5 months in runoff and up to 4 months in groundwater. Slightly lower drought durations were found for the longest single drought event in a year, which were derived from the difference between termination and onset values. Based on this drought analysis using runoff and groundwater data, the 2003 European drought was not categorized as the longest drought event (41 and 92 d in runoff and groundwater, respectively) although it has longer drought durations than the average (37 and 68 d in runoff and groundwater, respectively).
The highest drought deficit volumes for drought in runoff were found in 1992 and 1993, with deficit volumes of 5.5 and 6.5 mm, respectively. In average, the volume loss during drought events is 3 mm.
Table 1Spatially-averaged drought characteristics for each year over the period 1990–2017, which were obtained from drought in runoff (R) and groundwater (GW).
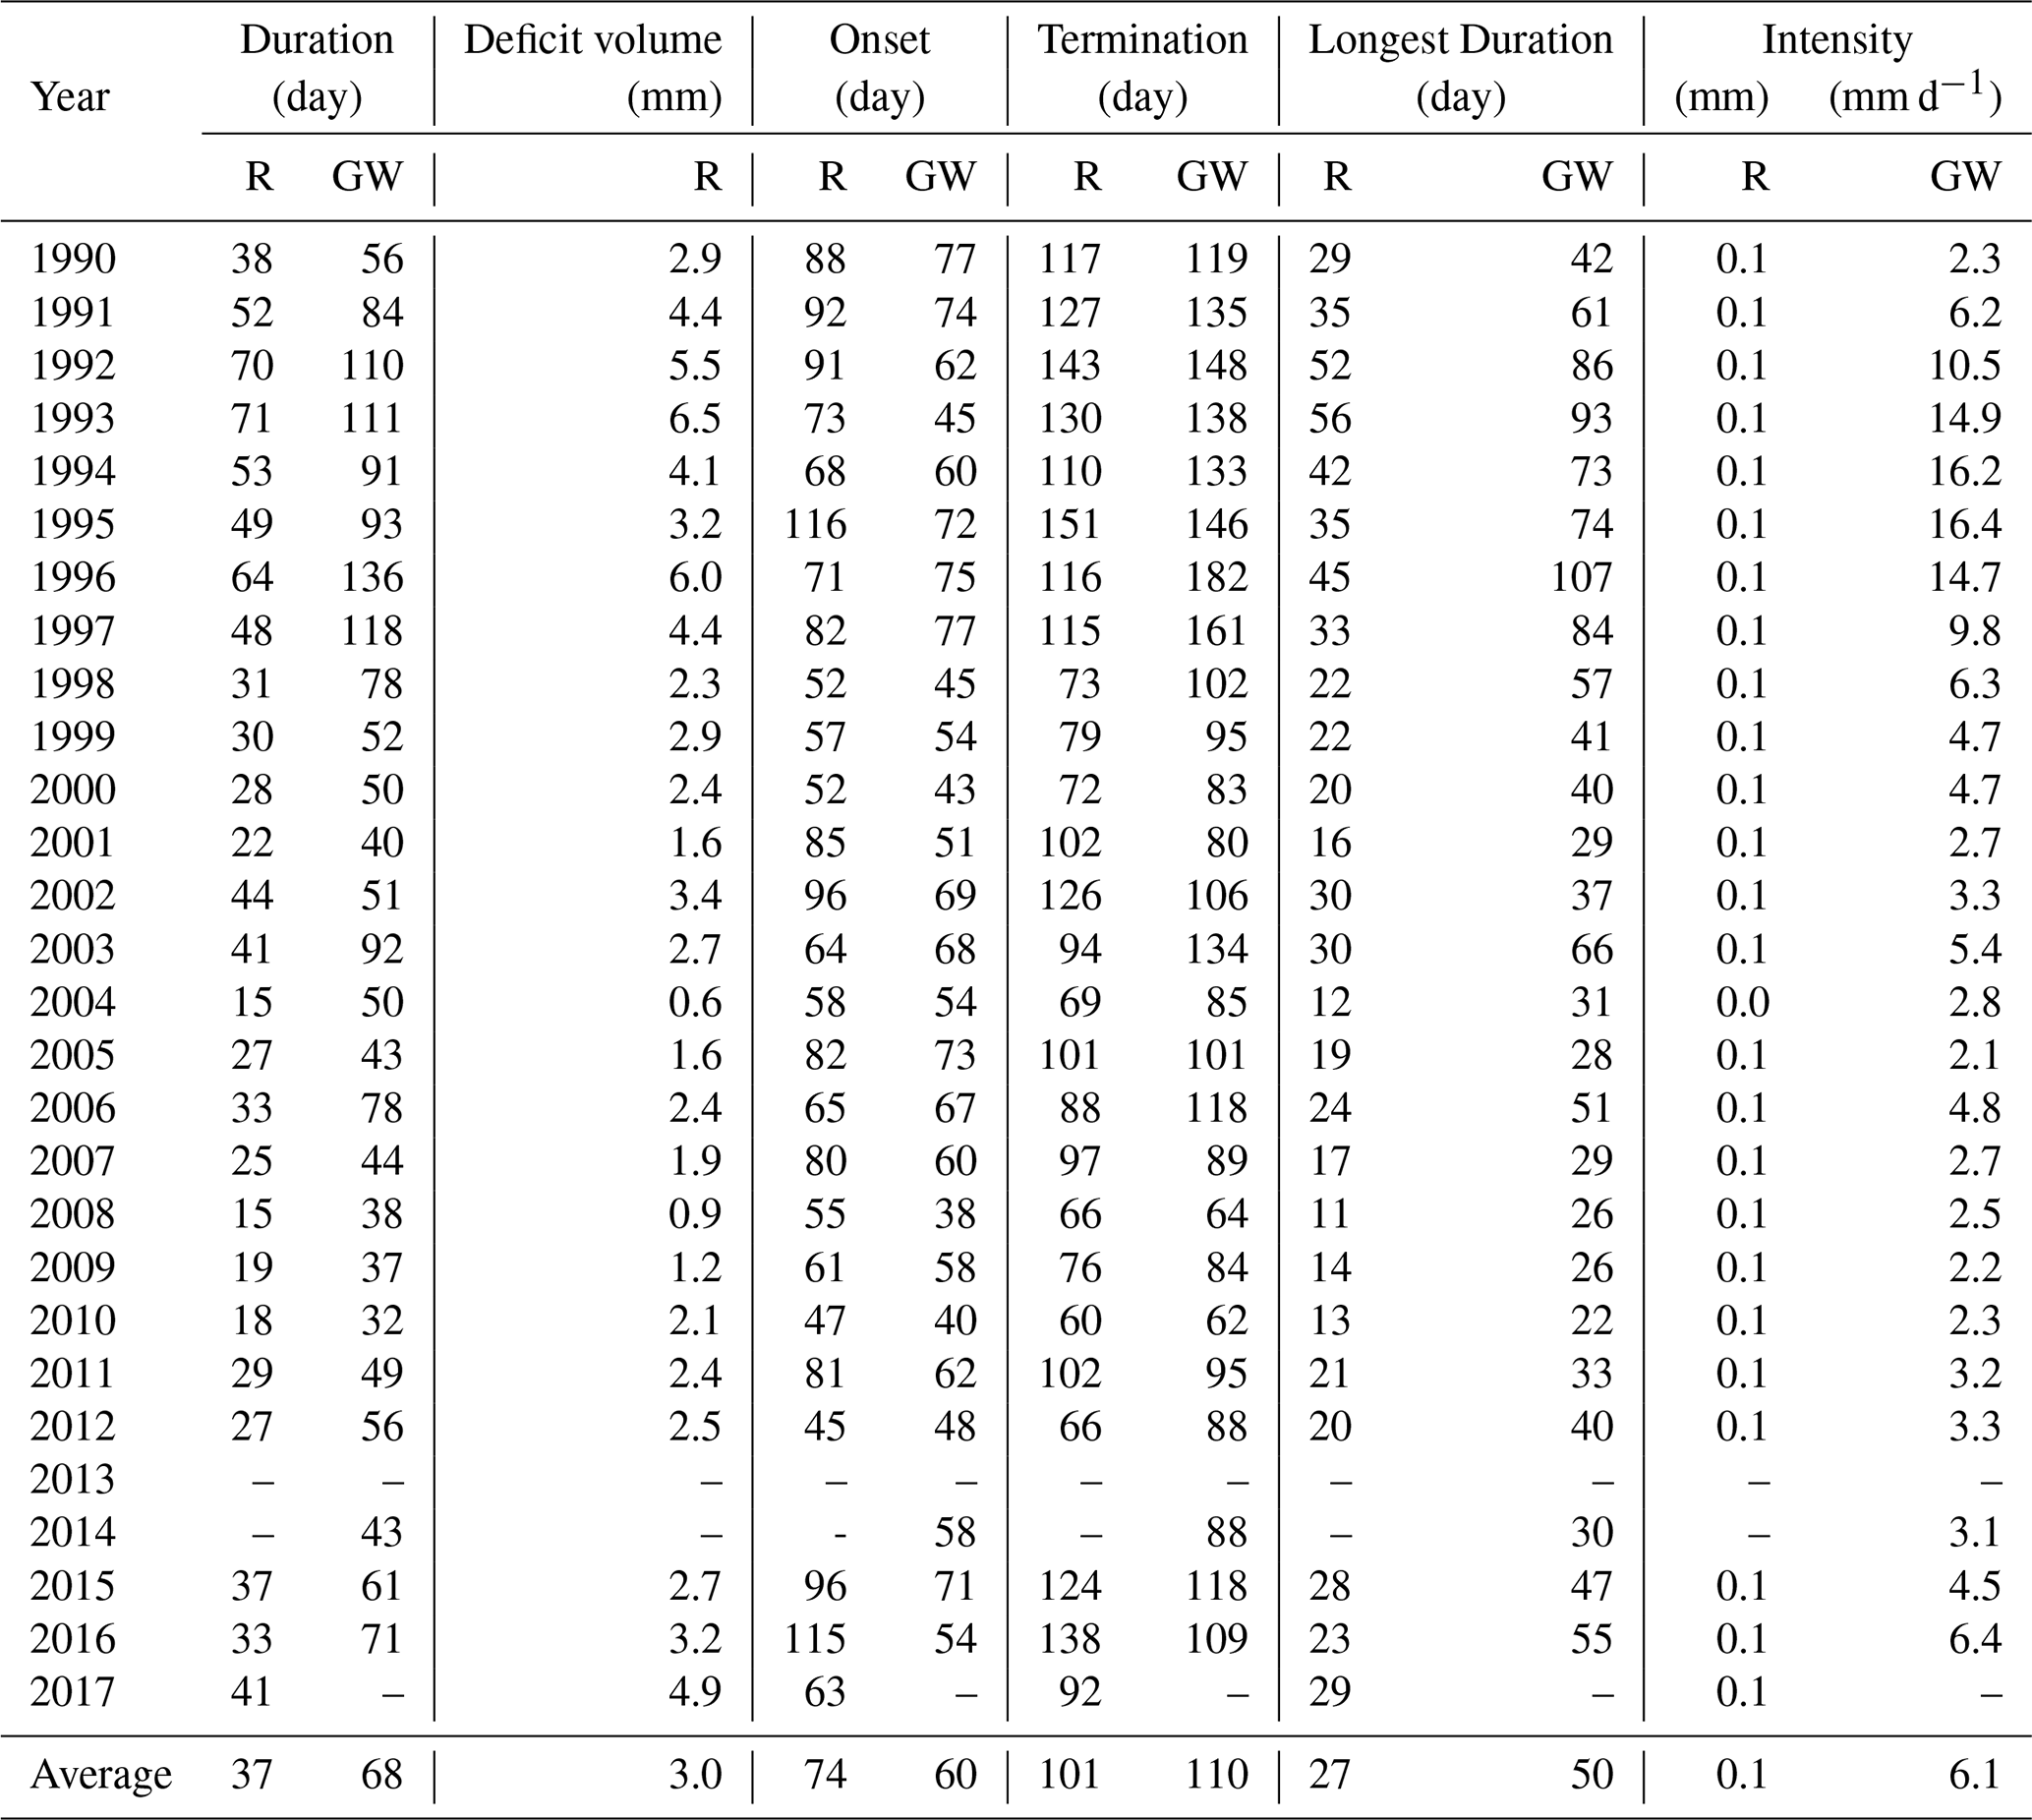
The earliest drought event was in the winter period on day 45 for runoff in 2012 and on day 38 for groundwater in 2008. However in those years, early drought occurrences were also followed by early drought termination. The drought events starting in the winter and terminating in the beginning of spring is likely related to a cold snow season drought (Van Loon and Van Lanen, 2012; Van Loon et al., 2012). These drought events may occur due to cold temperatures below normal during the winter period and thus the groundwater levels drop just below the threshold level due to no recharge from the snowmelt, which normally would happen. This type of drought ends when the snow melts during spring. The longest drought duration in runoff (56 d) started in spring (day 73) and ended in the end of spring (day 130), while the longest drought duration in groundwater (107 d) also started in spring (day 75), but ended in summer (day 182). One should note that the yearly drought onset and termination in this study were averaged for the whole Europe (Table 1). On average, the onset of drought events occurred on day 74 and 60 and terminated on day 101 and 110 for runoff and groundwater, respectively.
The longest drought duration obtained for Europe does not reflect the highest drought intensity. The highest drought intensity in groundwater (16.4 mm d−1) occurred in 1995, while the drought duration was only 93 d. The longest drought duration in groundwater (1996, 136 d) only resulted in a drought intensity of 14.7 mm d−1. Beside averaging all grid cells over the whole Europe, drought characteristics were also calculated by averaging drought characteristic values from 1990 to 2017 (Table 2) for the 10th driest area in Europe (called 10th percentile area). This has been repeated for 25th, median, 75th and 90th percentile areas. At least 10 % of European regions experienced drought with minimum duration of 121 d (4 months) and 251 d (8 months), deficit volume of 8.5 mm, and intensity of 0.1 mm and 16.6 mm d−1 for drought in runoff and groundwater, respectively. However, half of European regions (50th percentile area) only experienced short drought durations. Based on drought onset and termination analyses, 10 % of the European regions (10th percentile area) had drought in the end of summer, which lasted up to the autumn. Early droughts during spring to summer struck a quarter of European area. Table 2 also shows that drought never occurred in almost all European regions (above 75th percentile area) at the same time.
Table 2Drought characteristics based on percentiles areas in Europe (e.g. 10th percentile means the 10 % driest area in Europe).

In this paper, we analysed hydrological drought characteristics across Europe, represented by drought in runoff and groundwater. The results are presented as: (1) spatially-distributed average annual hydrological drought characteristics maps for the period 1990–2017, and (2) summary statistics of hydrological drought characteristics for each year, for 10th, 25th, 50th, 75th and 90th driest areas in Europe. The results show that regions in the eastern part of Europe, starting in Poland and stretching out to Bulgaria, are profound regions to severe drought hazards. These regions, as well as Northwest Russia experienced the longest drought duration and highest deficit volume compared to other regions. Early drought onset and late drought termination were also found in these regions.
Based on summary statistics of drought characteristics, the most severe droughts occurred from 1992 to 1997. The European 2003 drought was considered severe, but it appeared not the most extreme, in term of duration and water deficits. During this period, the groundwater drought lasted up to 4 months. Please keep in mind that this analysis was carried out by averaging over the whole of Europe. In some regions, the drought may last longer than 4 months (see Fig. 2b). Moreover, our driest area analysis also indicated that around 10 % of the European regions experienced groundwater drought for more than 8 months. We need to remark that all analyses in this study were carried out by considering only drought events occurring in the same year. Drought events passing the turn of the year were not considered. This drawbacks our analysis, since drought event may last up to more than one year, i.e. multiple year droughts (Tallaksen and Van Lanen, 2004; Mishra and Singh, 2010; Van Loon, 2015).
Longer drought duration and a lower number of droughts were found in groundwater than in runoff, which proves that slowly responding variables (e.g., groundwater) are better in showing extreme droughts compared to fast responding variables (e.g., precipitation). Small amount of precipitation can alleviate the drought by putting the hydrological variable above the threshold and end the drought, in a fast responding variable. The slowly responding variables are suited to be used for drought early warning system since they have a longer memory due to the influence of catchments storage.
Our study gives an insight in hydrological drought characteristics and is anticipated to provide useful information for water management practices in Europe. It is already used as benchmark for drought forecasting in the EU ANYWHERE project (http://anywhere-h2020.eu/, last access: 1 June 2020). Based on our results, water managers, and also emergency centres, can better prepare for an upcoming drought since they know where the drought prone regions are located, when the drought event may emerge and recover, and what is the average duration of drought. All these information will help water managers in the drought prone regions to foster drought resilience actions.
The runoff and groundwater data were obtained from the ECMWF. All data used in the study can be obtained from the authors (samuel.sutanto@wur.nl).
All authors conceived and implemented the research. Data analyses, model output analyses, and all figures have been performed by SJS.
The authors declare that they have no conflict of interest.
This article is part of the special issue “Hydrological processes and water security in a changing world”. It is a result of the 8th Global FRIEND–Water Conference: Hydrological Processes and Water Security in a Changing World, Beijing, China, 6–9 November 2018.
The research is supported by the ANYWHERE project, which is funded within EU's horizon 2020 research and innovation program (http://anywhere-h2020.eu/, last access: 1 June 2020). This research is part of the Wageningen Institute for Environment and Climate Research (WIMEK-SENSE) and it supports the work of the EURO-FRIEND and Panta Rhei program.
This research has been supported by the European Commission (Horizon 2020 (grant no. 700099)).
Bachmair, S., Tanguy, M., Hannaford, J., and Stahl, K.: How well do meteorological indicators represent agricultural and forest drought across Europe, Environ. Res. Lett., 13, 03042, https://doi.org/10.1088/1748-9326/aaafda, 2018. a
De Roo, A. P. J., Wesseling, C. G., and Van Deursen, W. P. A.: Physically based river basin modelling within a GIS: the LISFLOOD model, Hydrol. Process., 14, 1981–1992, 2000. a
Feyen, L. and Dankers, R.: Impact of global warming on streamflow drought in Europe, J. Geophys. Res., 114, D17116, https://doi.org/10.1029/2008JD011438, 2009. a
Forzieri, G., Feyen, L., Rojas, R., Flörke, M., Wimmer, F., and Bianchi, A.: Ensemble projections of future streamflow droughts in Europe, Hydrol. Earth Syst. Sci., 18, 85–108, https://doi.org/10.5194/hess-18-85-2014, 2014. a
Haslinger, K., Koffler, D., Schöner, W., and Laaha, G.: Exploring the link between meteorological drought and streamflow: effects of climate-catchment interaction, Water Resour. Res., 50, 2468–2487, https://doi.org/10.1002/2013WR015051, 2014. a, b
Heim Jr., R. R.: An overview of weather and climate extremes-products and trends, Weather and Climate Extremes, 10, 1–9, https://doi.org/10.1016/j.wace.2015.11.001, 2015. a
Herring, S. C., Hoerling, M. P., Kossin, J. P., Peterson, T. C., and Stott, P. A.: Explaining extreme events of 2014 from a climate perspective, B. Am. Meteorol. Soc., 96, S1–S172, 2015. a
Hisdal, H., Tallaksen, L. M., Clausen, B., Peters, E., and Gustard, A.: Hydrological Drought Characteristics, in: Tallaksen, L. M. and Van Lanen, H. A. J., Hydrological Drought, Processes and Estimation Methods for Streamflow and Groundwater, Development in Water Science 48, Elsevier Science B.V., 139–198, 2004. a, b
Llyod-Hughes, B. and Saunders, M. A.: A drought climatology for Europe, Int. J. Climatol., 22, 1571–1592, https://doi.org/10.1002/joc.846, 2002. a
Mishra, K. K. and Singh, V. P.: A review of drought concepts, J. Hydrol., 391, 202–216, 2010. a, b, c
Peters, E., Torfs, P. J. J. F., Van Lanen, H. A. J., and Bier, G.: Propagation of drought through groundwater – a new approach using linear reservoir theory, Hydrol. Process., 17, 3023–3040, 2003. a, b, c
Peters, E.: Propagation of drought through groundwater systems. Illustrated in the Pang (UK) and Upper-Guadiana (ES) catchments, PhD thesis, Wageningen University, The Netherlands, 2003.
Spinoni, J., Naumann, G., Vogt, J. V., and Barbosa, P.: Meteorological Droughts in Europe. Events and Impacts Past Trends and Future Projections, Publications Office of the European Union, Luxembourg, EUR 27748 EN, https://doi.org/10.2788/450449, 2016. a
Spinoni, J., Naumann, G., Vogt, J. V., and Barbosa, P.: The biggest drought events in Europe from 1950 to 2012, J. Hydrol. Reg. Stud., 3, 509–524, https://doi.org/10.1016/j.ejrh.2015.01.001, 2015. a
Stagge, J. H., Kingston, D. G., Tallaksen, L. M., and Hannah, D. M.: Observed drought indices show increasing divergence across Europe, Scientific Reports, 7, 14045, https://doi.org/10.1038/s41598-017-14283-2, 2017. a
Stagge, J. H., Tallaksen, L. M., Kohn, I., Stahl, K., and Van Loon, A. F.: European drought reference (EDR) database: design and online implementation, Technical report no.12, Drought R&SPI, FP7 program, 2013. a
Sutanto, S. J., Van Lanen, H. A. J., Wetterhall, F., and Llort, X.: Potential of pan-European seasonal hydro-meteorological drought forecasts obtained from a Multi-Hazard Early Warning System, B. Am. Meteorol. Soc., 101, 368–393, https://doi.org/10.1175/BAMS-D-18-0196.1, 2020. a
Tallaksen, L. M., Hisdal, H., and Van Lanen, H. A. J.: Space-time modelling of catchment scale drought characteristics, J. Hydrol., 375, 363–372, 2009. a
Tallaksen, L. M. and Van Lanen, H. A. J. (Eds.): Hydrological Drought. Processes and Estimation Methods for Streamflow and Groundwater, Developments in Water Science, 48, Elsevier Science B.V., Amsterdam, p. 579, 2004. a, b, c, d
Teuling, A. J., Van Loon, A. F., Seneviratne, S. I., Lehner, I., Aubinet, M., Heinesch, B., Bernhofer, C., Grünwald, T., Prasse, H., and Spank, U.: Evapotranspiration amplifies European summer drought, Geophys. Res. Lett., 40, 2071–2075, https://doi.org/10.1002/grl.50495, 2013. a
Thielen, J., Bartholmes, J., Ramos, M.-H., and de Roo, A.: The European Flood Alert System – Part 1: Concept and development, Hydrol. Earth Syst. Sci., 13, 125–140, https://doi.org/10.5194/hess-13-125-2009, 2009. a
Van Dijk, A. I. J. M., Beck, H. E., Crosbie, R. S., De Jeu, R. A. M., Liu, Y. Y., Podger, G. M., Timbal, M., and Viney, N. R.: The Millennium Drought in southeast Australia (2001–2009): natural and human causes and implications for water resources, ecosystems, economy, and society, Water Resour. Res., 49, 1040–1057, https://doi.org/10.1002/wrcr.20123, 2013. a
Van der Knijff, J. M., Younis, J., and De Roo, A. P. J.: LISFLOOD: a GIS-based distributed model for river basin scale water balance and flood simulation, International Journal of Geographical Information Science, 24, 189–212, https://doi.org/10.1080/13658810802549154, 2010. a
Van der Knijff, J.: LISVAP: Evaporation pre-processor for the LISFLOOD water balance and flood simulation model, EUR 22639 EN/2, 2008. a
Van Lanen, H. A. J., Laaha, G., Kingston, D. G., Gauster, T., Ionita, M., Vidal, J-P., Vlnas, R., Tallaksen, L. M., Stahl, K., Hannaford, J., Delus, C., Fendekova, M., Mediero, L., Prudhomme, C., Rets, E., Romanowicz, R. J., Gailliez, S., Wong, W. K., Adler, M-J., Blauhut, V., Caillouet, L., Chelcea, S., Frolova, N., Gudmundsson, L., Hanel, M., Haslinger, K., Kireeva, M., Osuch, M., Sauquet, E., Stagge, J. H., and Van Loon, A. F.: Hydrology needed to manage droughts: the 2015 European case, Hydrol. Process., 30, 3097–3104, https://doi.org/10.1002/hyp.10838, 2016. a, b
Van Lanen, H. A. J., Wanders, N., Tallaksen, L. M., and Van Loon, A. F.: Hydrological drought across the world: impact of climate and physical catchment structure, Hydrol. Earth Syst. Sci., 17, 1715–1732, https://doi.org/10.5194/hess-17-1715-2013, 2013. a, b, c
Van Lanen, H. A. J. and Tallaksen, L. M.: Hydrological drought, climate variability and change, in: Climate and Water, edited by: Heinonen, M., Proc. of the Third Int. Conf. on Climate and Water, 3–6 September 2007, Helsinki, Finland, 488–493, 2007. a
Van Loon, A. F.: Hydrological drought explained, WIREs Water, 2, 359–392, https://doi.org/10.1002/wat2.1085, 2015. a, b
Van Loon, A. F. and Van Lanen, H. A. J.: A process-based typology of hydrological drought, Hydrol. Earth Syst. Sci., 16, 1915–1946, https://doi.org/10.5194/hess-16-1915-2012, 2012. a, b, c, d, e, f
Van Loon, A. F., Van Huijgevoort, M. H. J., and Van Lanen, H. A. J.: Evaluation of drought propagation in an ensemble mean of large-scale hydrological models, Hydrol. Earth Syst. Sci., 16, 4057–4078, https://doi.org/10.5194/hess-16-4057-2012, 2012. a, b, c
Vidal, J.-P., Martin, E., Franchistéguy, L., Habets, F., Soubeyroux, J.-M., Blanchard, M., and Baillon, M.: Multilevel and multiscale drought reanalysis over France with the Safran-Isba-Modcou hydrometeorological suite, Hydrol. Earth Syst. Sci., 14, 459–478, https://doi.org/10.5194/hess-14-459-2010, 2010. a
Wanders, N., Van Loon, A. F., and Van Lanen, H. A. J.: Frequently used drought indices reflect different drought conditions on global scale, Hydrol. Earth Syst. Sci. Discuss., https://doi.org/10.5194/hess-2017-512, in review, 2017. a
Yevjevich, V.: An objective approach to definition and investigations of continental hydrologic droughts, Hydrology Papers 23, Colorado State University, Fort Collins, USA, 1967. a