the Creative Commons Attribution 4.0 License.
the Creative Commons Attribution 4.0 License.
 | 16 Sep 2020
Urban flood vulnerability mapping of part of the Lagos metropolis
Olusegun Adeaga
Olufemi Taiwo Oyeneye
Olutosin Akinbaloye
Flooding is the most common of all environmental hazards with vast devastating effect due to enormous losses to lives and properties world-wide, annually. Thus, the effect of extreme flooding is dramatic, not only at the individual household level, but in the country as a whole. This study focuses on flood risk assessment based on urban and coastal flood estimation due to the physical peculiarity of the Lagos region and her urbanization characteristics. It involves creating a flood change detection using GIS approach with the aid of a Cellular Automation Framework to simulate flooding in Lagos Metropolitan area, mapping out the flood prone areas and generating a flood vulnerability map for flood management and planning purposes. At twenty minutes intervals the discharge distribution for the different flow regimes (Low, Medium and Extreme) display flow duration between 60–120 min while the time of concentration is attained at 1 h 20 min (80 min).
- Article
(2193 KB) - Full-text XML
- BibTeX
- EndNote


Recurrence of extreme precipitation anomalies resulting in floods is a normal component of natural climate variability. Flood is an overflow of an expanse of water that submerges land and a temporary covering by water of land that is not normally covered by water. In the sense of “flowing water”, the word may also be applied to the inflow of the tides that comes from the overflow of sea, lakes, rivers, canals, sewers or from rainwater (EU, 2007). Floods cause about one third of all deaths, one third of all injuries and one third of all damage from natural disasters (Askew, 1997; Jeb and Aggarwal, 2008). It is the most common of all environmental hazards which regularly claims over 20 000 lives per year and adversely affects around 75 million people world-wide (Smith, 1996). Death and destruction due to flooding therefore continue to be all too common phenomena throughout the world, affecting millions of people annually. Flooding therefore poses as one of the greatest natural risks to sustainable development; reduce the asset base of households, communities and societies through the destruction of standing crops, dwellings, infrastructure, machinery and buildings, quite apart from the tragic loss of life.
Flooding in urban areas is seriously becoming an ecological menace in Nigeria as several coastal areas along the Atlantic ocean, surrounding cities and river valleys are affected by flooding on a yearly basis resulting in land degradation in some other parts of the country (Abbas, 2009; Jeb and Aggarwal, 2008).
The obvious reason for flooding especially in municipalities and coastal areas in Nigeria lies in the wide distribution of river floodplains and low-lying coastal areas and river floodplains, and because these areas have fast become a long standing attractions for human settlement (Ologunorisa and Abawua, 2005). The effect of extreme flooding is dramatic; not only at the individual household level, but in the country as a whole. At least 20 % of the population is at risk from one form of flooding or another (Etuonovbe, 2011). Flooding in various parts of Nigeria have forced millions of people out from their homes, destroyed businesses, polluted water resources and increased the risk of diseases (Adeaga, 2008; Adelekan, 1998).
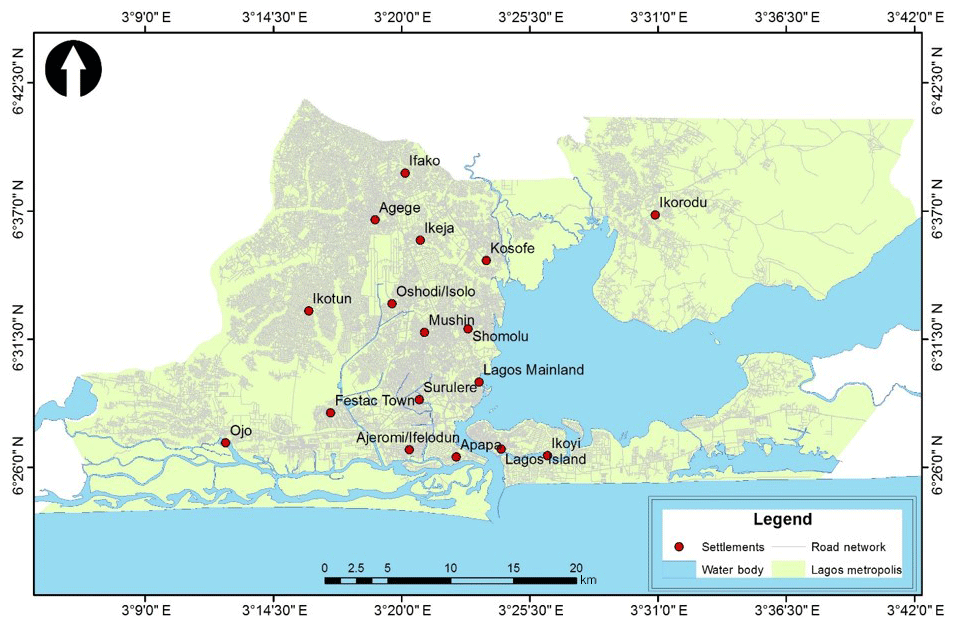
Figure 1Lagos metropolis area. (@ LABCARS, Dept. of Geography, University of Lagos, Nigeria).
Flood occurrence in the Lagos metropolis is a threat to lives and properties and its frequency is increasing, due to her low-lying physical terrain and increasingly urbanization pressure on available marginal lands along the floodplains and congested drainage channels. Severe flooding in Lagos destroys among others large scale, infrastructures with recorded deaths and displacement of thousands. Such displacement usually rendered hundreds homeless and loss of surrounding farmland (IFRC, 2001; Adeaga, 2008; Adeoye et al., 2009). Such losses reduce the asset base of households, communities and societies through the destruction of crops, dwellings, infrastructure, machinery and buildings, quite apart from the tragic loss of life.
Thus, there is therefore the need to provide detailed flood vulnerability map for Lagos mega city, if annual losses attributed to flooding can be effectively addressed.
In recent years, remote sensing and Geographic information systems have been embedded in the evaluation of the geo-environmental hazards. According to Van Westen et al. (2006), the purposes of using remote sensing include: the need “to investigate the susceptibility of the land and the vulnerability of the society, to construct hazard zoning maps and potential damage maps, to monitor potential hazards, and to deal with emergency situations after a disaster. Studies on extensive usage of flood vulnerability mapping using remote sensing data and GIS tools have been extensively used in flood monitoring across globe (Di Martino et al., 2005).
Thus, this study is aimed at creating a flood change detection using GIS approach with the aid of a Cellular Automation Framework. The cellular Automation was used to simulate flooding in the Lagos Metropolitan area towards identification of flood prone areas and flood vulnerability map toward an appropriate Pre-flood preparation and planning processes.
Lagos is located on the South-western part of Nigeria on the narrow Coastal flood plain of the Bight of Benin. The State lies approximately between longitudes 2∘42′ to 3∘42′ E and latitudes 6∘22′ to 6∘52′ N (Fig. 1).
The Southern Boundary of the State is 180 km along Atlantic Coastline, it is bounded in the north and east by Ogun State; the drainage system of the state is characterized by a maze of lagoons and waterways, which constitute about 22 %, or 787 km2 of the State total landmass with the Lagos and Lekki Lagoons, Yewa and Ogun Rivers as major water bodies.The Lagos lagoon is one of several lagoon systems in the West African sub region and most extensive. The lagoon is part of the barrier lagoon coasts of Nigeria. The water is shallow and covers an area of about 208 km2. The lagoon is fed mainly by the rivers of Ogun, Shasha, Oshun, Agboyi and Majidun; the Ogudu creeks and waters of Epe and Lekki lagoons. The Lagoon empties into the Atlantic Ocean via Lagos harbour. The southern margin of the Lagos Lagoon is bounded by the Five Cowrie Creek, the eastern margin by the Palavar Islands and its northern border by Ikorodu. The lagoon is 40–64 km long and has two arms; one connects the Lekki Lagoon while the other leads northward into the hinterland (Allen, 1965). The lagoon is shallow with depths of 1.5–3 m (Ibe, 1988), and made up of muddy and sandy bottom. Its bottom relief is negligible.
The environment of Lagos region is characterized by a tropical climate, with the dominant vegetation of tropical swamp forest, comprising fresh waters and mangrove swamp forests. It has a double rainfall pattern, with two climatic seasons – the dry (November–March) and wet (April–October).
The Lagos metropolis is a densely populated low-lying coastal area, with a dense network of roads and buildings, and a population of over 20 million people (Adeloye and Rustum, 2011). The Lagos metropolis is the biggest city in Nigeria, (although the smallest land area), the second largest city in Africa, and the seventh largest city in the world. The population growth rate in the Lagos metropolis is estimated at 3.2 % (World Bank, 2013). Against this background, the United Nations predicts that Nigeria will be one of the eight countries expected to account collectively for half of the total population increase in the world from 2005 to 2050, and will by 2100, have a population of between 505 million and 1.03 billion (UN, 2004). High population density is a major impasse in the Lagos region, subjecting the area to lack of space for the myriad of human activities, which often manifests itself in muddled human settlements, overcrowding, slum envelopments, pollution, illegal structures, and other social and environmental disorder. These factors, either singularly or in combination, have the potential to increase exposure to hazard, especially the risks associated with urban flooding events.
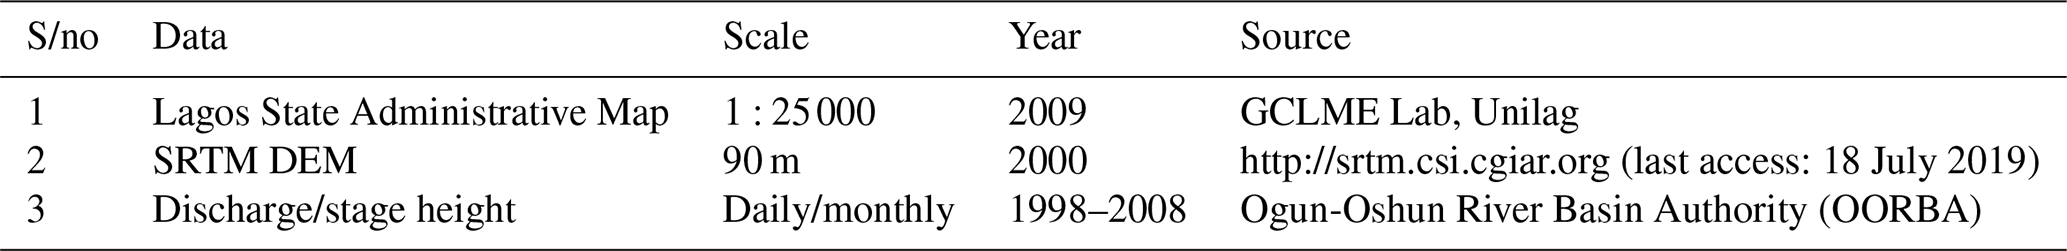
The study methodology is basically based on integration of cellular automation modelling within GIS framework. In the study the basic data used and their characteristic are depicted in Table 1, in addition to the basic data input of the daily discharge, the Shuttle radar Topographical Mission (SRTM) data was converted to Digital elevation model on the GIS platform using the Arc Hydro tool and Raster Edit. This was incorporated with flow in order to simulate flooding and morphological change within the Lagos metropolis.
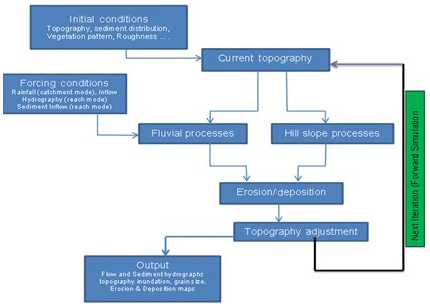
Cellular Automation and Evolutionary Slope and River (CAESAR) model which is a two dimensional flow and sediment transport model was used for the flow simulation. CEASER occupies a unique space in fluvial modelling with capability to simulate timescales that are useful to engineers, researchers of fluvial systems (1–100 years) and to simulate flooding and morphological change of pertinent spatial scales (from 2 km reaches to 400 + km catchments). The cellular framework uses a regular mesh of grid cells to represent the river catchment studied. It is based upon the cellular automaton concept, whereby the repeated iteration of a series of rules on each of these cells determines the behaviour of the whole system (Fig. 2). Some factors or rules exist in CAESAR for a hydrological model, hydraulic model (flow routing), fluvial erosion and deposition, and slope characteristics (Van et al., 2007).
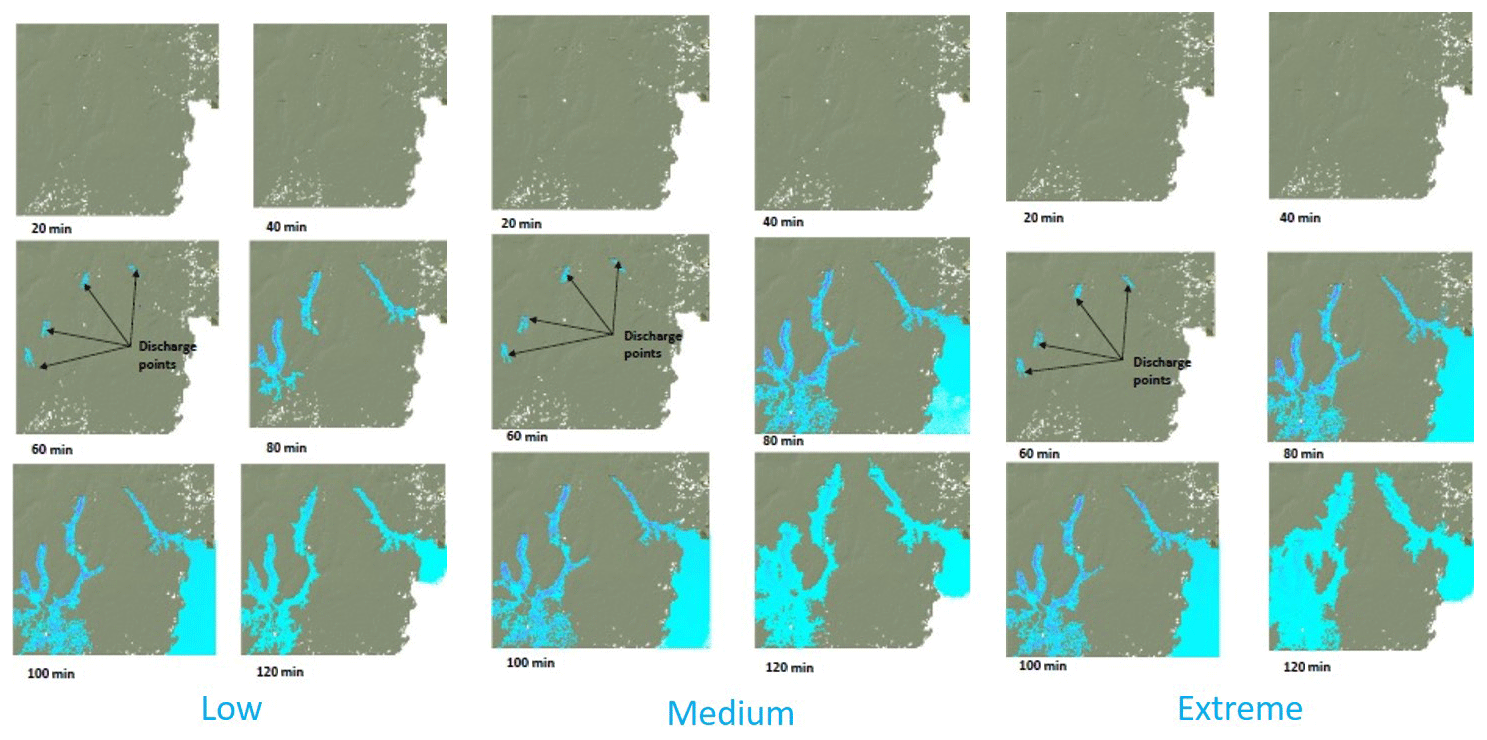
Figure 3Simulated flow for Lagos metropolis.
In simulation mode, each grid cell is assigned initial values for elevation, water discharge, water depth, and drainage area and grain size fractions. An initial state (time t=0) is selected by assigning a state for each cell and for each cell, a set of cells called its neighborhood is defined relative to the specified cell. For each time-step or iteration, these values are updated in relation to the immediate neighbours according to laws applied to every cell. A new generation is created (advancing t by 1), according to fixed rule (generally, a mathematical function) that determines the new state of each cell in terms of the current state of the cell and the states of the cells in its neighborhood. Typically, the rule for updating the state of cells is the same for each cell and does not change over time, and is applied to the whole grid simultaneously, though exceptions are known, such as the stochastic cellular automaton and asynchronous cellular automaton.
For the simulation, four identified head water points along the channels are Point 1 – (Column 208, Row 44); Point 2 – (Column 129, Ro 60); Point 3 – (Column 56, Row 142) and Point 4 – (Column 21, Row 190) were used (Fig. 3). The input data time step is set to 1440 min at a 42 years, hourly water discharge in daily time steps. The quantity of sediment re-circulated been controlled by proportion re-circulated at a set parameter of 0.5, to re-circulate 50 % of the sediment at the 5000 iterations for simulated low, medium and extreme channel water discharge (flow).
Simulated flow within the channel from the selected head water points shows the discharge distribution at twenty minutes intervals for the different flow regimes (Fig. 3).
For the simulation discharge duration runs between 60–120 min and flow time of initial concentration is attained at 1 h 20 min (80 min) and at peak at 120 min before receeding. Discharge at varied flow regime depicts 27.78, 138.89 and 277.78 m3 s−1 for low (normal), medium and extreme flow events, respectively.
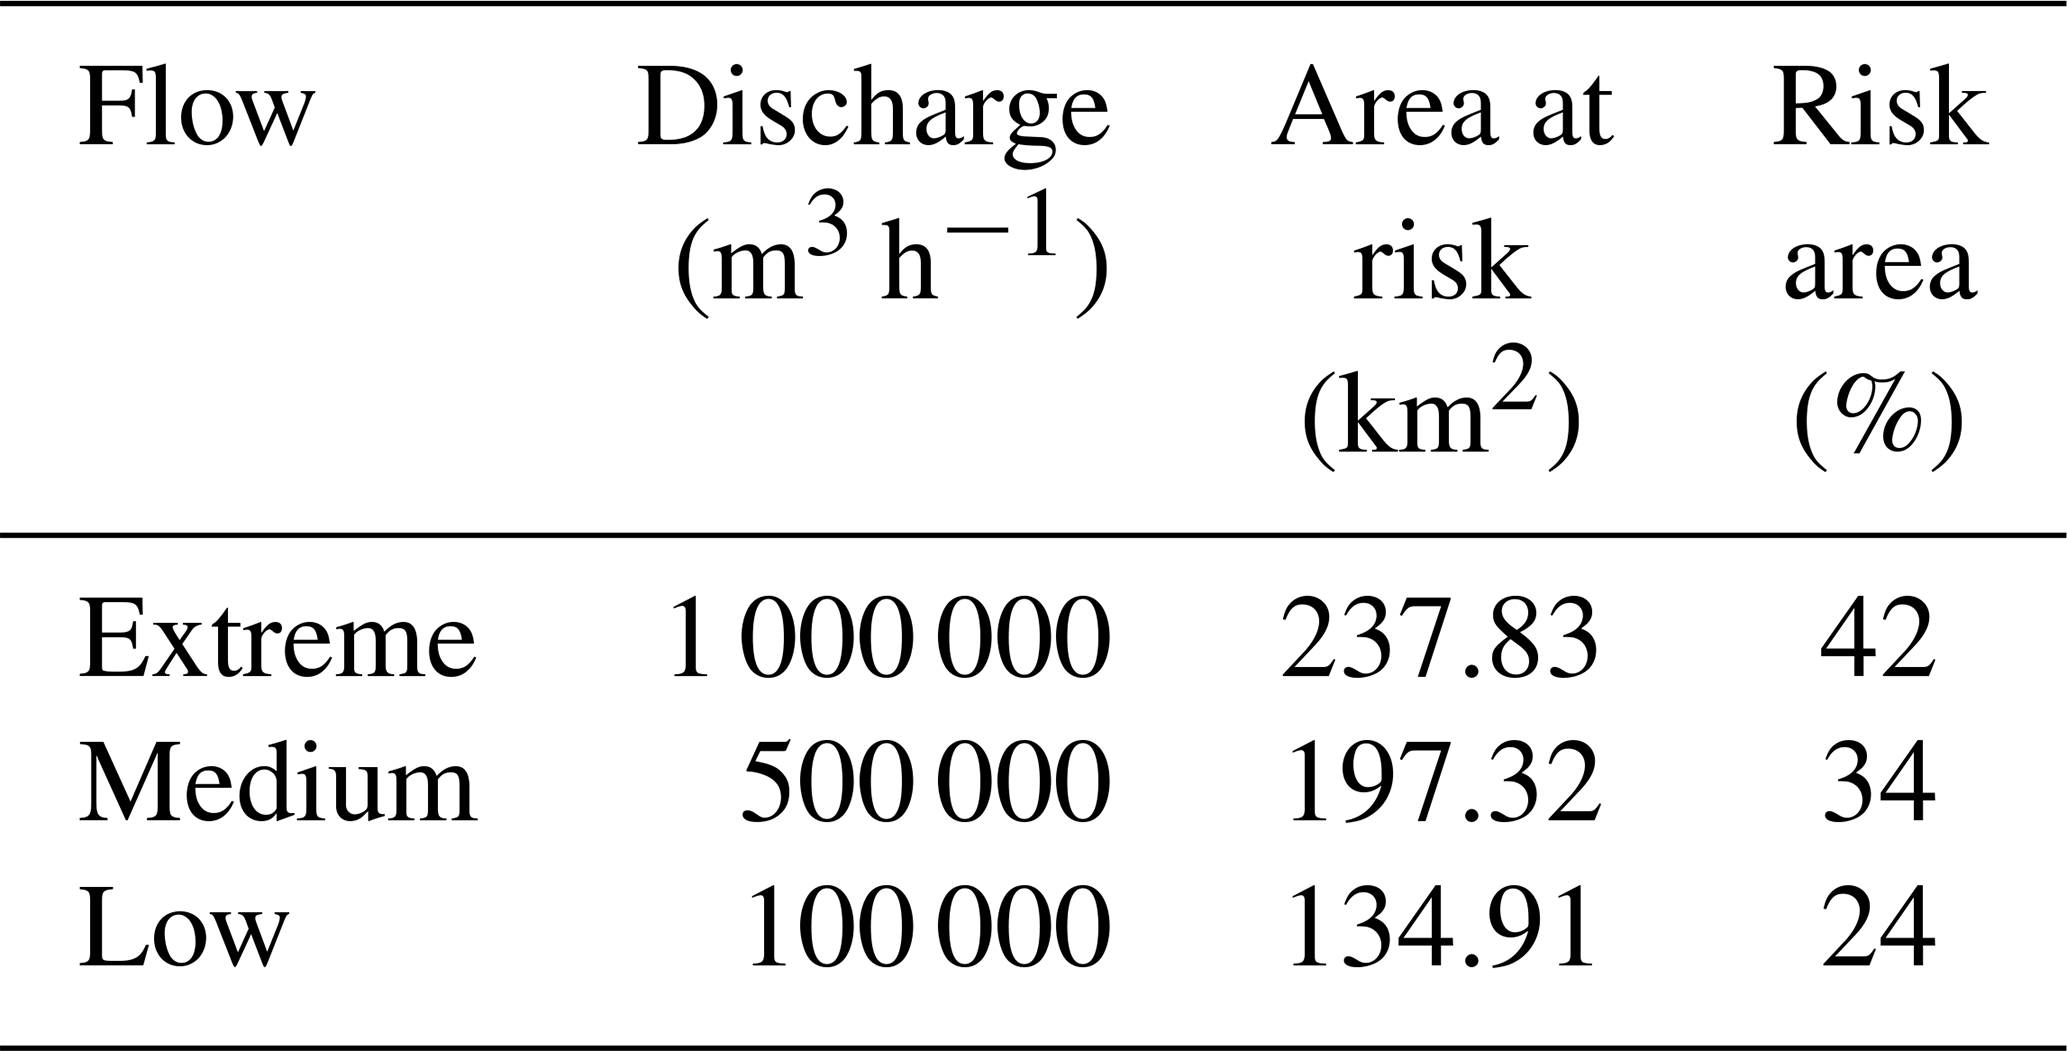
Simulation for the four different discharges at discharge rate of 100 000, 500 000 and 1 000 000 m3 h−1, show that the flows is contained within the channel banks at low discharge while inundation of the immediate adjacent floodplain area occurs during the medium-discharge flows and inundation of the entire floodplain is attained at extreme-discharge (Fig. 4).
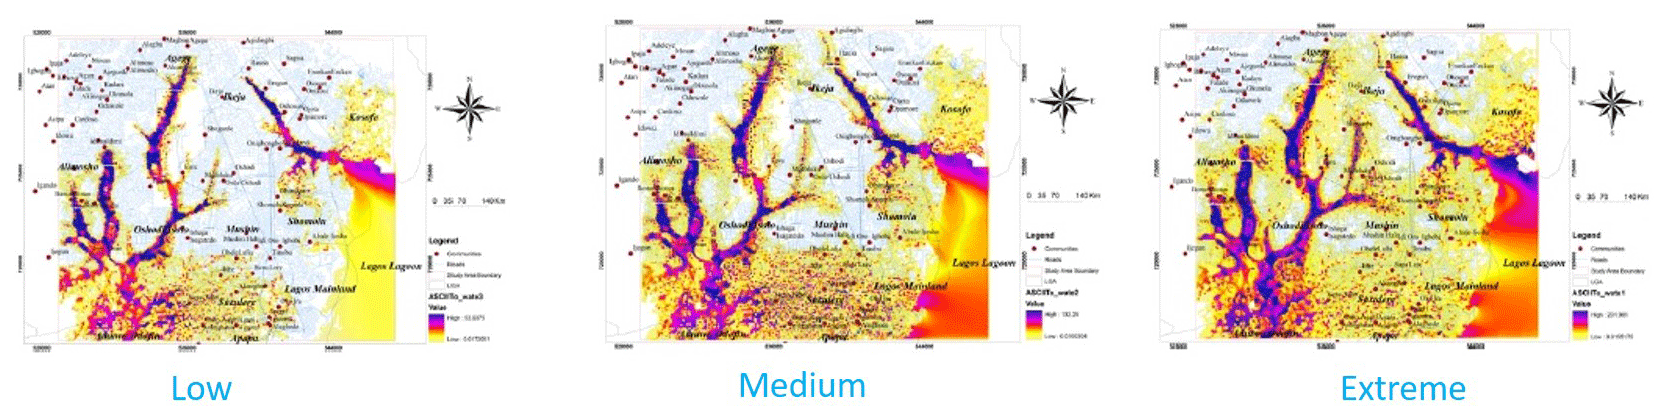
Figure 4Flood vulnerability of Lagos metropolis.
Areas liable to flood as depicted by the vulnerability map for the Lagos metropolis for the different discharge/flow regimes shows that Apapa, parts of Kosofe are flooded at the normal flood extent, as a result of the low elevation level and proximity to identified water body identified (Atlantic Ocean and Lagos Lagoonal System) while the extended flows at the extreme extent regime towards the upper part to places like Ikeja, Shomolu, Surulere, Mushin and Lagos Mainland, which were not flooded at normal flood extent, are due to the increased discharges within the channel. Overbank flooding is more extensive on the southern side of the channel in this reach, due to the raised terrain of the alluvial fan to the south.
Floodplain topography also controls the pattern and depth of inundation; low lying areas are more likely to be flooded due to their nearness to the river channel and low topography. It is clear that an increased discharge has more areas flooded and the reverse is the case for the effect of the discharge when the water is less.
Estimation of total area at risk shows the flooded area of the study area. It shows the greatest percentage (42 %) is attained during the extreme flood extent due to a high discharge while the lowest percentage (24 %) occurs at low discharge (Table 2). Although these results may appear trivial, they represent notable improvements for cellular automaton flow algorithms – particularly, the ability to route flow through a high-resolution meandering channel.
GIS technology provides a wide range of vantage in the generation of the flood vulnerability maps because the output from various platforms were embedded into the GIS environment from which all the various flood regimes and vulnerability scenarios were produced. The CAESAR model approach is relatively simple and has the ability to address some of the shortcomings of other types of numerical model due to its proper flow routing scheme, channel dynamics that easily be accounted for, with the relevant prediction of inundation patterns, and water depths at different scenarios.
It is recommended that effective flood planning and management in Lagos metropolis should entail realistic early flood warnings services, constant monitoring of waterways and drainage pathway and provision of appropriate flood vulnerability map at varied scale (local – state level) for every planning and decision-making purpose while an appropriate adaptable plan should be adhered to.
Please note that the sole proprietors of dataset are their respective sources. They are third parties (secondary data) and can be requested or accessed through the various organizations website and address.
OAd is involved in the study conception and design as well as data analysis, interpretation, drafting of manuscript and critical review. OTO partook in the acquisition of data, data analysis and interpretation. OAk engaged in data Analysis, interpretation of data as well as manuscript writing.
The authors declare that they have no conflict of interest.
This article is part of the special issue “Hydrological processes and water security in a changing world”. It is a result of the 8th Global FRIEND–Water Conference: Hydrological Processes and Water Security in a Changing World, Beijing, China, 6–9 November 2018.
We would like to thank the Hydrological team and Laboratory for Cartography and Remote Sensing; Department of Geography University of Lagos, Nigeria.
Abbas, I. I.: Use of Satellite Remote Sensing and Geographic Information Systems to Monitor Land Degradation along Ondo Coastal Zone, Nigeria, J. Geogr. Environ. Plan., 5, 26–35, 2009.
Adeaga, O.: Flood hazard mapping and risk management in part of Lagos N. E., in: GSDI 10 Conference Proceedings, St. Augustine, Trinidad, available at: http://www.gsdi.org/gsdiconf/gsdi10/papers/TS13.3paper.pdf (last access: 20 July 2019), 2008.
Adelekan, I. O.: Spatio-temporal variations in thunderstorm rainfall over Nigeria, Int. J. Climatol., 18, 1273–1284, 1998.
Adeloye, A. J. and Rustum, R.: Lagos (Nigeria) flooding and influence of urban planning, Proc. Inst. Civ. Eng., 164, 175–187, 2011.
Adeoye, N. O., Ayanlade, A., and Babatimehin, O.: Climate change and menace of floods in Nigerian cities: Socio-economic implications, Adv. Nat. Appl. Sci., 3, 369–377, 2009.
Allen, J. R.: Late Quaternary of the Niger Delta, and Adjacent Areas: Sedimentary Environments and Lithofacies, Bull. Am. Petrol. Geol., 49, 547–600, 1965.
Askew, A. J.: Water in the International Decade for Natural Disaster Reduction, in: Destructive Water: Water-caused Natural Disasters, their Abatement and Control, edited by: Leavesley, G. H., Lins, H. F., Nobilis, F., Parker, R. S., and Schneider, V. R., IAHS, Publ. No. 239, International Association of Hydrological Sciences, IAHS Press, Institute of Hydrology, Wallingford, Oxfordshire, 1997.
Di Martino G., Iodice, A., Pasera, M., Riccio, D., and Ruello, G.: Sensing for Developing countries: Landsat data and GIS, Naples: Ingegneria senza frontier, Napoli, 2005.
Etuonovbe, A. K.: Devastating Effect of Flooding in Nigeria, in: FIG Working Week 2011 Bridging the Gap between Cultures Marrakech, 18–22 May 2011, Morocco, 2011.
EU – European Union: Floods directive, available at: http://ec.europa.eu/environment/water/flood_risk/index.htm (last access: 18 July 2019), 2007.
Ibe, A. C.: Coastline Erosion in Nigeria, Ibadan University Press, Ibadan, Nigeria, 1988.
IFRC – International federation of Red Cross and Red Crescent society: World Disaster Report: Focus on recovery, available at: http://www.ifrc.org/Global/Publications/disasters/WDR/21400_WDR2001.pdf (last access: 20 July 2019), 2001.
Jeb, D. N. and Aggarwal, S. P.: Flood Inundation Hazard Modeling of the River Kaduna Using Remote Sensing and Geographic Information Systems, J. Appl. Sci. Res., 4, 1822–1833, 2008.
Ologunorisa, T. E. and Abawua, M. J.: Flood risk assessment: a review, J. Appl. Sci. Environ. Manage., 9, 57–63, 2005.
Smith, K.: Environmental Hazards, Routledge, London, 1996.
UN – United Nations: World Population to 2300, United Nations, Department of Economic and Social Affairs, Population Division, New York, 2004.
Van, T. P. D., Carling, P. A., Coulthard, T. J., and Atkinson, P. M.: Cellular Automata Approach for Flood Forecasting in a Bifurcation River System, Inst. Geophys., Polish Academy of Science, Warszawa, Poland, 2007.
Van Westen, C. J., Van Asch, T. W. J., and Soeters, R.: Landslide hazard and risk zonation – why is it still so difficult?, Bull. Eng. Geol. Environ., 65, 167–184, https://doi.org/10.1007/s10064-005-0023-0, 2006.
World Bank: World Bank Population Growth Rate 2009–2013, available at: http://data.worldbank.org/indicator/SP.POP.GROW (last access: 10 March 2019), 2013.