the Creative Commons Attribution 4.0 License.
the Creative Commons Attribution 4.0 License.
 | 16 Sep 2020
Analysis of the specific water level of flood control and the threshold value of rainfall warning for small and medium rivers
Yuzhong Hu
Zhaoxia Wang
Bin Zhou
Shiqi Jiang
In order to fully use the newly-built hydrologic stations in small and medium rivers for flood warning and prevention, based on the technical line of the investigation and evaluation of flash flood disasters, different historical flood information of the warning river section was investigated, while the elevations of riverain houses were measured. The relationship between the stations and affected population has been established for the study region. According to integrated flood control capability of riverside residents, the characteristic water levers and rainfall threshold values were determined in this case. The results indicate that the warning and safety levels are 54.0 and 55.3 m, respectively. The analysis results show that the warning should be issued when the net rainfall intensity is 70 mm h−1 or 110 mm for 6 h condition. And considering the effectiveness of disaster avoidance, variable characteristic water levers of the hydrologic station for flood warning in different village were determined on the basis of the flood control capability of each village. The relationship between hydrologic numerical value and inundating influence was established in a one-to-n way.
- Article
(5133 KB) - Full-text XML
- BibTeX
- EndNote


Since the Construction of small and medium-sized rivers hydrology monitoring system, density of hydrological monitoring sites was improved evidently. However, there are two shortcomings that make real-time hydrological elements playing a limited role in flood hazard mitigation. Firstly, there is no historical data in the new hydrological stations, and the historical ranking comparison cannot be realized (Yao et al., 2014). No matter the rainfall or water level, the severity cannot be known according to the value. Secondly, there is no characteristic water level. The correlation between site elements and early warning objects is lacking. There is no connection between water level and flood impact, and it cannot play an effective early warning role. If these two problems cannot be solved, the new hydrological stations are useless for flood prevention. From 2016, Chinese Office of State Flood Control and Drought Relief Headquarters and Waterway Bureau of Water Resources began to promote the analysis of the characteristic water level of small and medium-sized rivers. The paper takes the new hydrological station in the central district of Shitai county in the southern Anhui province as an example with technical route which called “The research and application of investigation and evaluation on mountain torrent disaster as well as early warning key technology” (Hu et al., 2016), through the survey of historical flood and elevation of the houses along the banks of the river (MWR, 2015). Then it evaluates the flood protection capacity of the early warning object and establishes the link between hydrologic and social economic factors, to determine the rainfall warning threshold and characteristics of water level.
Shitai county is located in the northwest of the southern Anhui mountains which belongs to qiupu watershed of a tributary of Changjiang River. The qiupu watershed has the history of frequent floods and waterlogging disasters. Typical floods include the flood of 14 July 1991, the flood of 28 May 1995, the flood of 19 June 1996 and the flood of 26 June 1998. Shitai county was flooded six times in 1996, and the water depth of urban area was as deep as 6 m, and the water depth of urban area was as deep as 7 m in 1998. After real-time flood control engineering, during the flood of 21 June 2002, the flood of 10 July 2007, the flood of 24 July 2015, the flood of 3 July 2016, the flood of 24 June 2017, Shitai county in addition to the scope of protection of the flood control works from submerged, while other areas were still affected by flooding for many times, and often repeated many times within a year. It is a typical area where mountain torrent disasters take place frequently. So it is necessary to constructe the non-engineering measures of flood protection. Since the Construction of small and medium-sized rivers hydrology monitoring system, hydrological bureau of anhui provincial has set up a gauging station here with an area of 818 km2 above the hydrological station since 2016.
3.1 General idea
There are three conditions needing to be met for the construction of the early-warning index system for flood hazard mitigation of small and medium-sized rivers: firstly, setting the warning range (river section); secondly, mastering the influence of historical flood and the existing defense capability of early warning objects (population concentration areas); finally, establishing the relationship between the early warning source (hydrological station) and the early warning object (person), and determining the early warning index system according to the defensive ability. Generally speaking, it means to know yesterday (historical flood), evaluate today (present defense capability), and lock in tomorrow (earlywarning indicator system), the core is human security. Therefore, the specific implementation path is “taking villages (market towns) as the object, household registration as the unit, and people as the center”, then establish the relationship between the early warning object which includes changes in the height of houses and the hydrological elements of the river. According to business logic, there are three stages:
-
The first stage is establishing the evaluation system of hydrological factors and flood affected population through investigation and analysis. This stage is carried out in accordance with “two main lines and integration”. Main line 1 is obtaining the surface line of the historical typical flood in the river section associated with the early warning object through investigation. It also integrates the housing foundation elevation and housing registered population of the residential group along the river, and estimates the impact of typical flood to identify the affected houses by the flood depth and relates the registered population with the houses. Then according to the assumption which means different scale of the flood water surface slope is same, it is got that flood effects of different grade flood with translating the water line, and gathers the flood affected population and water level which on the representative cross section of the matching flood water line, to establish the relationship line between water level and flooded affected population. Main line 2 is establishing the relationship between water level and flow. This part of the content is directly referred to the hydrological data compilation specifications. It needs to be emphasized that in addition to the actual measurement, it also needs to make up for the insufficient variation of the measured relationship between water level and flow through the hydrological survey. The relationship between water level and flow was established by obtaining the factors of gradient, vertical and cross section, bed roughness and other related factors. “Regression and integration” refers to the water level of the representative section as the cohesive factor, that is, water level takes the same section value among the relationship flood affects population, water level and flow. Build the core foundation called “Flow- Water Level- Flood Affects Population” “Two Coaxial Line”, which determine the disaster water level and disaster flow, as the basis of flood impact assessment and early warning index system analysis.
-
The second stage is assessing the risk level (recurrence period) of the disaster flow corresponding to the disaster water level of the early-warning object by calculating the design flood, and according to the disaster water level, the flow, as well as the regularity of flood rising of the dependent land, the alarm and the guarantee water level are recommended.
-
The third stage is determining the distribution of rainstorm schedule and calculating the various characteristics time of critical rainfall (net rainfall threshold) by disaster flow and the calculation method of design flood, that is, how long and how much net rain intensity will be disaster. At the same time, according to the recurrence period of the disaster flow, the same frequency of rainstorm and flood is assumed, the rainfall threshold values of different periods in the same period as the recurrence period of the disaster flow are obtained, so as to establish the rainfall warning index system.
3.2 Core technology
3.2.1 Determination of relationship between water level and population
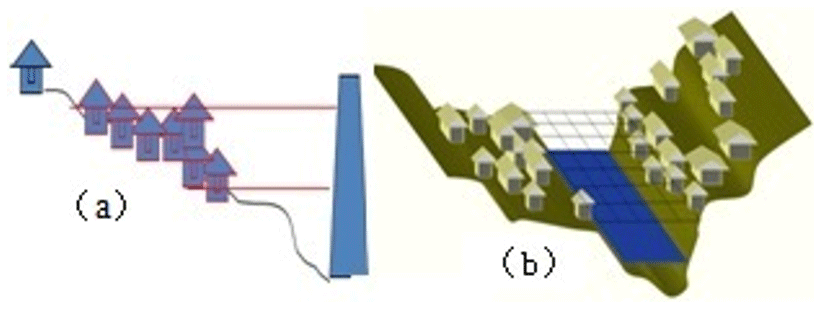
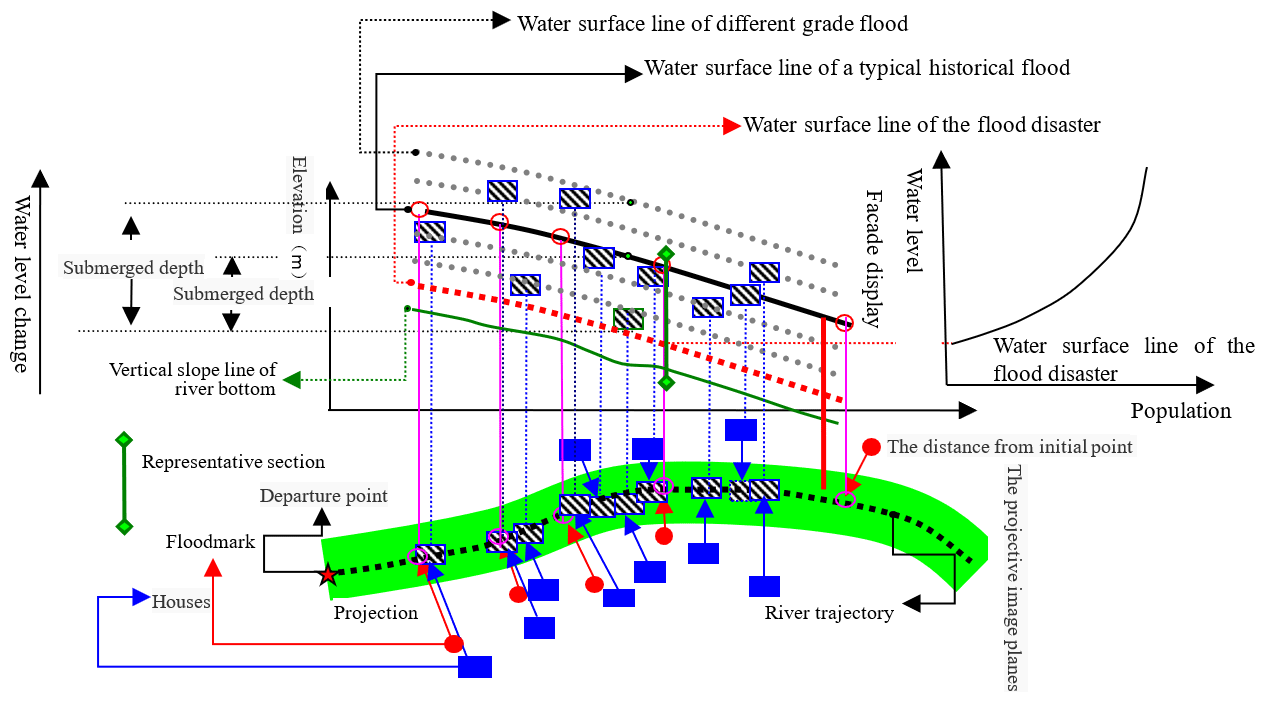
In the technical link of investigation, evaluation and early warning, the most important thing is how to establish the connection between flood and population, which is not only the technical difficulty, but also the core of disaster prevention and early warning. Especially in mountainous area, channel slope and fall head of water surface of warning channel is big, not like a lake, reservoir, whose relationship elevation- population and water level- population are the same, as shown in Fig. 1a, but needs to provide an algorithm that can change the waterline along the river into the surface of water slope, in order to determine both longitudinal and lateral variation of the building elevation layout and water slope height relations, as shown in Fig. 1b. The author put forward the idea “locking rivers trajectory, calculating origin, appointing representative section and flood mark, building the shortest distance double object plane projection” through the method “Relationship and assessment between non-static water level of mountains and population affected by flooded” (Hu, 2016a), to set up the business logic of the recognition system named “The ternary homologous” of the flood waterline of warning river, vertical slope line of river, housing base elevation, as shown in Fig. 2, the specific operation is divided into four steps:
-
Step 1: according to the measurement results of the longitudinal section of the river segment associated with the early-warning objects (including elevation and coordinate), the river trajectory line can be drawn and the upstream starting point is marked as the origin.
-
Step 2: the investigation of the flood marks is projected onto the river track according to their coordinates, the starting distance of the flood mark projection point relative to the origin was extracted from the river track line, match the water level of the flood mark point and establish the coordinate system of water level change along the course.
-
Step 3: the house is also projected onto the river track according to its coordinates, the starting distance of the projection point of the house on the track line of the river was obtained, match the building base elevation, it is incorporated into the coordinate system of water level change along the path. The relationship between the water line and the house flood is realized, property of housing registered population is extracted, population affected by subsurface inundation is calculated.
-
Step 4: different flood populations can be obtained by assuming different water surface lines (flood of different orders of magnitude). The relationship between water level and flood affected population can be established by determining the water level on the representative section of a flood water surface line of different orders of magnitude.
In the figure, the water surface line is the line when the first household is affected by disaster, and the water level of the disaster water surface line on the representative section is the disaster water level, and its corresponding flow is the disaster water flow.
3.2.2 Critical rainfall threshold analysis method
The analysis methods of rainfall threshold have three types: back extrapolation, same frequency and event statistics. This paper mainly introduces the back extrapolation and the same frequency.
The calculation of rainfall threshold by back extrapolation is based on the inverse calculation of the disaster flow to the catchment flow, under the condition of known confluence parameters, three undetermined elements are also involved. The first is the amount of precipitation, the second is the time distribution of precipitation, and the third is the soil moisture in the early stage (Yao et al., 2019). Under the combination of three uncertain factors, in order to form the same peak value, the solutions will be infinite, which is equal to “no solution”. To solve the problem in the absence of solution, conditions must be set. The solution is that the early effects can be solved by the flow generation, that is, the formation of net rain. The remaining is net rainfall and its distribution of the schedule problem. It still has various combination. To have a solution, the schedule distribution needs to be set, and then according to the distribution of rain type characteristics of a given period of time to set the value of rainfall, calculate the concentration flow. If the peak value of the flood process is less than the disaster flow, the set rainfall value should be increased. Otherwise, decrease it until the calculated peak value is equal to the disaster flow rate, which is the threshold value of the characteristic time period. In this topic, the distribution of rainfall schedule chooses the results of designed rainstorm schedule distribution or the formula of rainstorm attenuation index, as shown in Eq. (1):
where n is Rainstorm attenuation index, ; Ht,p is the amount of rain that lasts for t and frequency p.
Special attention, it is not feasible to directly calculate the rainfall in the 24 h period and then extract the rainfall in different periods as the threshold value. It is a trial run at different times. In conclusion, if the calculation of preproduction flow and the limitation of precipitation process distribution are given, the solution can be obtained by deducting the net rain threshold, as shown in Fig. 3.

Figure 4Distribution diagram of Shitai mountain flood impact survey and measurement (map data © MapWorld Anhui, http://anhui.tianditu.gov.cn, last access: August 2020).
The same frequency is based on the assumption of the same frequency of rainstorm and flood, only fits in the small watershed. It determined the disaster flow by investigation stage, according to design way to determine return period of disaster flow, then analysis the different periods and frequency of precipitation based on design storm statistical results. It is important to note that this method is in accordance with the basin theory. If time session is greater than or equal to basin confluence, the same frequency achievement is valid, otherwise rainfall results in the same frequency characteristic period will be smaller. The advantage of this method is that the calculated threshold is gross rainfall omitting the calculation of production flow, which can be directly used for early warning.
4.1 Measurement area layout
In order to accurately and effectively reflect the correlation between hydrological factors and urban flood control ability, hydrology bureau of Anhui province organized and carried out an urban mountain flood impact survey in shitai county according to the above technical route (Hu, 2015). Hydrology bureau collected the flood mark of 1998, 2016 and 2017 along the river, surveyed the residence building foundation elevation along the both side of river, formed the survey measurement area including three parts area, as shown in Fig. 4. A total of 36 large sections and 43 historical flood marks were measured in the survey area. In particular, the flood marks of 2016 and 2017 were marked immediately after the flood, and the results are reliable.
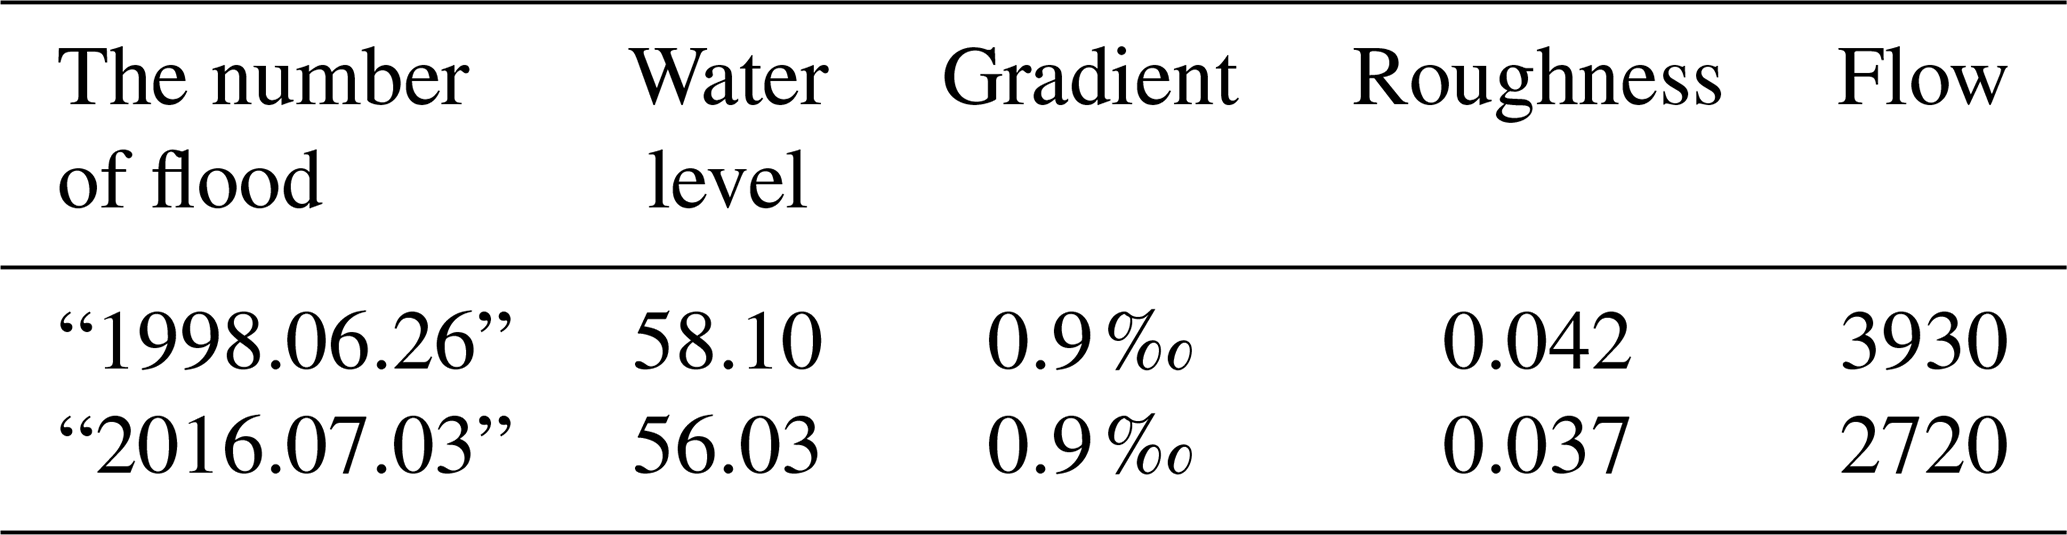
4.2 Relationship between water level and flow
Shitai is a new hydrological station, automatic measuring and reporting of water level are put into use from 2016 flood season. In order to meet the needs of analysis of flood warning characteristic water level of shitai, flow test is carried out in 2017.There is no cable facilities at this station, the bridge is used as a river crossing equipment. The station measures the flow with ADCP and radio current meter. In 2017, the measured maximum flow is 1660 m3 s−1, and the corresponding water level is 53.96 m (yellow sea). The flood peak water level of “2016.7.3” is 56.03. The measured maximum water level is 58.10 m. When the measured flow rate does not meet the requirements for determining the relationship between water level and water level, the combination of measured flow rate and hydrological investigation results is adopted. According to the conditions of manning's formula, under the condition of known section and stable section, the main factors influencing the determination of high flood flow rate are specific drop and roughness rate. According to the historical flood survey, the water surface lines along the shitai river are basically parallel under different flood conditions of different orders of magnitude. The water surface drop is stable at about 0.9 ‰, as shown in Fig. 5. Large section of shitai station, as shown in Fig. 6a, water level area relation of shitai station, as shown in Fig. 6b. In addition, the roughness rate can be deduced by measured flow, as shown in Fig. 6c. The corresponding roughness rate at the high water level of shitai station is between 0.035 and 0.045, so as to determine the flood peak flow rate of the flood investigated, as shown in Table 1, and the relationship line between water level and flow is determined comprehensively, as shown in Fig. 6d.

Figure 5Comparison diagram of flood water surface ratio drop of different magnitude (field) in the river section of Shitai.
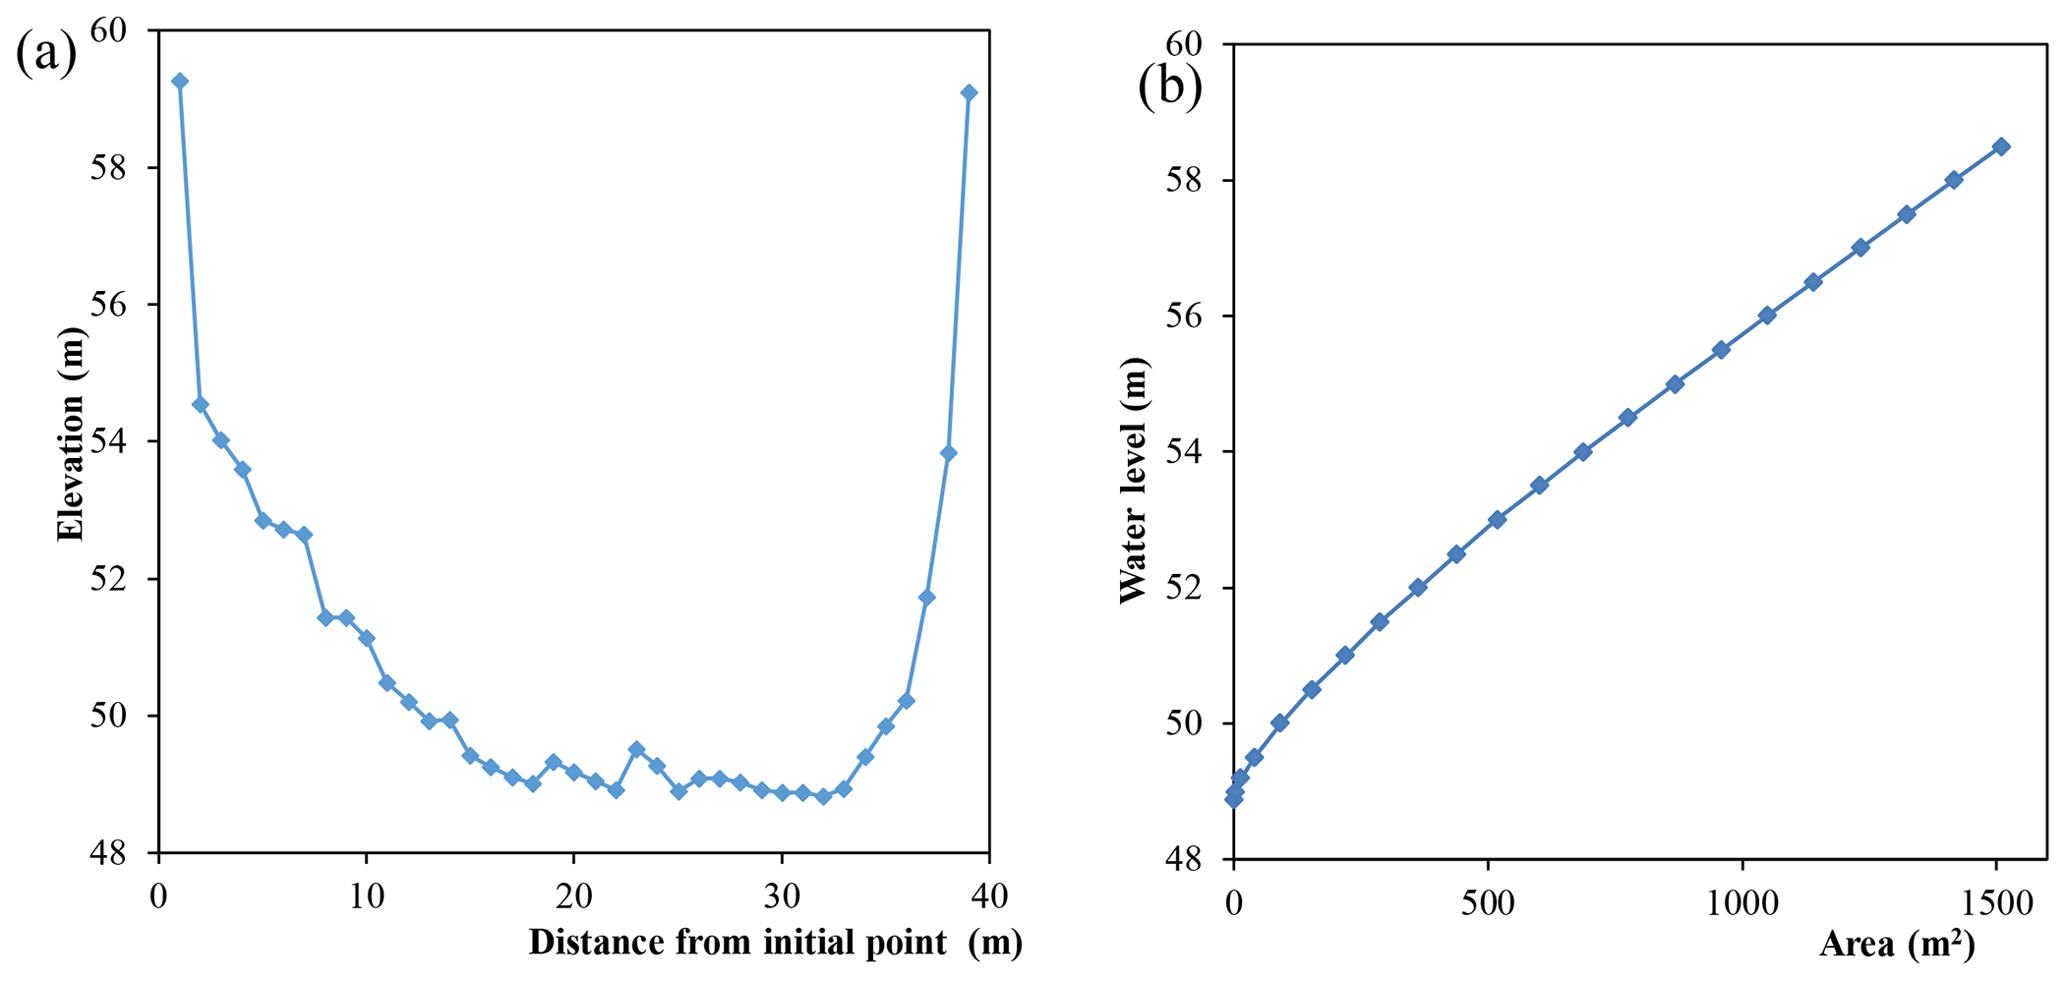
Figure 6Diagram of analysis results of relationship between water level and flow at Shitai station.
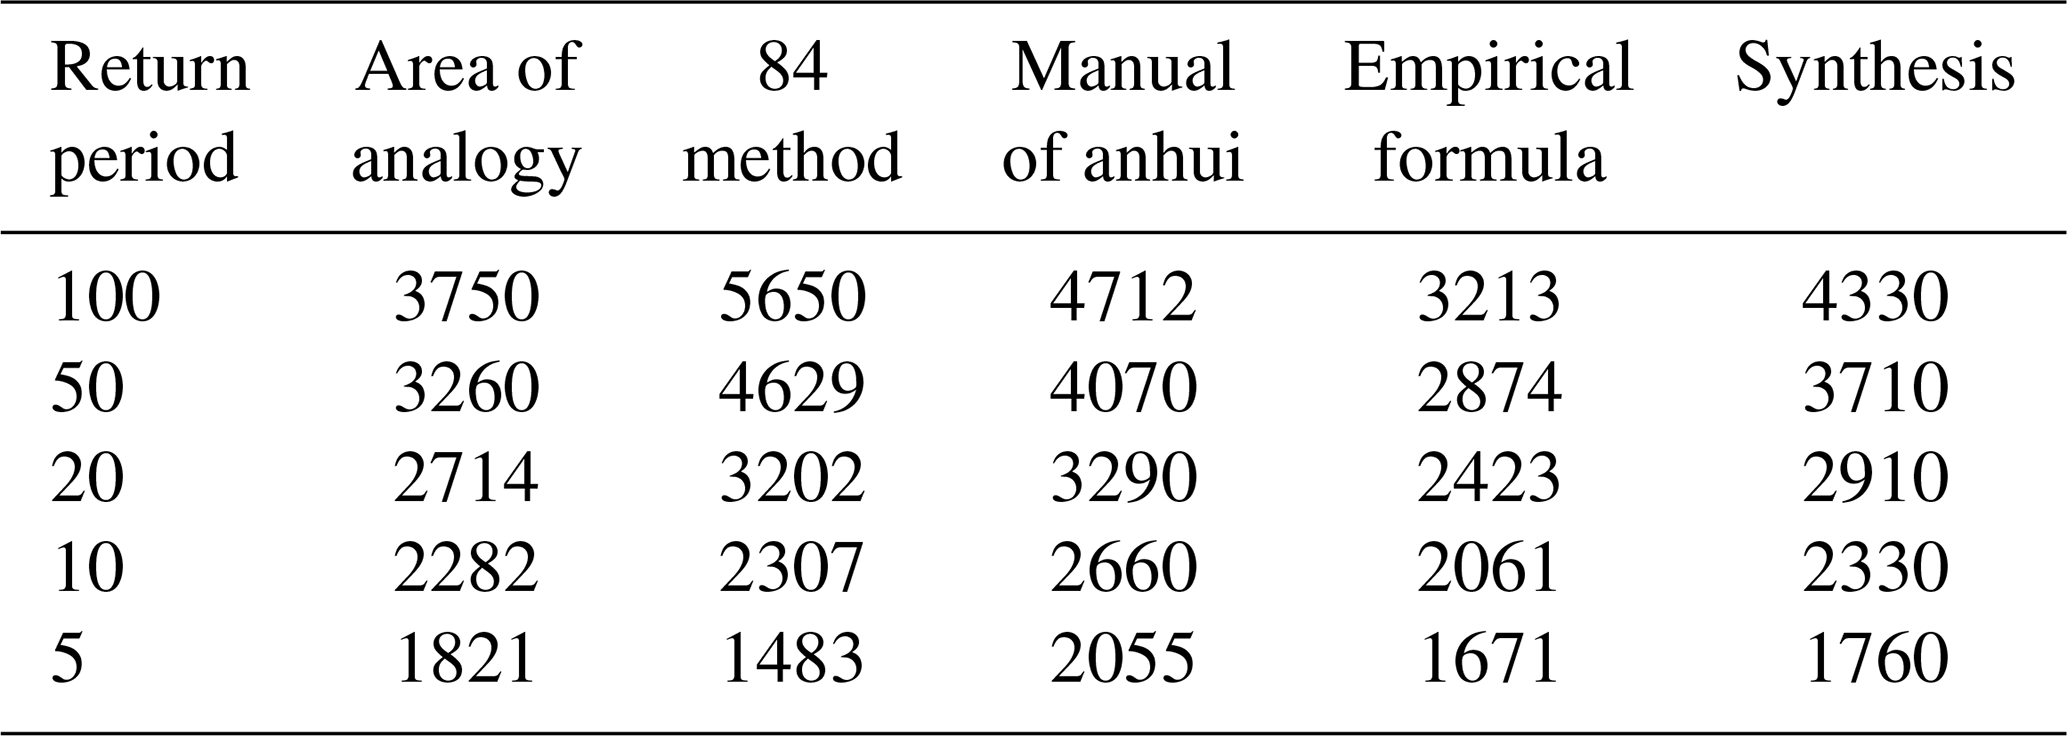
Table 1Results of flood peak flow to investigation flood.
Note: river bottom constraint is 48.85, corresponding flow is 0.
4.3 Determination of disaster water level and flow
Shitai investigation area divides into three parts: upstream liufang village test area, central urban area and downstream wangxian street area. In view of the differences of watershed area, water surface slope and elevation layout of population on both sides of the river between each area, determine the disaster water level in the aggregate measurement area according to subarea and short board effect principle.
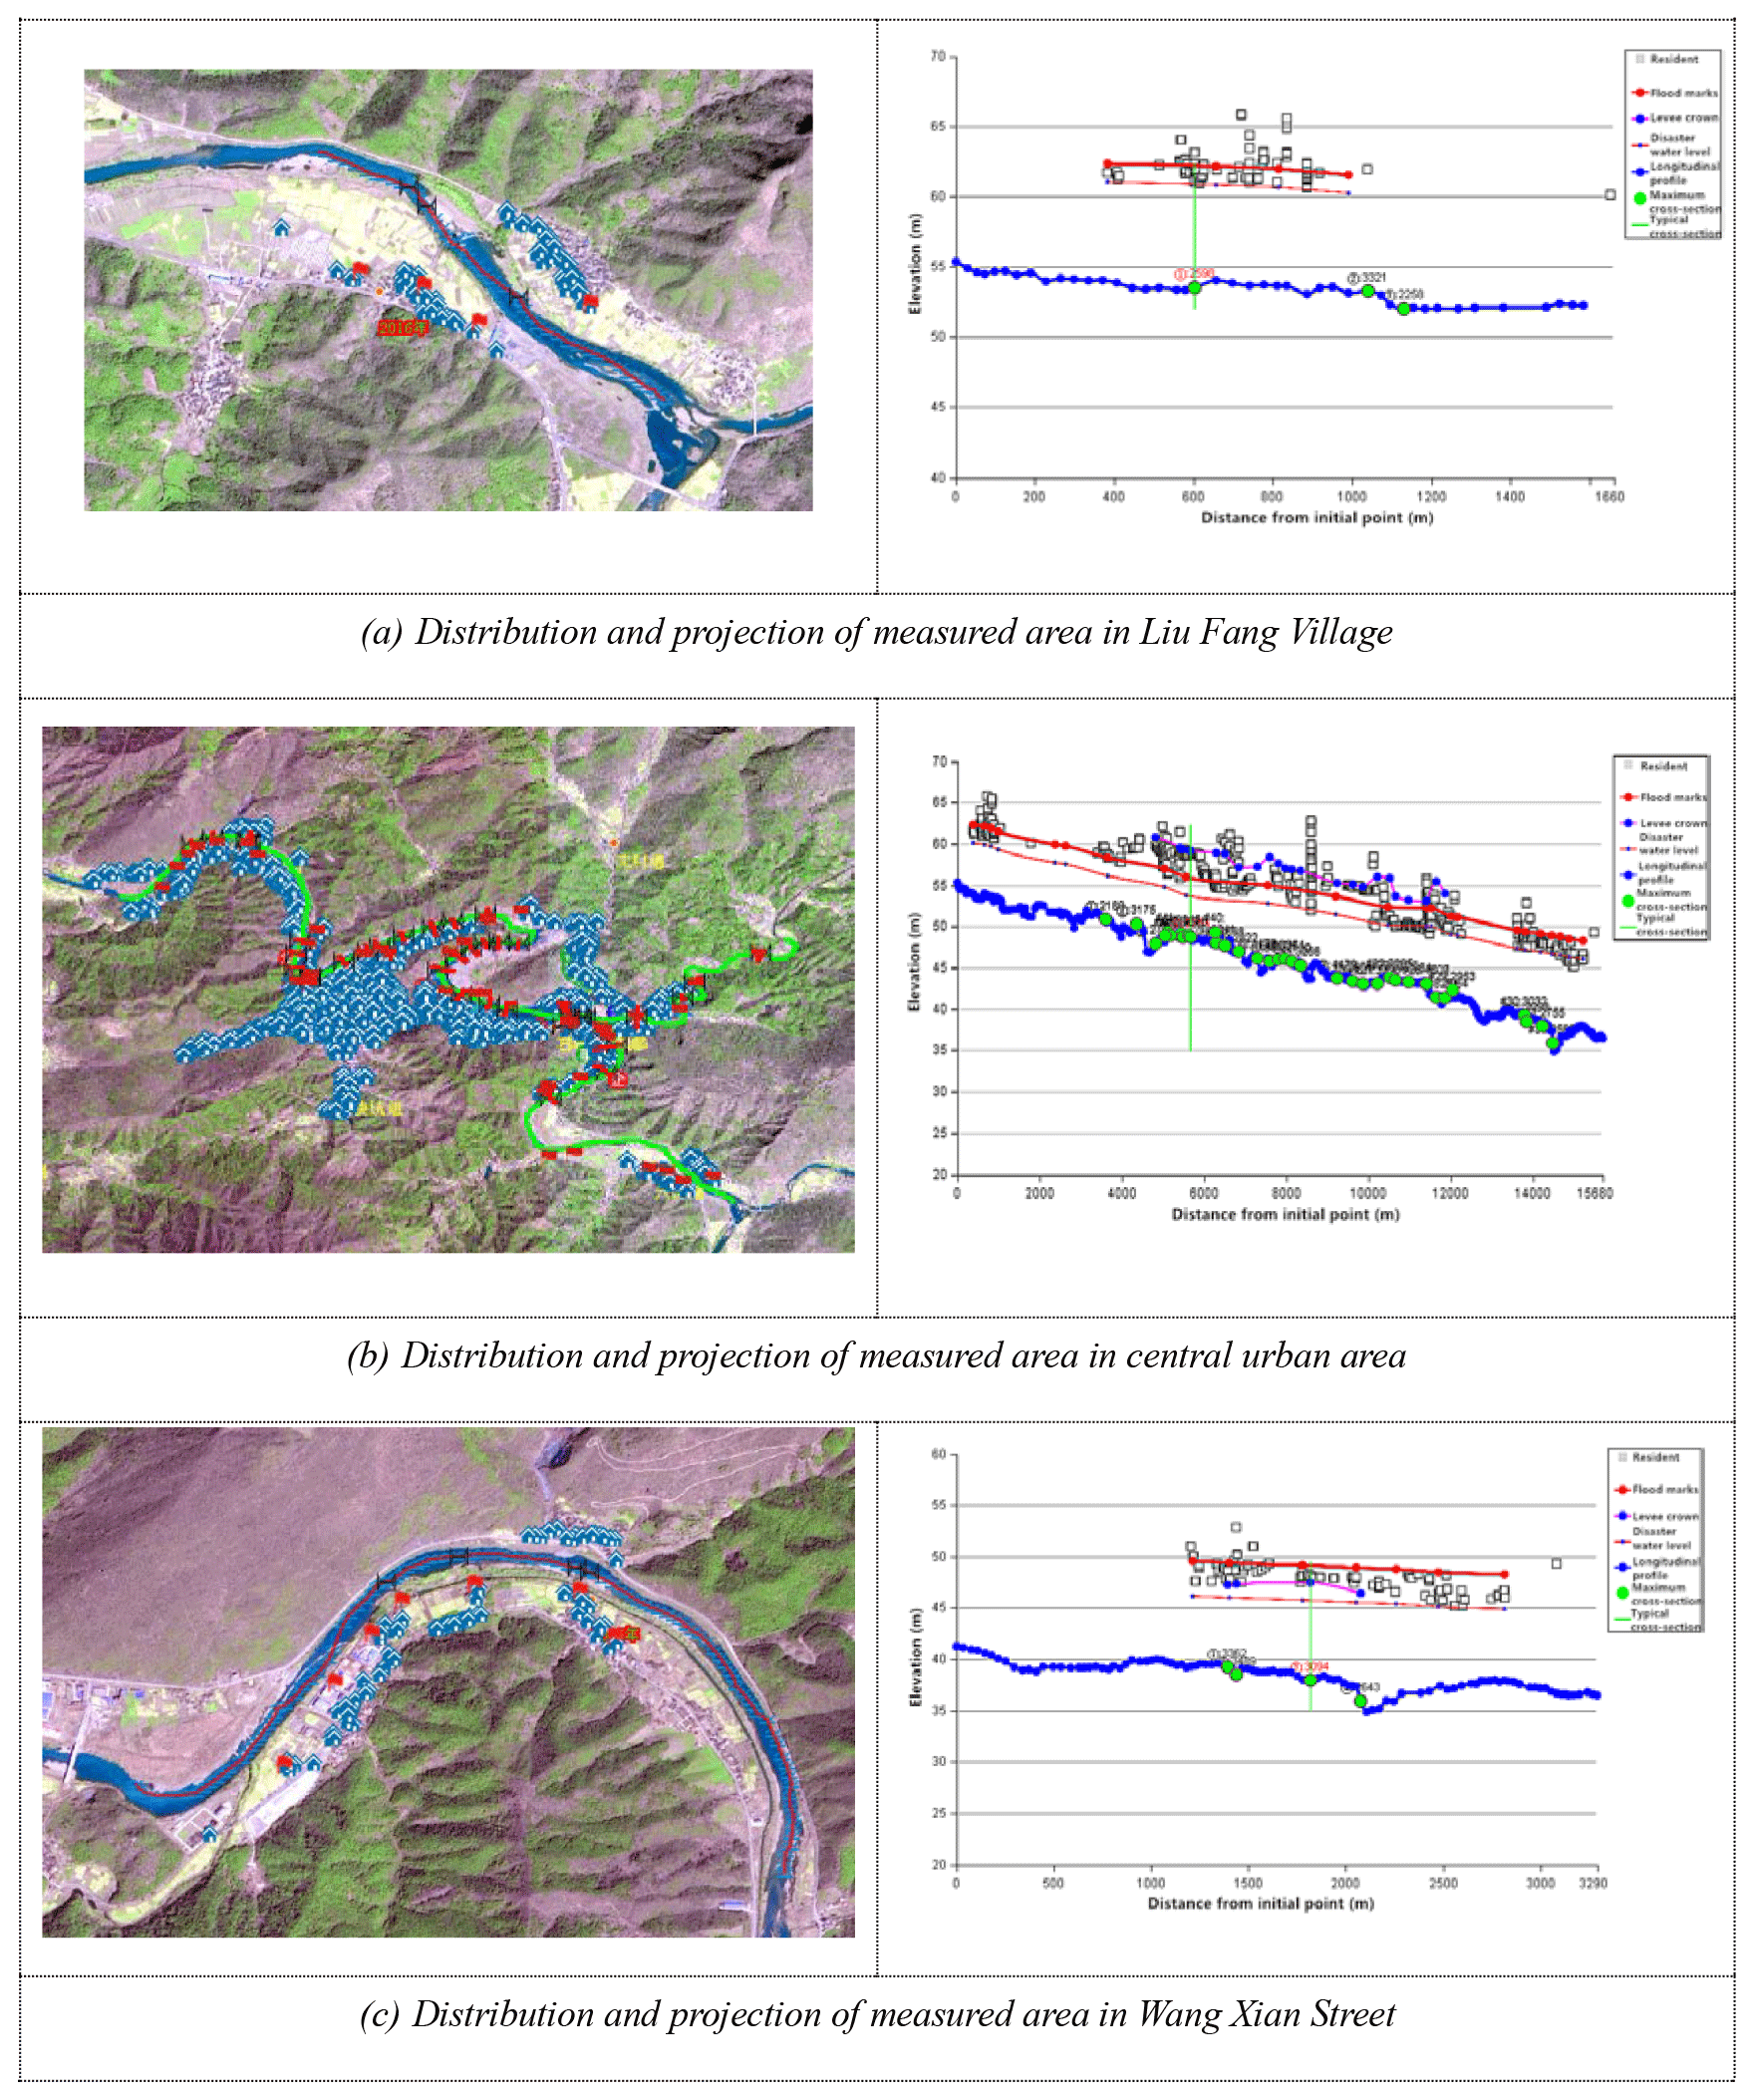
Figure 7Diagram of water level and height projection of building foundation in each measuring area (map data © MapWorld Anhui, http://anhui.tianditu.gov.cn, last access: August 2020).
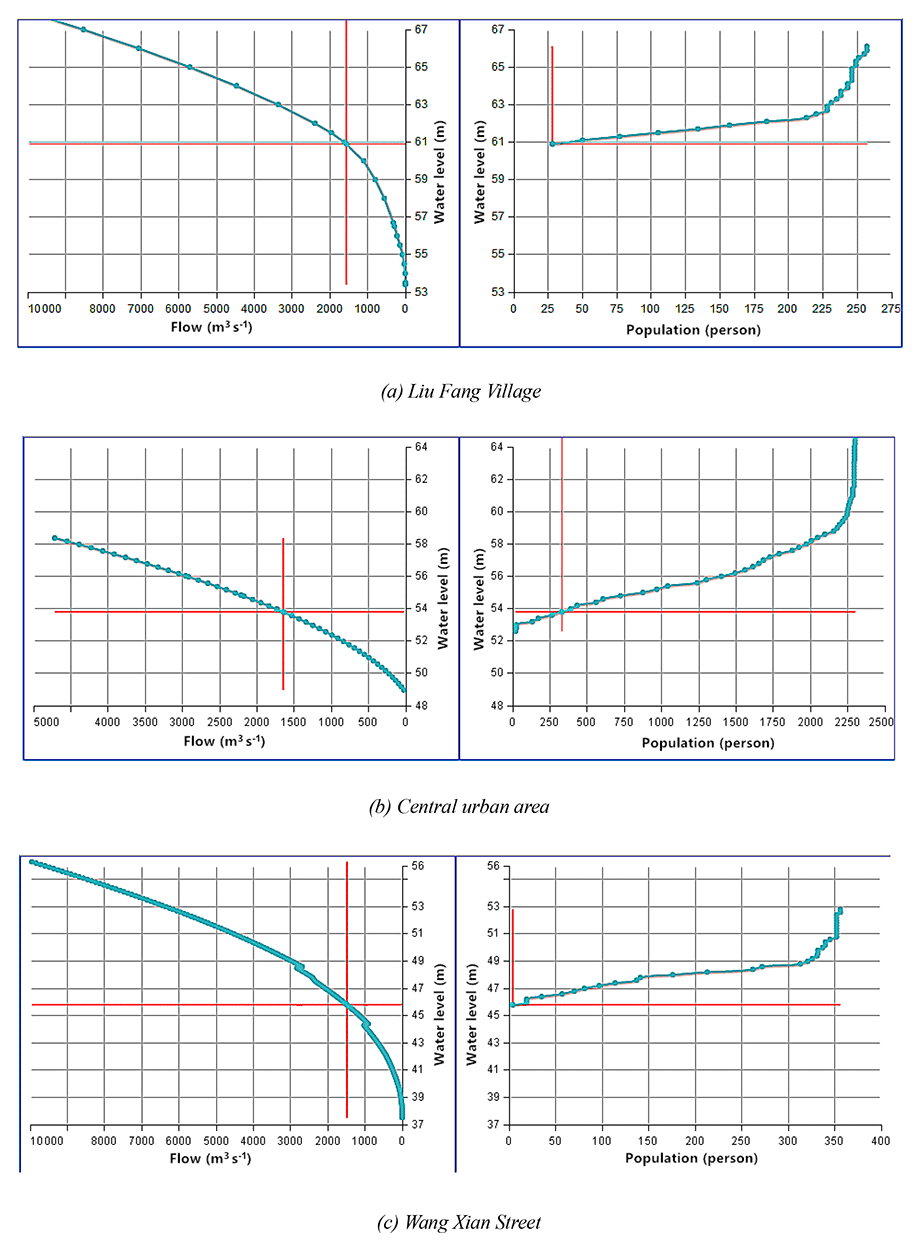
Figure 8Results of the investigation points of upstream and downstream associated river sections in Shitai area on the same axis and two lines.
Table 2Analysis results of disaster water level in downtown area of Shitai and villages related to upstream and downstream.
Note: The disaster water level of the main urban area is in the downstream of the urban flood wall which is not protected.
4.3.1 Determination of disaster water level in the zone
With the flood level distribution of flood “2016.07.03”, mix the foundation elevation of houses on both sides of river, according to the projection method each division measurement area has analyzing submerged. Flood submerged effects on both sides of the residents including liufang, central urban are a and wangxian street direction are shown in Fig. 7. According to this, the disaster water level of the liufang survey area is determined to be 60.90 m, corresponding to the disaster flow is 1540 m3 s−1; the disaster water level and flow in wangxian street area are 45.80 m and 1480 m3 s−1 respectively; although central urban area is protected by flood walls, in its protected areas, the water level higher than the height of the housing foundation on both sides of the river is not necessarily a disaster. As shown in Fig. 8b, the corresponding place of residence in the part below the disaster water level in the figure on the right. However, the left bank of the fuhu river and the confluence of the fuhu river and the qiupu river outside the protection area of the flood wall are vulnerable to waterlogging. Therefore, the disaster water level in the central urban area is subject to the population distribution in this section, the disaster water level and flow rate are respectively 53.8 m and 1730 m3 s−1. The relationship between flow, water level and population in each test area is shown in Fig. 8.
4.3.2 Determination of comprehensive disaster water level
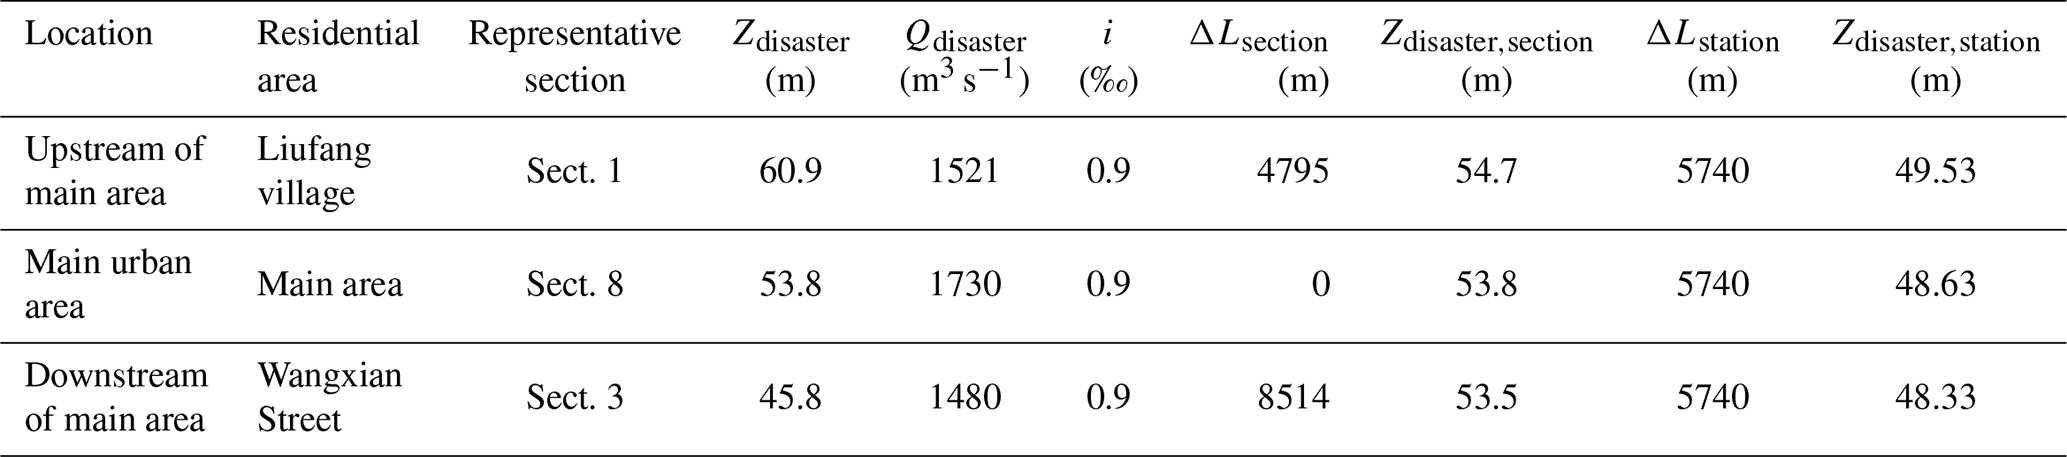
Based on the disaster water level analysis results of each division, water level difference between the representative section and the early-warning section (shitai hydrological station) in each section is calculated, and the water level of each disaster water level corresponding to the early-warning section (shitai hydrological station) is determined (Hu et al., 2015). According to Fig. 3 analysis results, water surface slope of central urban area is 9 ‰, the distance between behalf section and early warning section of each part is shown in Table 2. The calculated results of the disaster water level in each measured area corresponding to the disaster water level in the early-warning section are shown in Table 3. According to each division of the relationship between water level and the corresponding water flow, it is estimated that the disaster flow of each residential concentration group is between 1500 and 1700 m3 s−1. Finally, according to the short board effect principle, the comprehensive disaster water level is determined as follows: 53.50 m, and the disaster flow is 1500 m3 s−1.
4.4 Impact assessment
Shitai county is non-data area, so the design flood uses the existing methods of territorial and peripheral areas (ASDIWCH, 1984; Zhang et al., 2015). The area comparison method takes the gaotan hydrological station downstream of shitai of qiupu river as the reference station. The empirical formula is based on the huangshan hydrology manual. As we know from the results, there is a big difference between the methods. Therefore, the multimethod mean is taken as the comprehensive result, as shown in Table 3. Compared with 1500 m3 s−1 of the disaster flow and the results of Table 3. The current defense capability is less than once in 5 years.
5.1 Rainfall warning threshold
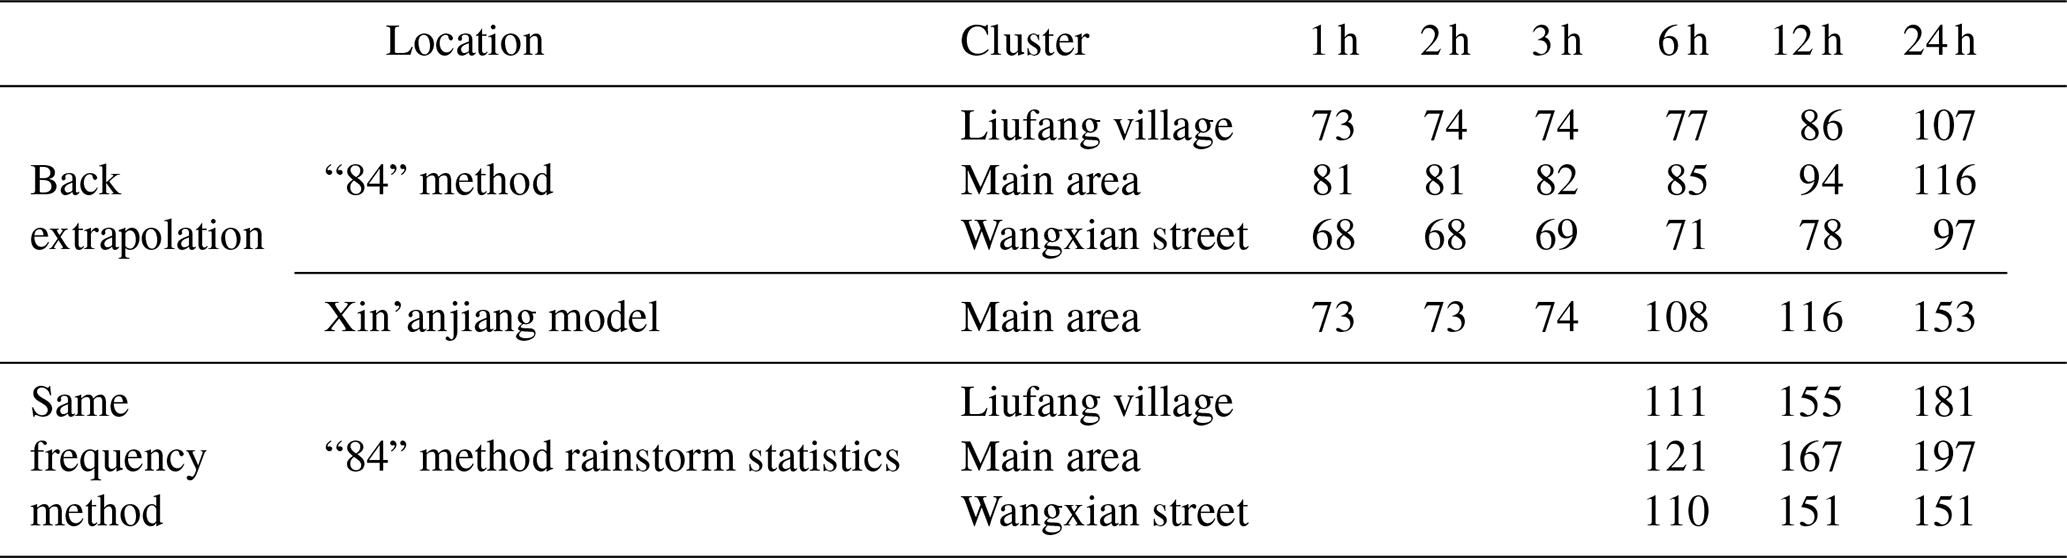
Based on the 1500 m3 s−1 of the disaster flow, using Xin'anjiang Model and the method of designing flood in mountainous area of anhui province, the rainfall warning threshold (net rain) of different time periods is deduced by trial calculation and back extrapolation method. At the same time, according to the recurrence period of the disaster flow in each part, the rainfall warning threshold (gross rainfall) in the characteristic period is determined by assuming the same frequency of rainstorm flood (Hu, 2016b), as shown in Table 4. It needs to be explained that the results of the backward extrapolation method need to be calculated in advance, the warning time of the same frequency method is greater than the watershed convergence time, the convergence time is about 6 h in this watershed.
Table 4Rainfall warning threshold of downtown area in Shitai and upstream and downstream related villages.
5.2 Characteristic water stage
Artificial observation scale is set up in the lower reaches of 5740 m of the hydrological station in the central district of shitai. The warning water level is 47.00 m, which corresponds to the water level of the hydrological station is 52.20 and the corresponding flow is 990 m3 s−1. Directly from the section, the existing warning water level has not been on the beach, and the warning water level is low. However, the basin above shitai is a typical river, and the flood rises up and down sharply. In terms of the flood “2016.6.24”, the maximum hourly increase reaches 1.35 m, with only 1 h and 15 min from the alert to the disaster water level. The warning water level of shitai water level station is 52.20 m and the guaranteed water level is 53.50 m. At the same time, in order to take account of the consistency of the water level elevation system in the Changjiang river basin, wusong base surface is adopted for the water level of shitai hydrological station. The elevation difference between wusong and huanghai is 1.83 m. The warning water level of shitai hydrological station is 54.0 m and the guaranteed water level is 55.3 m by taking an integer.
Using the technical route and analysis method of survey and assessment about mountain torrent disaster for reference, this paper takes the new site stone stage of small and medium-sized rivers for example, to carry out the survey of flood and elevation layout of live group along the river, and sets up warning source (hydrologic station) associated with early warning object's layout, carry out the early warning defense capability evaluation object, provided by flow, water level determines the hydrological site characteristics, and on the basis of the submitted by flow characteristic time critical rainfall warning threshold, effectively solves the small and medium-sized rivers new site without historical reference, without warning associated “stand naked” problem, achieved by providing hydrological values to hydrology factors effect. The technical route provided in this paper can provide reference for the construction of similar site early-warning index system.
In this paper, the actual flood control capacity of shitai county and related villages is comprehensively considered, and the conclusion is drawn that the overall defense capacity of the early-warning objects is less than once in 5 years. The warning water level is 54.0 m and the guaranteed water level is 55.3 m.The average net rainfall intensity of the 1 h watershed is 70 mm h−1, or the average rainfall of the 6 h surface is 110 mm, which is the threshold value of the critical rainfall causing disasters. This result can be used as a reference basis for flood prevention of shitai.
Data generated or analyzed during the study are available from the corresponding author by request.
YH designed and directed the study and wrote the paper. BZ and SJ processed the data. YH and ZW carried out software and investigation for this study. YH, ZW and BZ analyzed the data.
The authors declare that they have no conflict of interest.
This article is part of the special issue “Hydrological processes and water security in a changing world”. It is a result of the 8th Global FRIEND–Water Conference: Hydrological Processes and Water Security in a Changing World, Beijing, China, 6–9 November 2018.
This work was supported by the National Key Research and Development Program of China (grant no. 2018YFC1508106).
ASDIWCH – Anhui Survey and Design Institute of Water Conservancy and Hydropower: Calculation method of design floods in mountainous area of Anhui Province (The “84” method), ASDIWCH Research Report, 35 pp., 1984.
MWR – Ministry of Water Resources of the People's Republic of China: Code for hydrologic investigation (SL 196-2015), China Water & Power Press, 52 pp., 2015.
Hu, Y. Z.: Questions and answers on core technology of field investigation of torrential flood impact assessment, China Flood Drought Manage., 25, 26–33, 2015.
Hu, Y. Z.: Evaluation method of relationship between non static water level and inundated population in mountain area, Chinese Patent No. ZL201410803764.4, 2016a.
Hu, Y. Z.: Questions and answers on key technologies of torrential flood impact assessment and early warning threshold analysis, China Flood Drought Manage., 26, 23–28, 2016b.
Hu, Y. Z., Yao, X. B., Zhang, C. X., Fang, H., and Fang, G. J.: Investigation and Assessment of Flash Flood Effect and Research on Construction of Early Warning System: Take Luxi Reach of Chang River as A Case, J. China Hydrol., 35, 20–25, 2015.
Hu, Y. Z., Xu, Y. P., and Ye, C. L.: Research and application of key technologies of investigation, evaluation and early warning of flash flood disasters, Hydrology Bureau of Anhui Province Research Report, 235 pp., 2016.
Yao, C., Zhang, K., Yu, Z., Li, Z., and Li, Q.: Improving the flood prediction capability of the Xinanjiang model in ungauged nested catchments by coupling it with the geomorphologic instantaneous unit hydrograph, J. Hydrol., 517, 1035–1048, 2014.
Yao, C., Ye, J., He, Z., Bastola, S., Zhang, K., and Li, Z.: Evaluation of flood prediction capability of the distributed Grid–Xinanjiang model driven by weather research and forecasting precipitation, J. Flood Risk Manage., 12, e12544, https://doi.org/10.1111/jfr3.12544, 2019.
Zhang, C., Zhang, S., Xia, S., and Cheng, Q.: Huangshan Hydrology Manual, Hydrology Bureau of Huangshan Report, 155 pp., 2015.