the Creative Commons Attribution 4.0 License.
the Creative Commons Attribution 4.0 License.
 | 16 Sep 2020
Hydropluviometric variability in non-Sahelian West Africa: case of the Koliba/Corubal River Basin (Guinea and Guinea-Bissau)
Saly Sambou
Honore Dacosta
Rene Ndimag Diouf
Ibrahima Diouf
Alioune Kane
The Koliba/Corubal River watershed is poorly documented due to the hydrometric measurements shutdown and gaps in the very short hydropluviometric timeseries. The purpose of this study is to analyze the variability of rainfall in the Basin, by simulating flows using the GR2M rain-flow model and extending the discharge timeseries. From the regional vector method, the rainfall timeseries were homogenized, and the gaps filled by the estimated values. The rank correlation and Pettitt test on annual rainfall amounts (1924–2015) indicate breaks in 1958, 1967 and 1969, leading to rainfall deficits ranging from 9.7 % to 20.2 %. For some stations, the segmentation method shows a recovery of rainfall towards the end of the 1980s (Gaoual, Mali) and the early 2000s (Gabu). The analysis of the temporal distribution of the Monthly Rainfall Coefficients shows an improvement of the contributions of a few months during the period after rupture. From a hydrological point of view, the correlation between the mean annual rainfall and the runoff has allowed to extend the flow timeseries. The mean monthly rainfall calculated using the inverse square of distance method, the Potential Evapotranspiration, and the flow rates were used to calibrate and validate the model to determine the parameters that better transform rainfall in flow. The values of the Nash criteria close to 100 have made it possible to extend the monthly flow data from Koliba/Corubal to Gaoual, Cade and Tche-Tche until 2015.
- Article
(878 KB) - Full-text XML
- BibTeX
- EndNote


In West Africa, many recent studies (Sène and Ozer, 2002; Ali et al., 2008; Niang, 2008; Sarr and Lona, 2009; Ouoba, 2013; Panthou, 2013; Descroix et al., 2013, 2015; Bodian, 2014) showed a recovery in rainfall towards the end of the 1990s, after a long period of severe drought in the 1970s and 1980s. The study of Lebel and Ali (2009) indicated that the eastern and central parts of the Sahel experienced an increased rainfall situation, while the western part remains in deficit for the period 1990–2007. This improvement in rainfall conditions coupled with high interannual variability, can be appreciated in terms of the number of rainfall events with high runoff coefficients leading to floods. The manifestation of these events is heterogeneous and variable in time and space. The Sahelian zone more affected by the rainfall deficit (Dai et al., 1998) seems to be the most documented (Hufty, 1994). Some West African Basins such as the Koliba/Corubal River (a Sudanese area) are still poorly investigated due to lack of hydropluviometric data. Moreover, discontinuous hydrological datasets have many shortcomings related to the lack of adequate monitoring of measurement networks due to limited human and financial resources. According to Claude (1980), the creation of Water and Environment Service at the General Direction of Natural Resources of Guinea-Bissau is very recent (only from 1977). The hydrological regime and the streamflow are poorly known. The hydrometric network of Guinea is very obsolete, the first stations were implanted around 1910, but its development was slow and subjected to many hazards. The current network has been restructured starting in 1967. However, some newly created stations are not calibrated due to difficult access (Claude, 1980). This is an obstacle to any hydrological study, especially the assessment of the impact of rainfall variability on the streamflow.
The Koliba/Corubal Basin is a transboundary Basin, shared between Guinea and Guinea-Bissau. It is part of the intervention area of the Gambia River Basin Organization (in French, Organisation pour la Mise en Valeur du Fleuve Gambie, OMVG hereafter), whose mission is to undertake a rehabilitation of rainfall and hydrometric networks for the realization of its projects.
However, the availability of long-term timeseries of rainfall (annual and monthly), although sometimes incomplete, is an asset to provide a solution to the lack of data, through the modeling of the rain-flow relationship. Among the existing models, the GR2M of Cemagref (Mouelhi, 2003; Mouelhi et al., 2006), Rural Engineerig at the monthly time step and with two parameters (X1 and X2), has been selected. It is a simple and robust model much applied in Africa (Paturel et al., 1995; Mahé et al., 2005; Bodian et al., 2012). The objective of this study is to analyze the variability of rainfall in the Koliba/Corubal River Basin. Due to discontinuous and incomplete hydrological data, a rain-flow modeling approach will allow, on the basis of existing data, to extend the discharge timeseries for a better quantification of water resources for rational management and the satisfaction of different uses.
2.1 The study area
The Koliba/Corubal River watershed lies between 11∘ N and 12∘30′ N and between 12∘ W and 14∘30′ W. It is shared between Guinea (84.5 %) and Guinea-Bissau (15.5 %) and covers an area of 20 876.4 km2 at the Tche-Tche hydrometric station (Fig. 1).
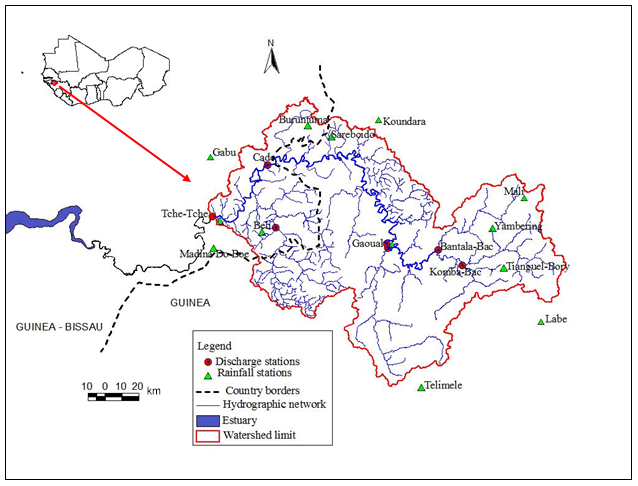
Figure 1Location of the Koliba/Corubal River watershed in West Africa and spatial distribution of rainfall and hydrometric networks.
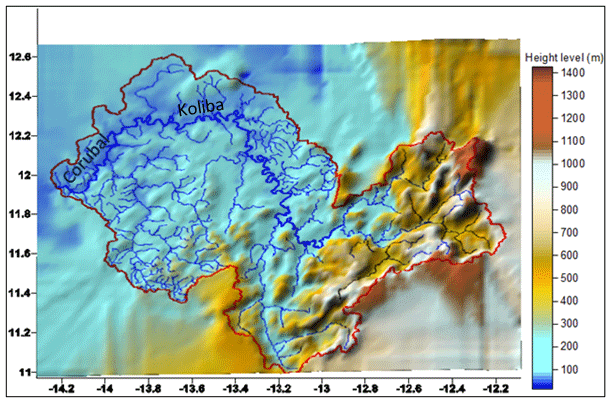
Figure 23D Digital Terrain Model of the Koliba/Corubal Basin at Tche-Tche.
The River has its source from the West of Fouta Djalon, in Middle Guinea, in the region of Labe. It is a junction of two rivers: the Tomine which has its source from the Sangale and the Komba which takes its source from Madina Wora. These two rivers confluence at Gaoual to give the Koliba. After a course, going West, more than 200 km with many meanders, it forms the border between the two countries for a few kilometers, before entering Guinea-Bissau where it is called Corubal. It joins the Kayanga/Geba near Xime in a flat and marshy zone where the tide goes very far inside the continent, to form the estuary of Geba (SOFRECO, 1993). Although, its Basin occupies a smaller area, the River concentrates the most important surface water resource in Guinea-Bissau. The very dense hydrographic network is simplified (Fig. 1) for more readability.
The vegetation is composed of dense forests, degraded forest altitude, dry forest covered annually by bush fires, wooded savannah and woodland, crops, fallow field, etc. (Zoumanigui, 2003). The Koliba/Corubal Basin belongs to a tropical climate characterized by a single rainy season that generally lasts five months in the north and six months in the south of the Basin and a dry season which however records a few millimeters of water (April and November). Rainfall decreases from the south to the north following the West African monsoon flux. The monthly maximum temperature average is between 26.0 and 33.4 ∘C at Labe, 31.1 and 40.20 ∘C at Koundara, respectively in August and April. The average minimum temperatures range from 10.2 and 18.3 ∘C at Labe and 15.0 and 24.2 ∘C at Koundara in December and May.
2.2 Physiographic data
The cartographic documents covering a large area of study are not always easy to access. Moreover, even if they are available, a problem of the heterogeneity of the scales arises. Thus, for some reasons of homogeneity, the Shuttle Radar Topography Mission (SRTM) data of 30 m resolution NASA (National Aeronautics and Space Administration) were used. They are used for the characterization of the relief and the determination of the morphometric characteristics of the Koliba/Corubal Basin (Table 1 and Fig. 2). The Digital Terrain Model (DTM) realized with the Surfer software shows that the mountainous terrain is in the northeast part of the Basin with altitudes exceeding 1400 m. It is at these levels that the tributaries Bantala and Komba take their source. In the downstream part, altitudes decrease to less than 100 m (Fig. 2). The Basin and its various sub-basins have an elongated shape as shown by the compactness coefficients (Table 1), resulting in a long period of concentration of runoff water. This is nuanced because the influence of relief is even more important.
Table 1Morphometric characteristics of the Basin and its sub-basins.
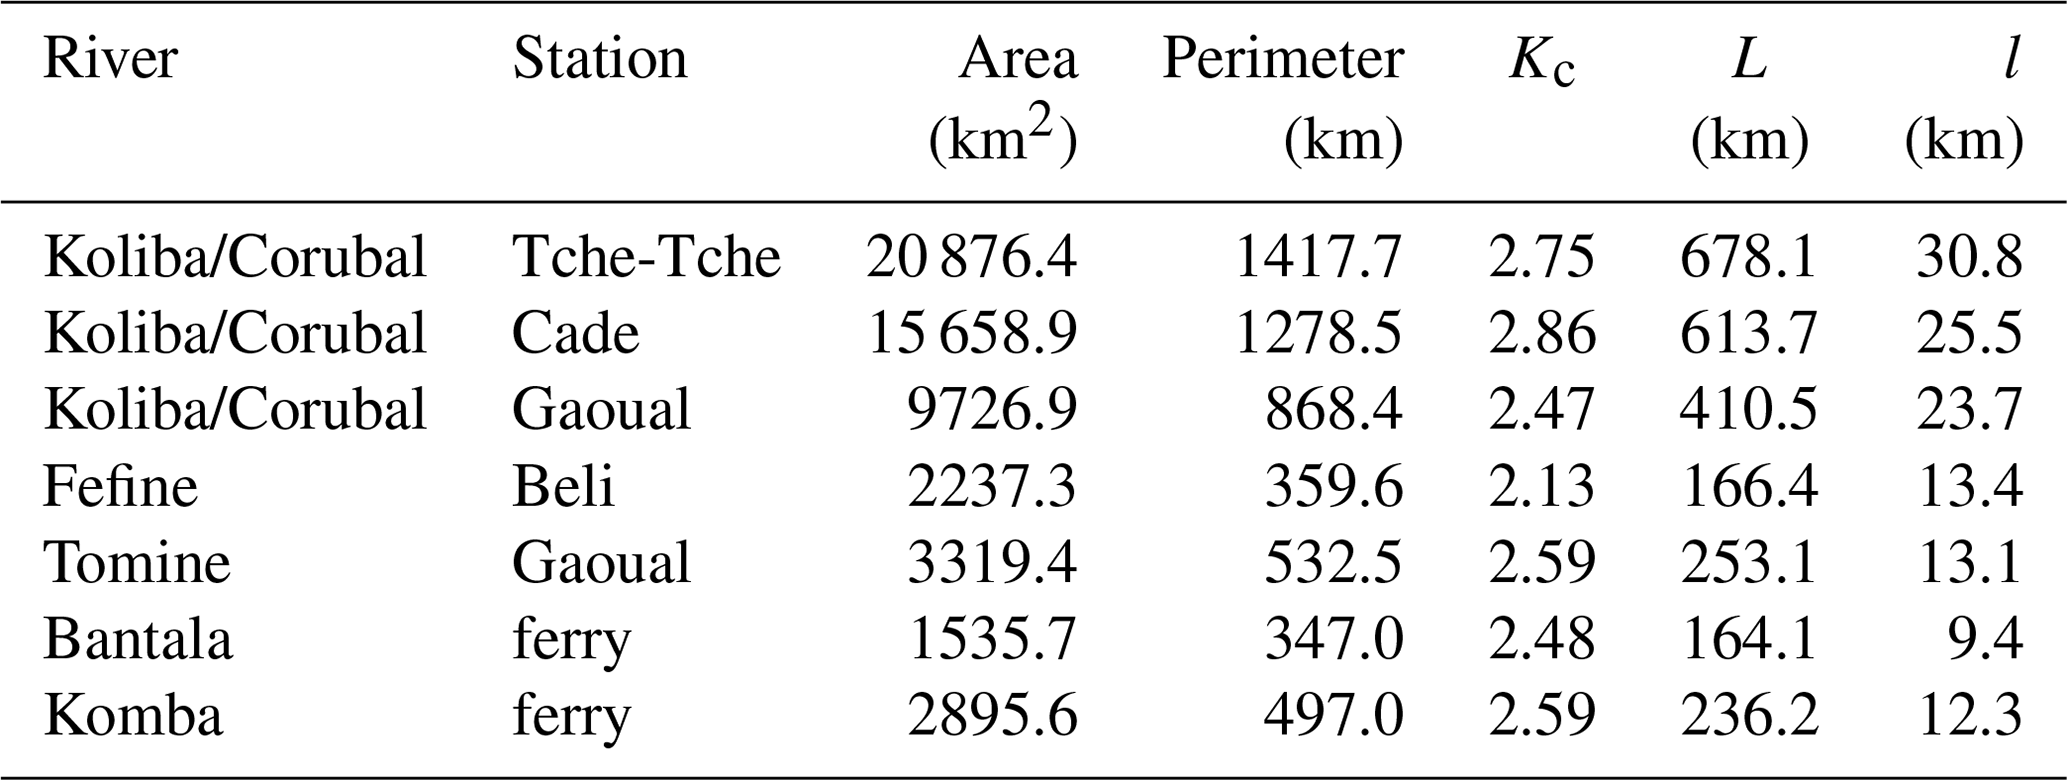
Kc: Gravelius compactness index; L (km): length of the equivalent rectangle; l (km): width of the equivalent rectangle.
2.3 Rainfall data
Rainfall data come from the National Meteorology Direction of Guinea (DNM), the National Meteorological Service of Guinea-Bissau and the OMVG. The length of the timeseries is very variable from one source to another, because the shortest are found in Guinea-Bissau over a period of 12 years (Beli and Tche-Tche). Table 2 lists the rainfall stations selected by country and available data, while Fig. 1 shows their spatial distribution in the Basin. Given their number, only the results of a few will be presented. The choice will be based on the sample size, the quality of the data (small gaps in the timeseries) and the geographical position in the Basin.
Table 2List of selected rain gauge for this study.

* complete timeseries; av. rain.: average annual rainfall.
2.4 Potential evapotranspiration data
Potential Evapotranspiration data (PET) from the Labe station are calculated using the Penman (1948) formula. They come from the DNM of Guinea and cover the period 1975–2000. This station being far from Cade and Tche-Tche, Koundara's maximum and minimum temperature data (1975–2015) are used to calculate the PET using the CROPWAT 8.0 software (Smith, 1992) and based on the formula Penman–Monteith (Monteith, 1965).
2.5 Data and hydrological model
2.5.1 Hydrological data
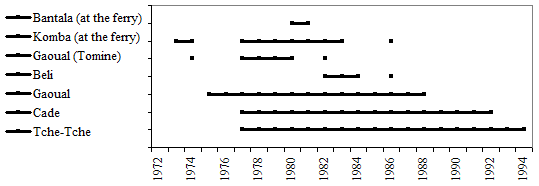
The Koliba/Corubal hydrometric network at Tche-Tche is composed of seven (7) stations; three (3) of them are on the mainstream and four (4) are on the Bantala, Komba, Tomine and Fefine tributaries (Fig. 1). The hydrological data come from the OMVG database. Figure 3 shows the chronogram of available discharge, the timeseries of which are sometimes interspersed with gaps (Bantala, Komba, Gaoual on the Tomine and Beli). Due to failures, these stations were excluded from the hydrological analysis. Only the stations of Gaoual (14 years), Cade (16 years) and Tche-Tche (18 years) are chosen to simulate the flows and thus extend the discharge timeseries.
2.5.2 Presentation of the hydrological model GR2M
The GR2M model is a global conceptual hydrological model (Fig. 4) that operates on a monthly scale and uses rainfall and potential evapotranspiration as inputs (Mouelhi, 2003; Mouelhi et al., 2006). The discharges are used for setting parameters and evaluating performance. It has two parameters X1 and X2 that can be optimized: the first one is evolved in the production function and the second one in the transfer function. The production function is organized around a soil reservoir “S” which represents its maximum capacity. This reservoir regulates the quantitative aspect of modeling (Gogien, 1998). The transfer function is used to translate the way in which the rainfall for the flow reaches the outlet of the basin by specifying the time course (Mouelhi, 2003). This is the fraction of the net rain that has not been used to feed the soil reservoir.
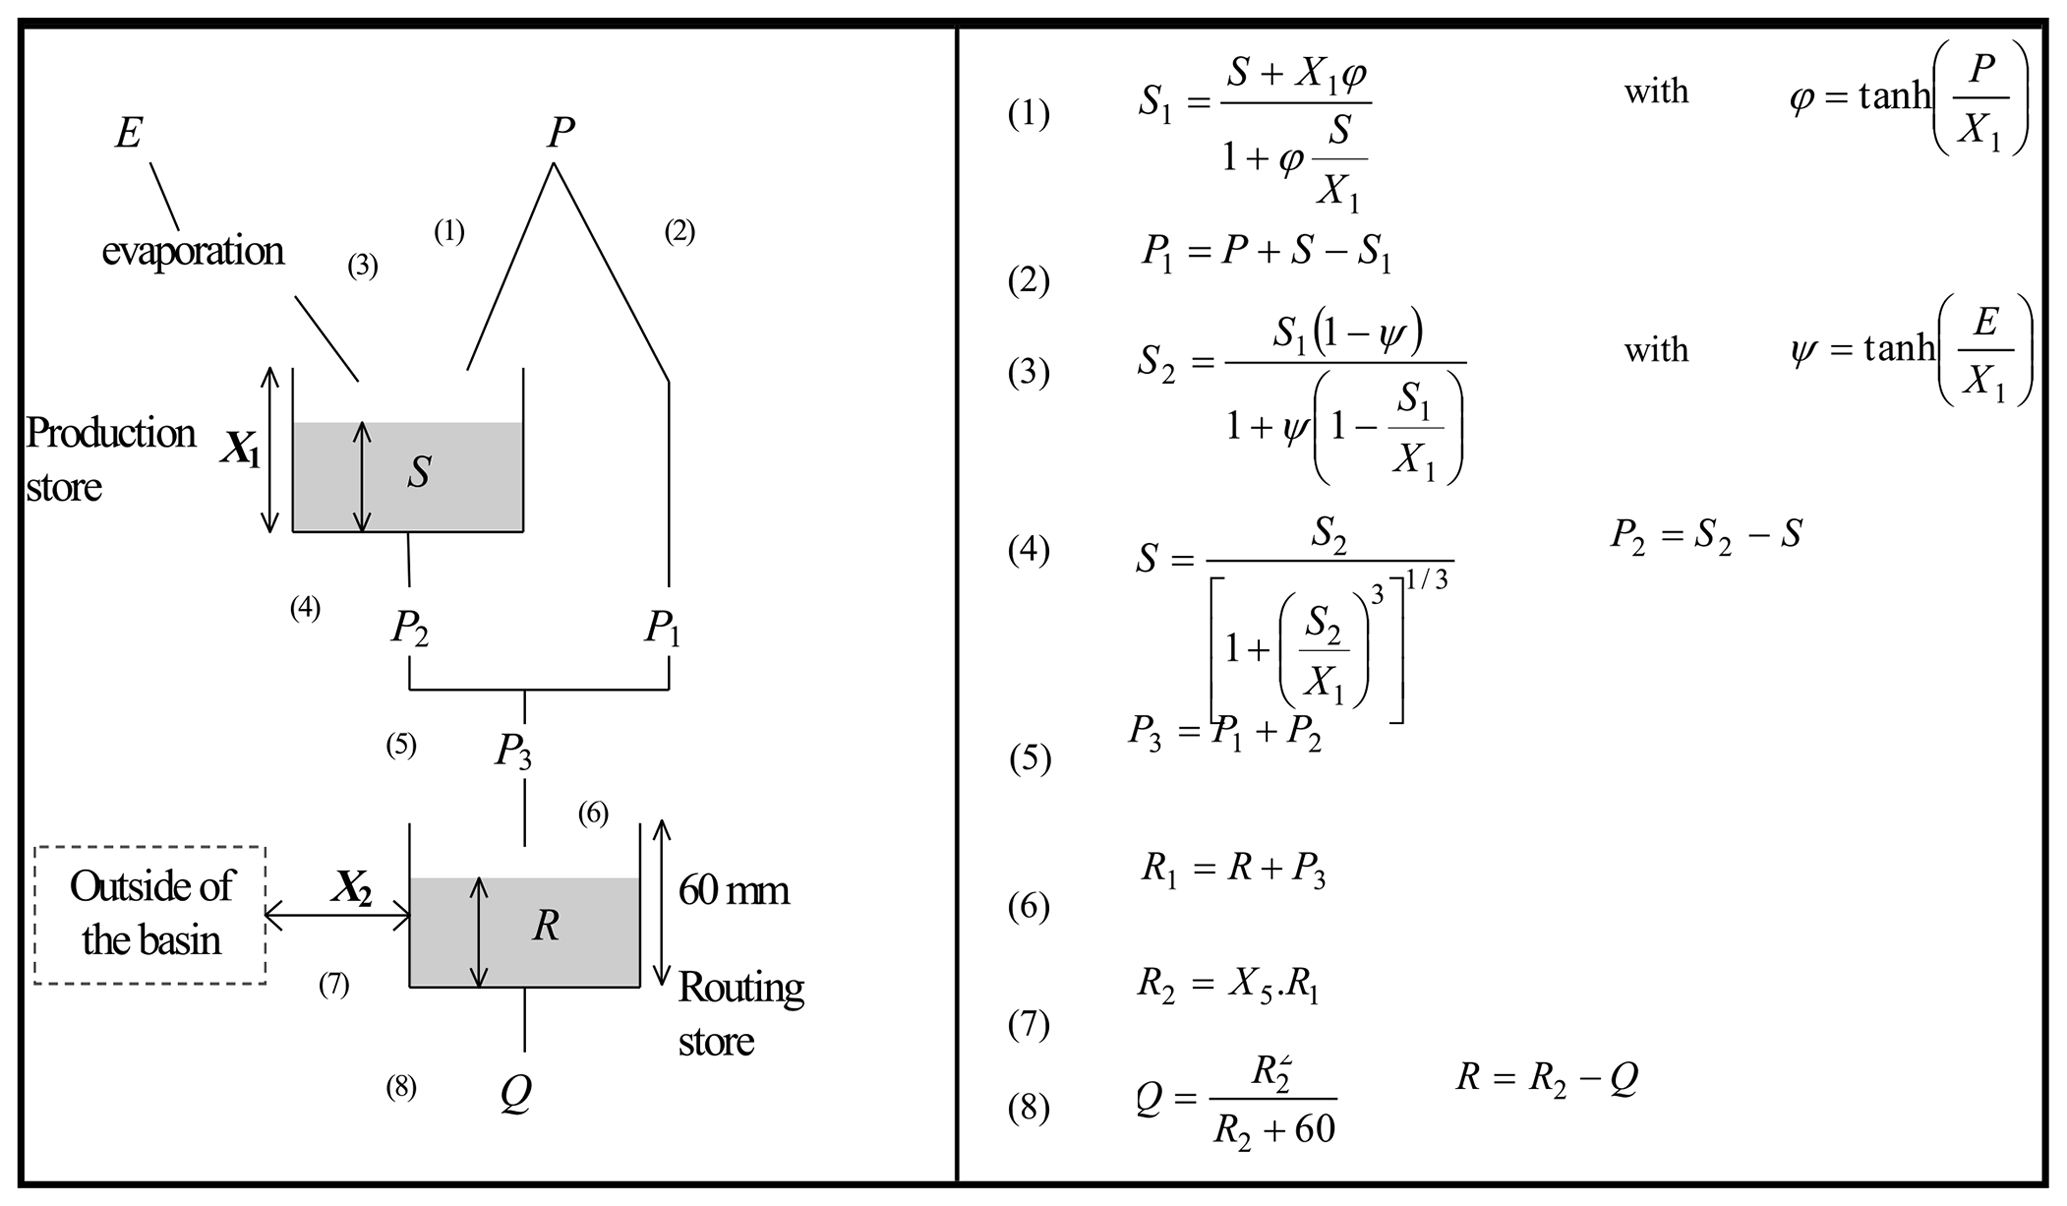
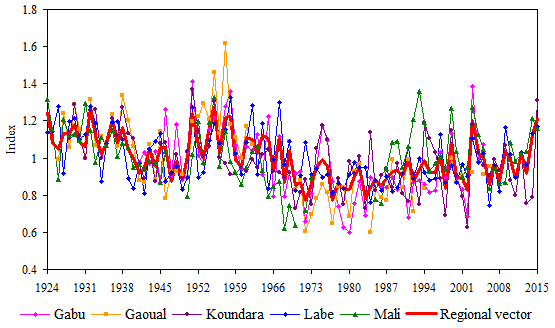
Figure 5Annual vector of rainfall index over the period 1924–2015 and index of Gabu, Gaoual, Koundara, Labe and Mali stations.
3.1 Critical and homogenization of rainfall data
The critical and the homogenization of the data were done by the Regional Vector Method (Brunet-Moret, 1977), integrated into the Hydraccess software (Vauchel, 2004). The Regional Vector is defined as a chronological series of annual or monthly rainfall indices derived from the extraction of the most “probable” information in the most frequent sense contained in the dataset of observation posts in a homogeneous climatic region (Hiez, 1969, 1977; Brunet-Moret, 1979; L'Hôte, 1986; Hiez et al., 1987, 1992). Among the two usual methods, the one of Brunet-Moret (1979) was chosen because it relies on all the stations and the calculation of the deviations from the regional average, makes it possible to detect the doubtful data. For each rainfall station, a timeseries of annual indices is calculated, the mean of which represents the regional vector (Fig. 5). These indices indicate the rainfall of the year compared to the regional average. The timeseries are homogenized over the period 1924–2015 and the calculated values were used to fill the gaps.
3.2 Detection of breaks within the annual rainfall timeseries
Given the high variability of rainfall, statistical tests integrated into the KhronoStat software (IRD, 1998) were used to detect stationarity breaks in the timeseries. A break can be compared to a change in the probability law of the timeseries at a given moment, most often unknown (Lubès et al., 1994). Among the existing break tests, three (3) are selected for this study because of their robustness and sensitivity to a change in the average. They are widely used in the climate variability analysis in Africa (Servat et al., 1998, 1999; Paturel et al., 1998; Haidu, 2006; Kouassi et al., 2010; Bodian, 2011, 2014; Sambou et al., 2018). It is the rank correlation test (Spearman, 1904) that analyzes the randomness of a timeseries and proposes an alternative hypothesis of trend. The Mann–Whitney test modified by Pettitt (1979) consists in dividing the main timeseries into two sub-series having different statistical distributions, separated by a break at time t. The null hypothesis H0 corresponds to the absence of break (homogeneous timeseries), whereas if it is rejected, a break date is determined. The segmentation procedure (Hubert and Carbonnel, 1987; Hubert et al., 1989) has the principle of dividing the timeseries into several segments whose averages are significantly different.
3.3 Recent variability of monthly rainfall and calculation of mean rainfall
The analysis of the temporal distribution of rainfall on a monthly scale is relevant in the context of the recent evolution characterized by improved rainfall conditions. The missing values were reconstructed with the regional vector method, considering each month of the year separately, like an annual value. To do this, a calculation of the Monthly Rainfall Coefficients (MRC, hereafter) was performed at the periods pre-break and post-break. They indicate the contribution of each month to the annual total rainfall and they are obtained from the report of the monthly total of the annual cumulation. For the purposes of the discharge simulation, the average rainfall over the Basin upstream from Gaoual, Cade and Tche-Tche stations was calculated according to three interpolation methods (Thiessen method, inversing of the square of the distance method and Kriging method) using the Hydraccess software. It is about going from a punctual rainfall to a surface rainfall. The results of the best method are considered. This average rainfall is one of the input data of the model.
3.4 Calculation of potential evapotranspiration
Oudin (2004) proposed an evapotranspiration formula based on few data (temperature), and having a high spatial robustness optimized to meet the needs of hydrological modeling. For reasons of consistency and to avoid possible differences, PET was calculated with the Penman–Monteith formula in Koundara over the period 1975–2015. The Labe data already available until 2000 have been extended using the same formula to harmonize with the rainfall data. According to Quentin (2015, in Bell et al., 2011), the Penman–Monteith formula is often used in evapotranspiration extrapolation for its “physical basis”, which is more sensitive to the multiple effects of climate change. Table 3 presents the average values of PET at Labe and Koundara over the period 1975–2015. It has a periodicity with a maximum in the dry season and a minimum in the rainy season.
Table 3Average monthly potential evapotranspiration at Labe and Koundara.

3.5 Hydropluviometric correlation
In terms of short timeseries and gaps, a correlation approach between rainfall and runoff is adopted in order to lengthen the annual discharge timeseries. For this, the average annual rainfall over the Basin was determined using three (3) methods mentioned above, and the annual modules transformed into a runoff. Then, the good correlation between the two variables, with a coefficient of determination of 0.6 and 0.8, makes it possible to appreciate the relation. The linearity of the relationship leads to the extension of the timeseries of runoff from the average rainfall before finally being converted into an annual module.
3.6 Calibration of the model
The objective of the calibration phase is to find the parameter settings that bring the behavior of the model as close as possible to that of the modeled basin, the similarity of the behaviors being quantified by the Nash criterion (Nash and Sutcliffe, 1970; Ardoin-Bardin, 2004) defined by the Eq. (1):
is the observed monthly discharge, is the calculated monthly discharge, is the average monthly discharge observed and i is the month considered.
The Nash criterion allows appreciating the quality of the simulations compared to the observations. The best fit corresponds to a criterion value close to 100 %, while a criterion below 60 % indicates a poor relationship between simulations and observations (Ardoin-Bardin, 2004).
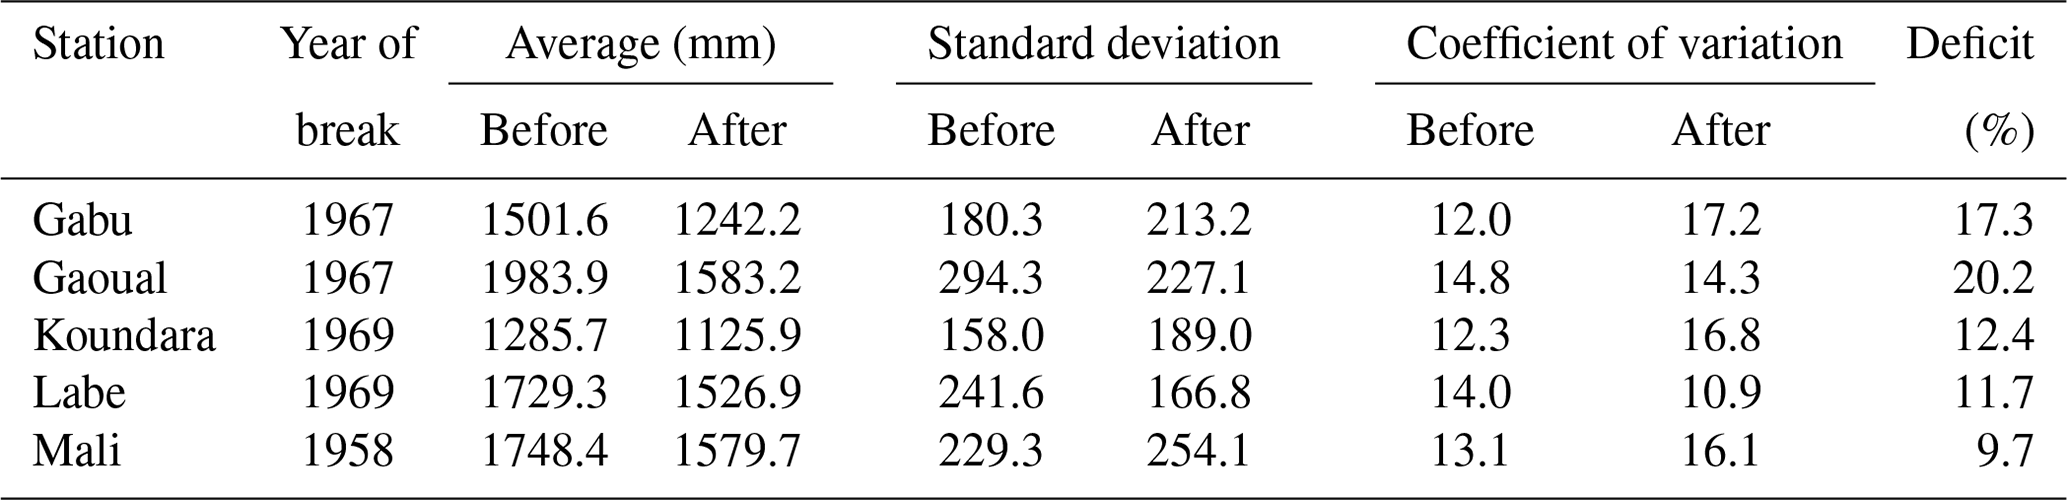

Figure 6Annual observed and estimated rainfall at Gabu, Gaoual and Mali stations over the period 1924–2015.
Generally, global conceptual models require a phase of parameter specification which must be done on sufficiently long timeseries for which it must be assumed that there has been no change in the hydrological or physiographic characteristics of the basin (Diello, 2007). Like most West African basins, the Koliba/Corubal experienced a decrease in rainfall between 1960s and 1970s. This decrease has influenced the hydrological functioning. The brevity of discharge data does not facilitate their division into two parts for calibration and validation. In addition, the covered periods covered by the data are included in the phase of post-break. These periods can be considered as relatively homogeneous; knowing that the recovery of rainfall observed in most stations was not yet effective. According to Ardoin-Bardin (2004), the shortest periods may depend on more extreme conditions affecting the considered period. This justifies the choice of all the periods available for calibration and validation. Thus, for each of them, an adjustment of the parameters X1 and X2 was carried out and the model validated. These parameters will be applied to the chronicles to simulate the flows of the Koliba/Corubal River from the input data.
4.1 Homogenization of annual rainfall
The application of the regional vector method enables to estimate values to fill gaps in the timeseries of stations. Figure 6 shows the observed and estimated rainfall over the period 1924–2015. The correlation coefficients between observed and estimated values are 0.649 in Mali, 0.812 in Gabu and 0.832 in Gaoual.
4.2 Homogeneity tests on annual rainfall
4.2.1 Rank correlation and Pettitt test
The results of the rank correlation test indicate a decrease in rainfall. The null hypothesis of no change is rejected at the 99 %, 95 % and 90 % confidence thresholds at all stations except Mali where it is accepted at the different thresholds.
The Pettitt tests shown in Table 4 exhibit that all timeseries show early break for Mali (1958) and later for Labe and Koundara (1969). For most stations, the break occurred in 1967 and 1969, which confirms the results of the ICCARE program (Servat et al., 1998, 1999) in West and Central Africa. The rainfall post-break deficit is between 9.7 % (Mali) and 20.2 % (Gaoual). The study of Bodian and al. (2011) (for the period 1923–2005), indicated a deficit of 13 % in Mali and 24 % in Labe. It has decreased to 9.7 % and 11.7 % respectively over the period 1924–2015.
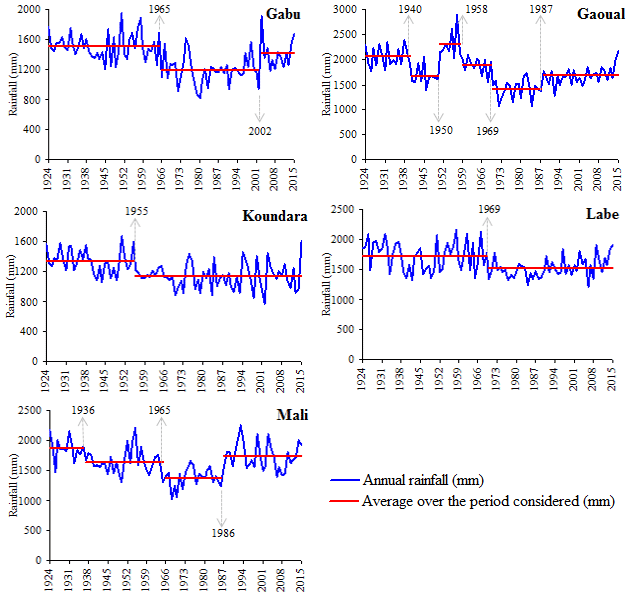
Figure 7Variability and segmentation of annual rainfall in Gabu, Gaoual, Koundara, Labe and Mali from 1924 to 2015.
4.2.2 Segmentation method
The segmentation method presented in graphical, show one or more breaks in the timeseries (Fig. 7). Koundara and Labe timeseries show a single break in 1955 and 1969 respectively. In Gabu, the decrease in rainfall recorded since 1965 reduced in 2002, the year that marks the end of the dry period and the beginning of a rainfall recovery. The Mali timeseries had a succession of two periods of low rainfall, before returning to more favorable rainfall conditions from 1987. The Gaoual station presents a weird situation with five break events separating six unequal periods. Comparison is difficult due to inequality of the sub-periods.
The correlation coefficients between the observed and estimated monthly rainfall have deteriorated. They vary between 0.531 (Mali) and 0.696 (Koundara) in May; 0.579 (Gabu) and 0.731 (Mali) in June, 0.565 (Mali) and 0.795 (Koundara) in July, 0.520 (Koundara) and 0.744 (Gabu) in August, 0.621 (Gabu) and 0.745 (Gaoual) in September, 0.687 (Gaoual) and 0.747 (Koundara) in October.
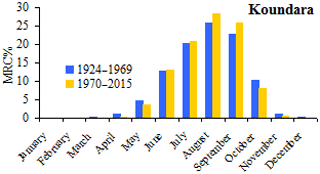
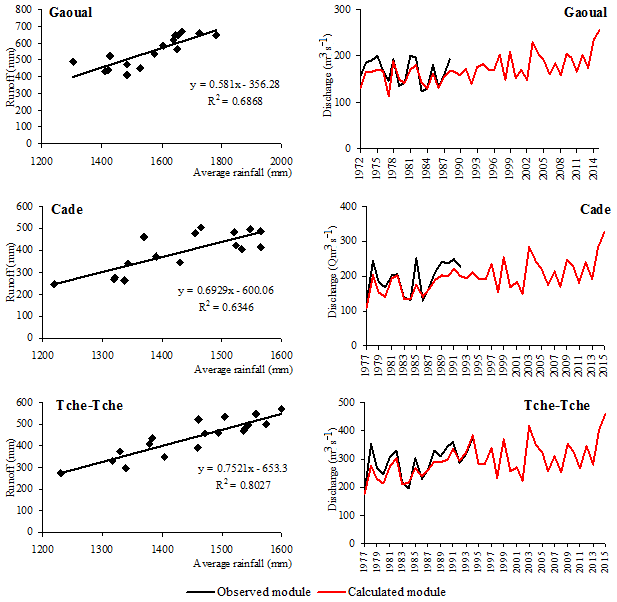
Figure 9Relation between runoff and annual mean rainfall (left panels) and comparative evolution of observed and calculated annual modules (right panels).
The temporal distribution of the MRC shows that the contribution of the monthly to annual total has undergone a significant evolution during the post-break period. In Gabu, the contributions from June to September are greater than those of the first period, whereas in Gaoual, Koundara (Fig. 8), Labe and Mali, they concern three months. The increase of MRC is correlated with that of rainfall. Although nuanced, these results support the recovery of rainfall observed in West Africa in the late 1990s and early 2000s (Sène and Ozer, 2002; Descroix et al., 2015; Sambou et al., 2018). The MRCs for October remain in favor of the pre-break period at all stations.
The average annual rainfall calculated using the inverse square of distance method is used because, according to Vauchel (2000–2004), it gives better results, especially in the case where rainfall stations are not well distributed in space. The results of the correlation indicate a good relationship between the average annual rainfall and the runoff. The determination coefficients (r2) of 0.687 (Gaoual), 0.635 (Cade) and 0.803 (Tche-Tche) show that the runoff is function of rainfall (Fig. 9). But it is noted that some of the average rainfall will be used to reconstitute the water reserves while the other feeds the evapotranspiration. The correlation coefficients (r) are 0.829 at Gaoual, 0.797 at Cade and 0.896 at Tche-Tche respectively. The quality of the relationship allows to extend the timeseries of the runoff, which are then translated into annual modules. The Gaoual modules is extended from 1971–1972 to 2014–2015 and those of Cade and Tche-Tche from 1976–1977 to 2014–2015. Figure 9 shows the variation compared between the annual modules observed and calculated.

7.1 Model performance in calibration and validation
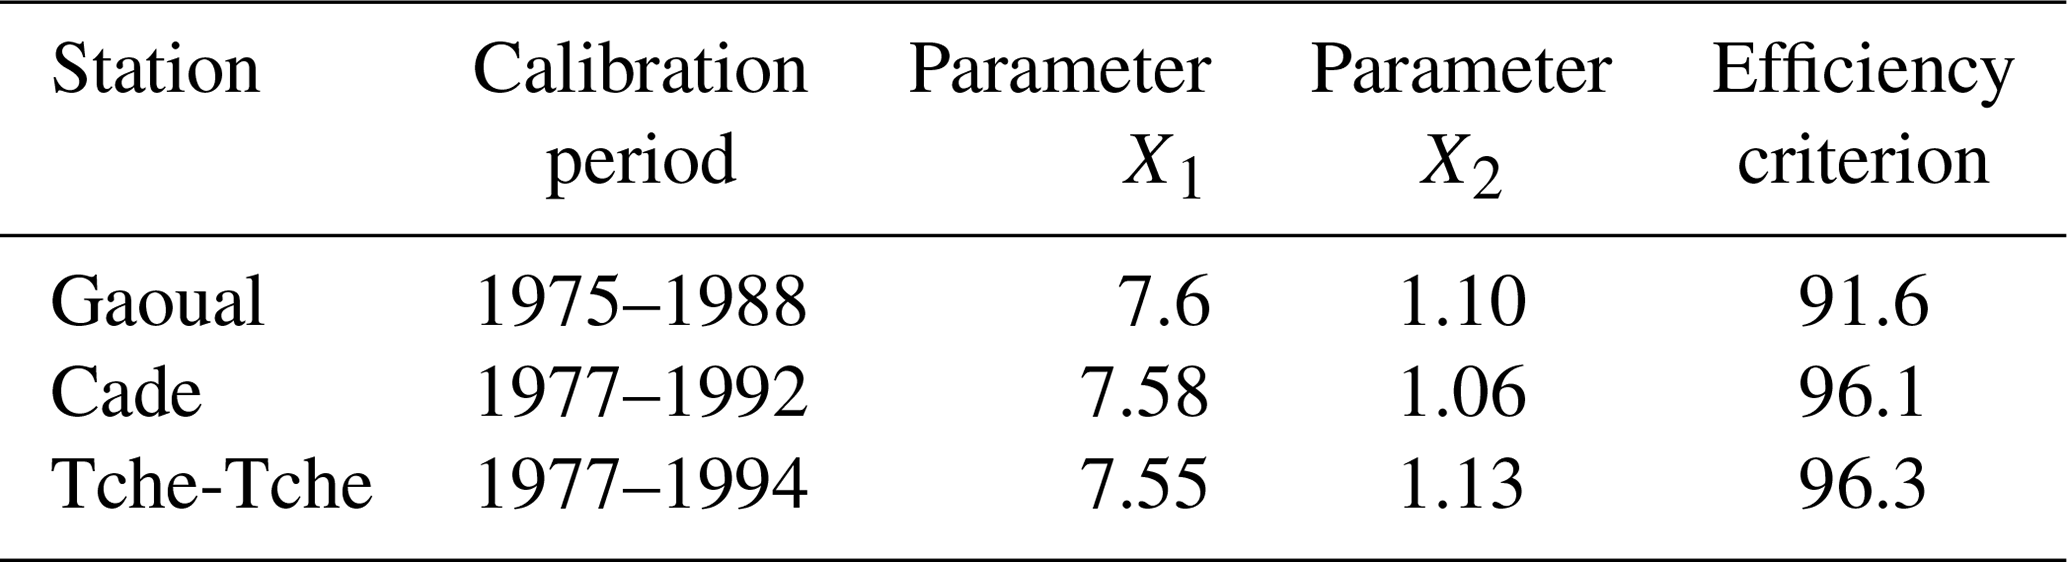
The results in Table 5 show the model parameters that have been optimized and the efficiency criteria obtained after the use in the “Solver” function. The values of the X1 parameters, which are larger, vary from 7.55 to 7.6 while those of X2 range from 1.06 to 1.13. The values of the Nash criteria are sufficiently high in general for the Gaoual (91.6 %), Cade (96.1 %) and Tche-Tche (95.7 %) basins with correlation coefficients of 0.934, 0.944 and 0.973 respectively.
7.2 Simulation of monthly discharge
The model's performance being established, the average monthly rainfall obtained by the inverse square distance method and the PET allowed to simulate the monthly discharges from Koliba/Corubal to Gaoual (1975–2015), Cade and Tche-Tche (1977–2015). The comparison of the observed and simulated discharge allows appreciating the quality of calculated discharge (Ardoin et al., 2002). A first qualitative analysis shows a good reproduction of the observed discharge shape at the three stations (Fig. 10). There is a temporal concordance of the peak discharge with sometimes an underestimation of the simulated discharge for some years with strong runoff. This is observed in 1975, 1981–1982 and 1988 in Gaoual, 1985, 1989 and 1992 in Cade, 1981–1982, 1992 and 1994 in Tche-Tche. Low water levels are more or less well reproduced at Gaoual with the exception of the hydrological years 1983–1984 and 1984–1985, where a slight shift is observed during the dry period. In Cade and Tche-Tche, they are overestimated respectively until 1990 and 1989 before being superimposed with observed discharge.
Considering the underestimation of discharge, a relationship between observed and simulated peak monthly flows is search. The correlation coefficients of 0.796 (Gaoual), 0.781 (Cade) and 0.703 (Tche-Tche) indicate a positive linear relationship between the maximum observed discharge and the maximum simulated discharge. Also, the calculation of the observed and the simulated volumes was carried out. At Gaoual, the correlation coefficient of 0.831 shows that they are close. In Cade and Tche-Tche, however, the correlation coefficient of 0.574 and 0.576 show a deterioration of the relationship. The simulated volumes are overestimated by the model.
In general, the simulated discharge from 1989 to 2015 at Gaoual seem to follow the logic of the recovery of rainfall with a clear improvement in flows in the early 2000s (Fig. 10). At Cade and The-Tche, a strong variability of the flows is observed. The model followed the signal from the dry period 1975–2002.
This study of the hydropluviometric variability of the Koliba/Corubal River watershed highlights interesting results. The use of the regional vector method made it possible to homogenize the data and to calculate values that were used to reconstruct the gap data during some years. The Pettitt test detected breaks in 1958 (Mali), 1967 (Gabu, Gaoual) and 1969 (Koundara, Labe), over the period 1924–2015. The rainfall deficit of the period after break is between 9.7 % in Mali and 20.2 % in Gaoual. The segmentation method identifies a positive break in Gabu, Gaoual and Mali thus reflecting a return to better rainfall conditions, with however a strong interannual variation. The analysis of the MRC after the reconstitution of the missing values is in agreement with the resumption of the rainfall since the contribution of certain months to the annual total evolved greatly during the period post-break.
The hydropluviometric correlation approach gave coefficients of determination of 0.687 for Gaoual, 0.635 for Cade and 0.803 for Tche-Tche. This means that the runoff is function of the average rainfall. The part contributing to a reconstitution of the water reserves and the evapotranspiration not being quantified and considered, can constitute a source of discrepancies between the two variables. The correlation coefficients ranging from 0.797 (Cade) to 0.896 (Tche-Tche) encourages to extend the timeseries of runoff that are finally expressed in annual modules.
The use of the GR2M rain-flow model allowed us to first determine the model parameters that better reflect the transformation of the rain into flow with Nash criteria close to 100. Then, these parameters applied to the data of average rainfall and PET inputs simulated monthly discharge and finally extended the timeseries from Koliba/Corubal to Gaoual, Cade and Tche-Tche. The temporal evolution of the discharge permits to distinguish a phase with a weak flow, and another supported by the resumption of the rainfall.
These results constitute a first step in the knowledge of the Koliba/Corubal River flows with a global conceptual model. They can be useful to Guinea and Guinea-Bissau and especially to the Gambia River Basin Organization for the realization of common development projects and to ensure integrated and concerted transboundary management of resources. This study does not use Bantala, Komba, Tomine and Fefine tributaries due to discrepancies noted at the installed hydrometric stations in these locations. At the end of the analysis of the monthly discharge observed and calculated, other parameters such as river regime, floods, low flows, flow coefficients, can be studied. As perspectives, it would be interesting to extend the study area to the Saltinho station and to refine the flow knowledge with other data and techniques. Access to data at finer scales is difficult; the availability of satellite estimates can be an asset for the simulation of daily discharge which, however, requires historical knowledge that will serve as a reference for the validation of their quality.
Data sets are available at
-
National Meteorology Direction of Guinea (contact: meteogui@leland-gn.org),
-
National Meteorological Service of Guinea-Bissau (contact: dgmeteobissau@yahoo.fr) and
-
OMVG (contact: contact@pe-omvg.org).
SS and HD defined the title, realized the experimental activities, treated the hydrological data, analyzed all the results and wrote the initial manuscript. RND elaborated the mapping from physiographic data and treated the rainfall and evapotranspiration data. ID provided advice and translation of the manuscript into English. AK provided advice and discussions on the context of hydropluviometric variability in West Africa. All authors discussed the results and helped to improve the manuscript.
The authors declare that they have no conflict of interest.
This article is part of the special issue “Hydrological processes and water security in a changing world”. It is a result of the 8th Global FRIEND–Water Conference: Hydrological Processes and Water Security in a Changing World, Beijing, China, 6–9 November 2018.
We are grateful to our reviewers for their suggestions and comments. We also thank all the structures which provided us the data (National Meteorology Direction of Guinea, National Meteorological Service of Guinea-Bissau, and OMVG) and without which this work would not have been realized. We thank FRIEND-Water, UNESCO-IHP, IAHS, IWHR.
Ali, A. Lebel, T., and Amani, A.: Signification et usage de l'indice pluviométrique au Sahel, Sécheresse, 19, 227–235, 2008.
Ardoin, S. Dezetter, A. Servat, E., and Bocquillon, C.: Redéfinition des fonctions de production des modèles globaux de relation pluie-débit en milieu semi-aride africain. Regional Hydrology: Bridging the Gap between Research and Practice, IAHS Publ. no. 274, in: Proceedings of the Fourth International FRIEND Conference held at Cape Town, South Africa, 197–203, 2002.
Ardoin-Bardin, S.: Variabilité hydro-climatique et impacts sur les ressources en eau de grands bassins hydrographiques en zone soudano-sahélien, Thèse de doctorat, Université de Montpellier II, Montpellier, p. 440, 2004.
Bell, V. A., Gedney, N., Kay, A. L., Smith, R. N. B., Jones, R. G., and Moore, R. J.: Estimating Potential Evaporation from Vegetated Surfaces for Water Management Impact Assessments Using Climate Model Output, J. Hydrometeorol., 12, 1127–1136, 2011.
Bodian, A.: Approche par modélisation pluie-débit de la connaissance régionale de la ressource en eau: Application au haut bassin du fleuve Sénégal, Thèse de doctorat, Université Cheikh Anta Diop de Dakar, Dakar, p. 288, 2011.
Bodian, A.: Caractérisation de la variabilité temporelle récente des précipitations annuelles au Sénégal (Afrique de l'Ouest), Physio-Géo – Géographie Physique et Environnement, 8, 297–312, https://doi.org/10.4000/physio-geo.4243, 2014.
Bodian, A. Dezetter, A., and Dacosta, H.: Apport de la modélisation pluie-débit pour la connaissance de la ressource en eau: Application au haut bassin du fleuve Sénégal, Climatologie, 9, 109–125, 2012.
Brunet-Moret, Y.: Test d'homogénéité, Cahiers ORSTOM, série Hydrologie, XIV, 119–129, 1977.
Brunet-Moret, Y.: Homogénéisation des précipitations, Cahiers ORSTOM, série Hydrologie, XVI, 147–170, 1979.
Claude, J.: Données hydrologiques nécessaires pour une campagne de lutte contre l'onchocercose dans la région du bassin du fleuve Sénégal, Rapport préliminaire, OMS, ORSTOM, Centre ORSTOM de Ouagadougou, p. 57, 1980.
Dai, A., Trenberth, K. E., and Karl, T. R.: Global variations in droughts and wet spells: 1900–1995, Geophys. Res. Lett., 25, 3367–3370, 1998.
Descroix, L., Diongue Niang, A., Dacosta, H., Panthou, G., Quantin, G., and Diédhiou, A.: Evolution des pluies de cumul élevé et recrudescence des crues depuis 1951 dans le bassin du Niger Moyen (Sahel), Climatologie, 10, 37–49, 2013.
Descroix, L., Diongue Niang, A., Panthou, G., Bodian, A., Sané, Y., Dacosta, H., Malam Abdou, M., Vandervaere, J.-P., and Quantin, G.: Évolution récente de la pluviométrie en Afrique de l'Ouest à travers deux régions: La Sénégambie et le bassin du Niger Moyen, Climatologie, 12, 25–43, 2015.
Diello, P.: Interrelations Climat–Homme–Environnement dans le Sahel Burkinabé : impacts sur les états de surface et la modélisation hydrologique, Thèse de doctorat, Université de Montpellier II, Montpellier, p. 395, 2007.
Gogien, F.: Application d'un modèle pluie-débit à un bassin versant de Tunisie Centrale: essai de prise en compte de la variabilité spatio- temporelle de la pluie, Mémoire de DAA, LPSNGR/ENSA de Rennes, Rennes, p. 119, 1998.
Haidu, I.: Comparaison entre tests statistiques concernant le changement climatique global, in: XIXe Colloque de l'Association Internationale de Climatologie, Actes du colloque d'Épernay, 6–9 September 2006, d'Épernay, 282–287, 2006.
Hiez, G.: Homogénéisation des données pluviométriques, Instructions de calculs pour la programmation, Éit. SUDENE-UNESCO, p. 19, 1969.
Hiez, G.: Homogénéisation des données pluviométriques, in: Cahiers ORSTOM, série Hydrologie, Vol. XIV, 1977.
Hiez, G., Rancan, L., Barros, M. C., and Pedrollo, O.: Le vecteur régional et les fluctuations climatiques, in: Actes des Deuxièmes journées hydrologiques de l'ORSTOM (Montpellier, 1986), Édit. ORSTOM, collection “Colloques et séminaires”, Paris, 101–116, 1987.
Hiez, G. Cochonneau, G. Sechet, P., and Fernandez, U. M.: Application de la Méthode du Vecteur Régional à l'analyse de la pluviométrie annuelle du bassin amazonien, Veille climatique satellitaire, 43, 39–52, 1992.
Hubert, P. and Carbonnel, J. P.: Approche statistique de l'aridification de l'Afrique de l'Ouest, J. Hydrologie, 95, 165–183, 1987.
Hubert, P., Carbonnel, J. P., and Chaouche, A.: Segmentation des séries hydrométéorologiques : application à des séries des précipitations et de débits de l'Afrique de l'ouest, J. Hydrologie, 110, 349–367, 1989.
Hufty, A.: Orientations et vocabulaire de la climatologie (1988–1992), Publications de l'Association Internationale de Climatologie, 7, 15–23, 1994.
IRD: KhronoStat version 1.0, Logiciel, IRD, Montpellier, availabl at: http://www.hydrosciences.org/spip.php?article239 (last access: 12 March 2009), 1998.
Kouassi, A. M., Kouamé, K. F., Kofi, Y. B., Dje, K. B., Paturel, J. E., and Oularé, S.: Analyse de la variabilité climatique et de ses influences sur les régimes pluviométriques saisonniers en Afrique de l'Ouest: cas du bassin versant du N'zi (Bandama) en Côte d'Ivoire, Cybergeo: European J. of Geography, Environnement, Nature, Paysage, available at: http://cybergeo.revues.org/23388 (last access: 12 July 2018), 2010.
Lebel, T. and Ali, A.: Recent trends in the Central and Western Sahel rainfall regime (1990–2007), J. Hydrol., 375, 52–64, 2009.
L'Hôte, Y.: Contrôle de la qualité et de l'homogénéisation des données pluviométriques par la méthode du vecteur des indices annuels de précipitations, Zürcher Geographische Schriften, 23, 37–51, 1986.
Lubès, H., Masson, J. M., Servat, E., Paturel, J.-E., Kouamé, B., and Boyer, J. F.: Caractérisation de fluctuations dans une série chronologique par application de tests statistiques, Etude bibliographique, Programme ICCARE, Rapport no. 3, ORSTOM, Hydrologie, Montpellier, France, 1994.
Mahé, G., Paturel, J. E., Servat, E., Conway, D., and Dezetter, A.: Impact of land use change on soil water holding capacity and river modeling of the Nakambe River in Burkina-Faso, J. Hydrol., 300, 33–43, 2005.
Monteith, J.: Evaporation and environment, Symp. Soc. Exp. Biol., 19, 205–234, 1965.
Mouelhi, S.: Vers une chaîne cohérente de modèles pluie-débit conceptuels globaux aux pas de temps pluriannuel, annuel, mensuel et journalier, Thèse de Doctorat, ENGREF, Cemagref Antony, France, p. 323, 2003.
Mouelhi, S., Michel, C., Perrin, C., and Andréassian, V.: Stepwise development of a two-parameter monthly water balance model, J. Hydrol., 318, 200–214, https://doi.org/10.1016/j.jhydrol.2005.06.014, 2006.
Nash, J. E. and Sutcliffe, J. V.: River flow forecasting through conceptual models. Part I – A discussion of principles, J. Hydrol., 10, 282–290, 1970.
Niang, A. J.: Les processus morphodynamiques, indicateurs de l'état de la désertification dans le Sud-Ouest de la Mauritanie. Approche par analyse multisource, Thèse de Doctorat, Université de Liège, Liège, Belgique, p. 286, 2008.
Oudin, L.: Recherche d'un modèle d'évapotranspiration potentielle pertinent comme entrée d'un modèle pluie-débit global, Thèse de doctorat, ENGREF (AgroParisTech), Paris, p. 496, 2004.
Ouoba, A. P.: Changements climatiques, dynamique de la végétation et perception paysanne dans le Sahel burkinabè, Thèse de Doctorat Unique, Université de Ouagadougou, Ouagadougou, Burkina Faso, p. 305, 2013.
Panthou, G.: Analyse des extrêmes pluviométriques en Afrique de l'Ouest et de leur évolution au cours des 60 dernières années, Thèse de doctorat, UJF – Grenoble 1, Grenoble, p. 282, 2013.
Paturel, J. E., Servat, E., and Vassiliadis, A.: Sensitivity of conceptual rainfall-runoff algorithms to errors in input data – case of the GR2M model, J. Hydrol., 168, 11–125, 1995.
Paturel, J. E., Servat, É., Lubès-Niel, H., Kouamé, B., Travaglio, M., Lubès, H., Marieu, B., and Masson, J. M.: Variabilité des régimes pluviométriques et hydrologiques en cette fin de siècle en Afrique de l'Ouest et centrale non sahélienne, Sud-Sciences et Technologies, 2, 44–52, 1998.
Penman, H. L.: Natural Evaporation from open water, bare soil and grass, P. Roy. Soc. Lond. A, 193, 120–145, 1948.
Pettitt, A. N.: A non-parametric approach to the change-point problem, Appl. Stat., 28, 126–135, 1979.
Quentin, A.: Etude de la variabilité interannuelle de l'évaporation potentielle : conséquence sur les prévisions de l'impact hydrologique du changement climatique, Master 2, Sciences de l'Univers, Environnement, Ecologie, Université Pierre et Marie Curie, p. 50, 2015.
Sambou, S. Dacosta, H., and Paturel, J. E.: Variabilité spatio-temporelle des pluies de 1932 à 2014 dans le bassin versant du fleuve Kayanga/Gêba (République de Guinée, Sénégal, Guinée-Bissau), Physio-Géo, 12, 61–78, 2018.
Sarr, B. and Lona, I.: Les fortes pluies enregistrées au Sahel au cours de l'hivernage 2007: variabilité et/ou changement climatique, 14ème Colloque International, SIFEE “Changement climatique et évaluation environnementale” Outils et enjeux pour l'évaluation des impacts et l'élaboration des plans d'adaptation, Centre Régional Agrhymet, Département Formation et Recherche, Niamey, Niger, p. 9, 2009.
Sène, S. and Ozer, P.: Évolution pluviométrique et relation inondations-événements pluvieux au Sénégal, Bulletin de la Société Géographique de Liège, 42, 27–33, 2002.
Servat, É. Paturel, J. E., Kouamé, B., Travaglio, M., Ouedraogo, M., Boyer, J. F., Lubès-Niel, H., Fritsch, J. M., Masson, J. M., and Marieu, B.: Identification, caractérisation et conséquences d'une variabilité hydrologique en Afrique de l'Ouest et Centrale, in: Water Resources Variability in Africa during the XX thème 123 siècle: Century (Abidjan'98 Conference), Publication AISH no. 252, edited by: Servat É., Hugues, D. Fritsch, J. M., and Hulme, M., 323–337, 1998.
Servat, É. Paturel, J. E., Lubès-Niel, H., Kouamé, B., Masson, J. M., Travaglio, M., and Marieu, B.: De différents aspects de la variabilité de la pluviométrie en Afrique de l'Ouest et Centrale, Revue des Sciences de l'Eau, 12, 363–387, 1999.
Smith, M.: CROPWAT a computer program for irrigation planning and management, FAO Irrigation and Drainage, Paper no. 46, FAO, Rome, Italy, 1992.
SOFRECO: Etude du Schéma Directeur d'aménagement et de développement intégré des bassins des fleuves Kayanga/Gêba et Koliba/Corubal, Ressources et besoins en eau et option d'aménagement hydraulique et hydro-agricole, in: Vol. 3, Annexe B, Senegal, 1993.
Spearman, C.: The proof and measurement of association between two things, Am. J. Psychol., 15, 72–101, 1904.
Vauchel, P.: Logiciel Hydraccess. En ligne, availalb eat: http://www.ore-hybam.org/index.php/fre/Software/Hydraccess (last access: 23 June 2008), 2004.
Zoumanigui, K.: Base de données géoréférencées sur l'utilisation des terres en Guinée, Rapport final, FAO, Irag, p. 32, 2003.
- Abstract
- Introduction
- Data and methods
- Methods
- Results
- Evolution in monthly rainfall according to Pettitt's test
- Hydropluviometric correlation results
- Modeling results
- Conclusion and perspectives
- Data availability
- Author contributions
- Competing interests
- Special issue statement
- Acknowledgements
- References