the Creative Commons Attribution 4.0 License.
the Creative Commons Attribution 4.0 License.
 | 16 Sep 2020
Modeling hydrologic processes and potential responses to climate change in an agro-silvo-pastoral watershed in the Mediterranean area
Youssef Brouziyne
Lahcen Benaabidate
Aziz Abouabdillah
Rachid Bouabid
Abdelghani Chehbouni
Precipitation changes and water use patterns are two factors affecting the water quantity; obviously, hydrologic processes are always linked to many elements in the watershed scale, so to understand water management issues it is fundamental to analyze the different elements of hydrologic processes occurring in the watershed. In this study, the “SWAT” model (Soil and Water Assessment Tool) has been used to simulate the water balance for the present climate conditions on a semi arid watershed located in the central North of Morocco (R'dom). The study watershed covers an area of 1993 km2, and is hosting farming, pasture and forestry related activities. The water stress situation in the R'dom watershed can be summarized as limited resource facing increasing water demand. SWAT model was first run and calibrated under current climate; and was driven with downscaled climate simulations to generate future hydrological projections for R'dom watershed in the 2031 to 2050 horizon under two Representative Concentration Pathways (RCPs): 4.5 and 8.5. The results of the study showed that the water balance in R'dom watershed is dominated by evapotranspiration and the water resources distribution within the watershed is uneven and follows a decreasing gradient matching the flow direction. The main results of climate change scenarios showed that R'dom watershed will undergo significant decrease of water resources availability with more economic impact under the scenario RCP8.5 as all areas hosting the economical activities will be affected and the highest changes of water yield should be under this scenario.
- Article
(2735 KB) - Full-text XML
- BibTeX
- EndNote


The consequences of climate change on water cycle vary greatly from region to other. The IPCC (2019) estimates that streamflows should increase in high latitudes (such as in Northern Europe) and in certain tropical regions, but should decrease in lower latitudes (in particular in the Mediterranean region and in the subtropical zones).
Water resources in the Mediterranean region are particularly vulnerable to human activities; increase of populations, tourism and agriculture development, industrial growth are some examples of challenges faced by water resources in this area. In addition to these factors, climate change represents a further threat that can have a significant impact on hydrology in the Mediterranean area (Abouabdillah et al., 2010).
While the main purpose behind the use of models is to simulate a part of reality at the best possible approximation, many of conceptual models are useful for understanding a particular problem or for predicting the behaviors of a system in the future (Krysanova and Srinivasan, 2015). In addition to the use of models to interpret the complexity of a situation, results can sometimes be extrapolated to larger spatial or temporal scales or higher levels of organization with similar conditions (Abouabdillah et al., 2014; Moriasi et al., 2007).
Soil and Water Assessment Tool (SWAT) is a hydrological modeling program designed by the United States Department of Agriculture (Arnold et al., 1998). This model simulates the production of water and sediments in large-scale watersheds, complex basins, with different soil types, and uses and management conditions; it also simulates the effect of agriculture practices or any other business activity can have on water quality (Arnold et al., 2012; Moriasi et al., 2007).
SWAT model has never been applied in R'dom catchment, and its use on this watershed under climate change context is expected to reproduce the hydrological cycle components within different emission scenarios to simulate future conditions that would affect one or more of the physical processes involved in the water cycle.
In this case, the R'dom catchment is a natural unit in which forestry and agricultural activities are cohabitating and represent a typical basin for a big part of the Mediterranean area in terms of challenges faced by water resources from both quantity and quality aspects.
The main purpose of this work is assessing water resources in R'dom watershed under two RCP scenarios downscaled from a regional circulation model in the near future (2031 to 2050) as a first millstone of 21st century investigations. The selected RCPs were picked to cover the realistic scenario of greenhouse gas concentration trajectory (RCP4.5) and the pessimistic one (RCP8.5).
SWAT model has been used to simulate different processes in the study area using the two RCP scenarios data with a focus on streamflow response at sub-basins levels. Results will help to understand potential climate change impacts on water resources in a typical agro-forestry watershed in the Mediterranean area, and will contribute to future water resources management strategies in any watershed similar to R'dom.
3.1 Study area
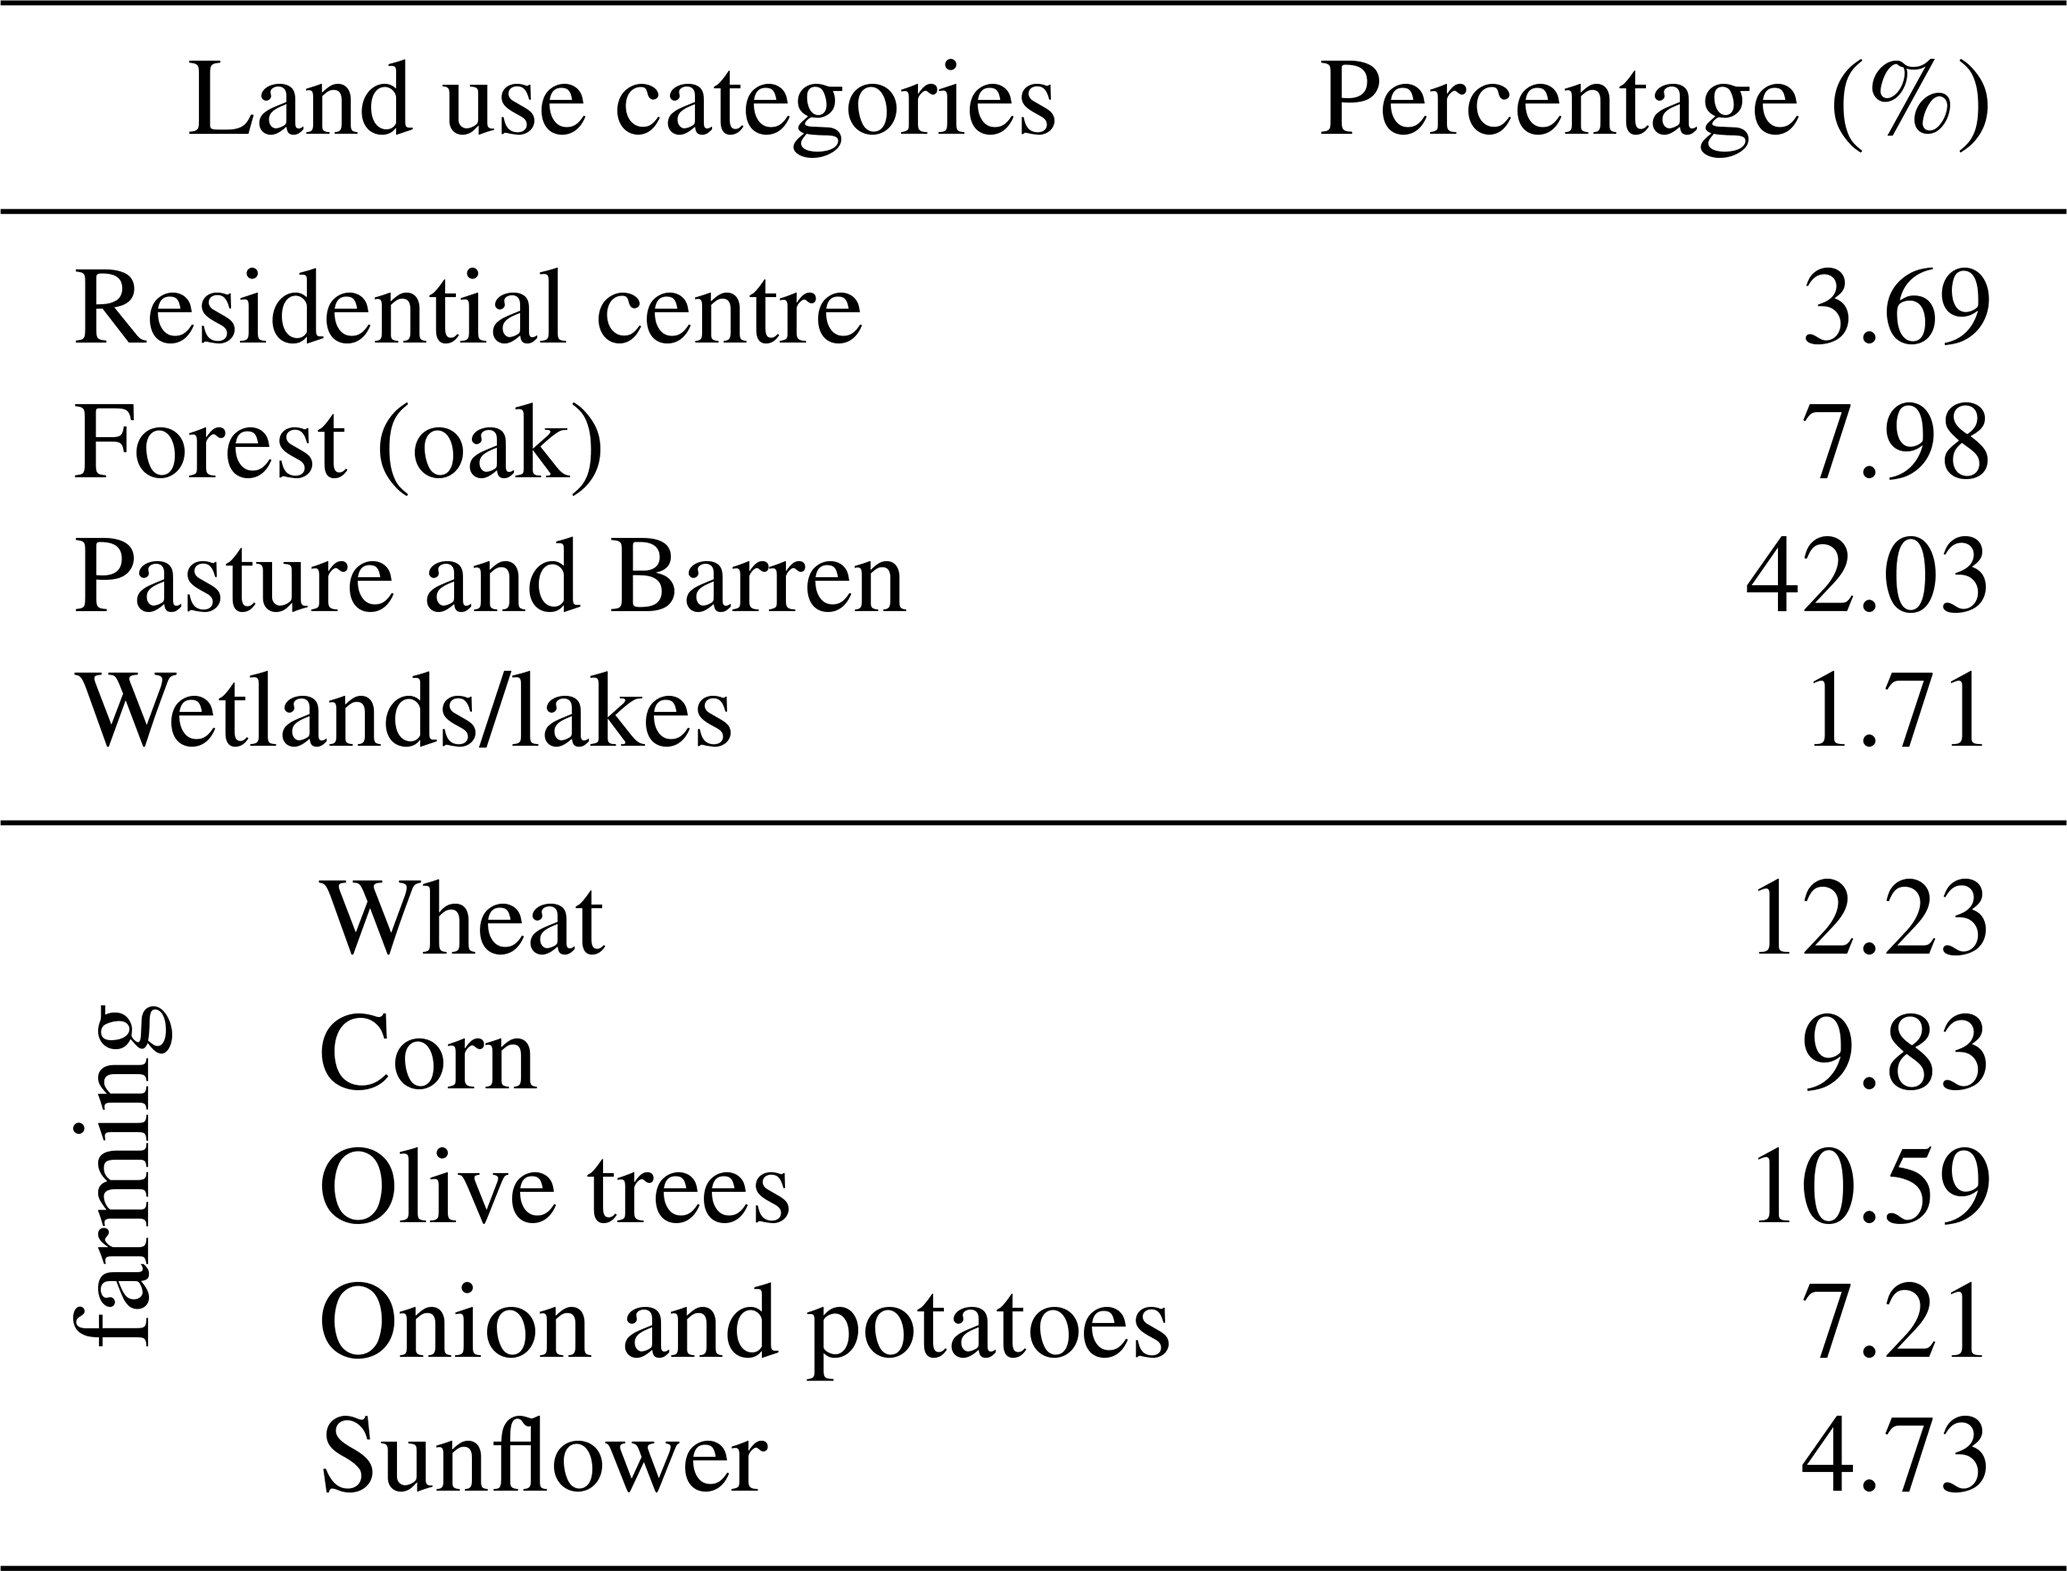
Located in the north eastern of Morocco, R'dom watershed is covering an area of 1993 km2 and includes two large plains (Saiss and Gharb). Being a part of one of the largest hydrologic watersheds in Morocco (Sebou basin), R'dom watershed is characterized by a semi-arid climate and has a big socio-economic importance due to the activities held inside it (farming and forestry activities) (Table 1).
Table 1Occupation percentages of major land covers in R'dom watershed.
3.2 Model presentation
SWAT model gives chance to simulate a large number of physical processes in the basin through the division of the basin to several sub-basins based on a threshold area value depending on the accuracy and the objectives of the study (Arnold et al., 2012). Sub-basins are then divided into hydrological response units (HRU) that represent a unique combination of soil type, land cover and slope. The subdivision of the watershed allows the model to reflect different hydrologic processes occurring at the level of each unit (evapotranspiration, percolation, runoff …) (Neitsch et al., 2002).
As all HRUs are connected and runoff drainage simulation is based on slope (Lu et al., 2015), the basin water balance was studied in the basin outlet where measured flow out data are available (Souk Elhad gauge: x=465943, y=410043).
3.3 Input data collection and preparation
Being a very important step of any modeling work, data collection and preparation for this study was performed with high precision in order to run SWAT with a start conditions reflecting the reality as much as possible.
For the topographic characterization of the study watershed, digital elevation model (DEM) of R'dom basin has been extracted from the Shuttle Radar Topography Mission (SRTM) with a resolution of 30 meters.
SWAT soil database was updated by soil parameters of R'dom watershed based on findings of the Agriculture Minister' studies on soil types of the area of Meknes-El Hajeb- Sidi Kacem (Soils study at 1:100 000 scale in the district of Meknes for farming development – 1989).
A couple of soil parameters (such as: Saturation hydraulic conductivity and Field capacity …) were meant to be calculated using an addition calculation program (Soil Water Characteristics software ©, Version 6.02.74).
Land cover of R'dom basin was built based on satellite image processing; after fields surveys in the main catchment area to have preliminary insight about field situation, two LANDSAT8 image scenes (taken on 2 April 2015) were processed using ERDAS Imagine 2014 and ArcGis 10.2.2. Supervised classification method was used by creating land use classes based on their respective spectral signals.
Farming practices features were amended according to the real agronomic practices held in R'dom watershed, especially the operations that can have an effect on water cycle such as: start and end of season dates, irrigation amount, tillage machinery and frequency … etc.
Observed weather parameters were imported to the SWAT and that included daily temperature (max and min) records from 9 weather stations and daily rainfall from 4 recording stations in and around the watershed. Inputs data series were from January 2003 to December 2010.
3.4 SWAT simulation
3.4.1 SWAT parameterization on study catchment
Watershed delineation tool of ArcSWAT has been used to delineate sub-basins based on Digital Elevation Model (DEM) data. 27 connected sub-watersheds were identified and stream network of R'dom basin was defined. Watershed outlet was manually added to match the geographic location of Souk Elhad gauge (Fig. 1); the selected station where flow out process will be monitored to compare measured and predicted flows.

Figure 1Digital elevation model of R'dom watershed.
3.4.2 SWAT calibration and validation
In overall SWAT was run over the period of January 2004 to December 2009, the first two years have been allocated to warm up process, the period January 2006 to December 2007 was dedicated to model calibration. Validation was performed over the period January 2008 to December 2009.
For efficient calibration operation, sensitivity analysis was carried out based on relative sensitivity equation to identify the most influential SWAT parameters to focus on during the calibration process.
The used equation of relative sensitivity is (Haan, 2002):
where Sr is the relative sensitivity; OP+ΔP are model outputs with the input parameter being studied, set at the base value (equal to the initial calibrated value) plus a specified percentage (often taken to be between 10 % and 25 %; OP−ΔP are model outputs with the input parameter being studied, set at base minus a specified percentage (often taken to be between 10 % and 25 %); OP is the model output with input parameter set at the base value; ΔP is the prescribed absolute change in the value of the input parameter and P is the initial calibrated value (base value) of the input parameter.
Following sensitivity analysis, Streamflow was examined during the calibration process. A maximal agreement between observed and predicted water budget components was the ultimate goal. This agreement was monitored by two parameters indicating the statistical goodness-of-fits and the optimization of the objective functions of this study.
The used statistics tests are:
and:
where Oi is the observed water yield for time period i; Pi is the simulated value for the same period; Oavg is the mean of observed water yield per time period and n is the number of time periods.
The Nash–Sutcliffe coefficient (NSE) represents the model's precision in simulating the flood streamflow; the maximum NSE value is 1.0 and occurs if predicted values are perfectly matching measured ones, The determination coefficient, R2, provides an idea about how well is the correlation between and simulated values (Arnold et al., 2012; Viola et al., 2009).
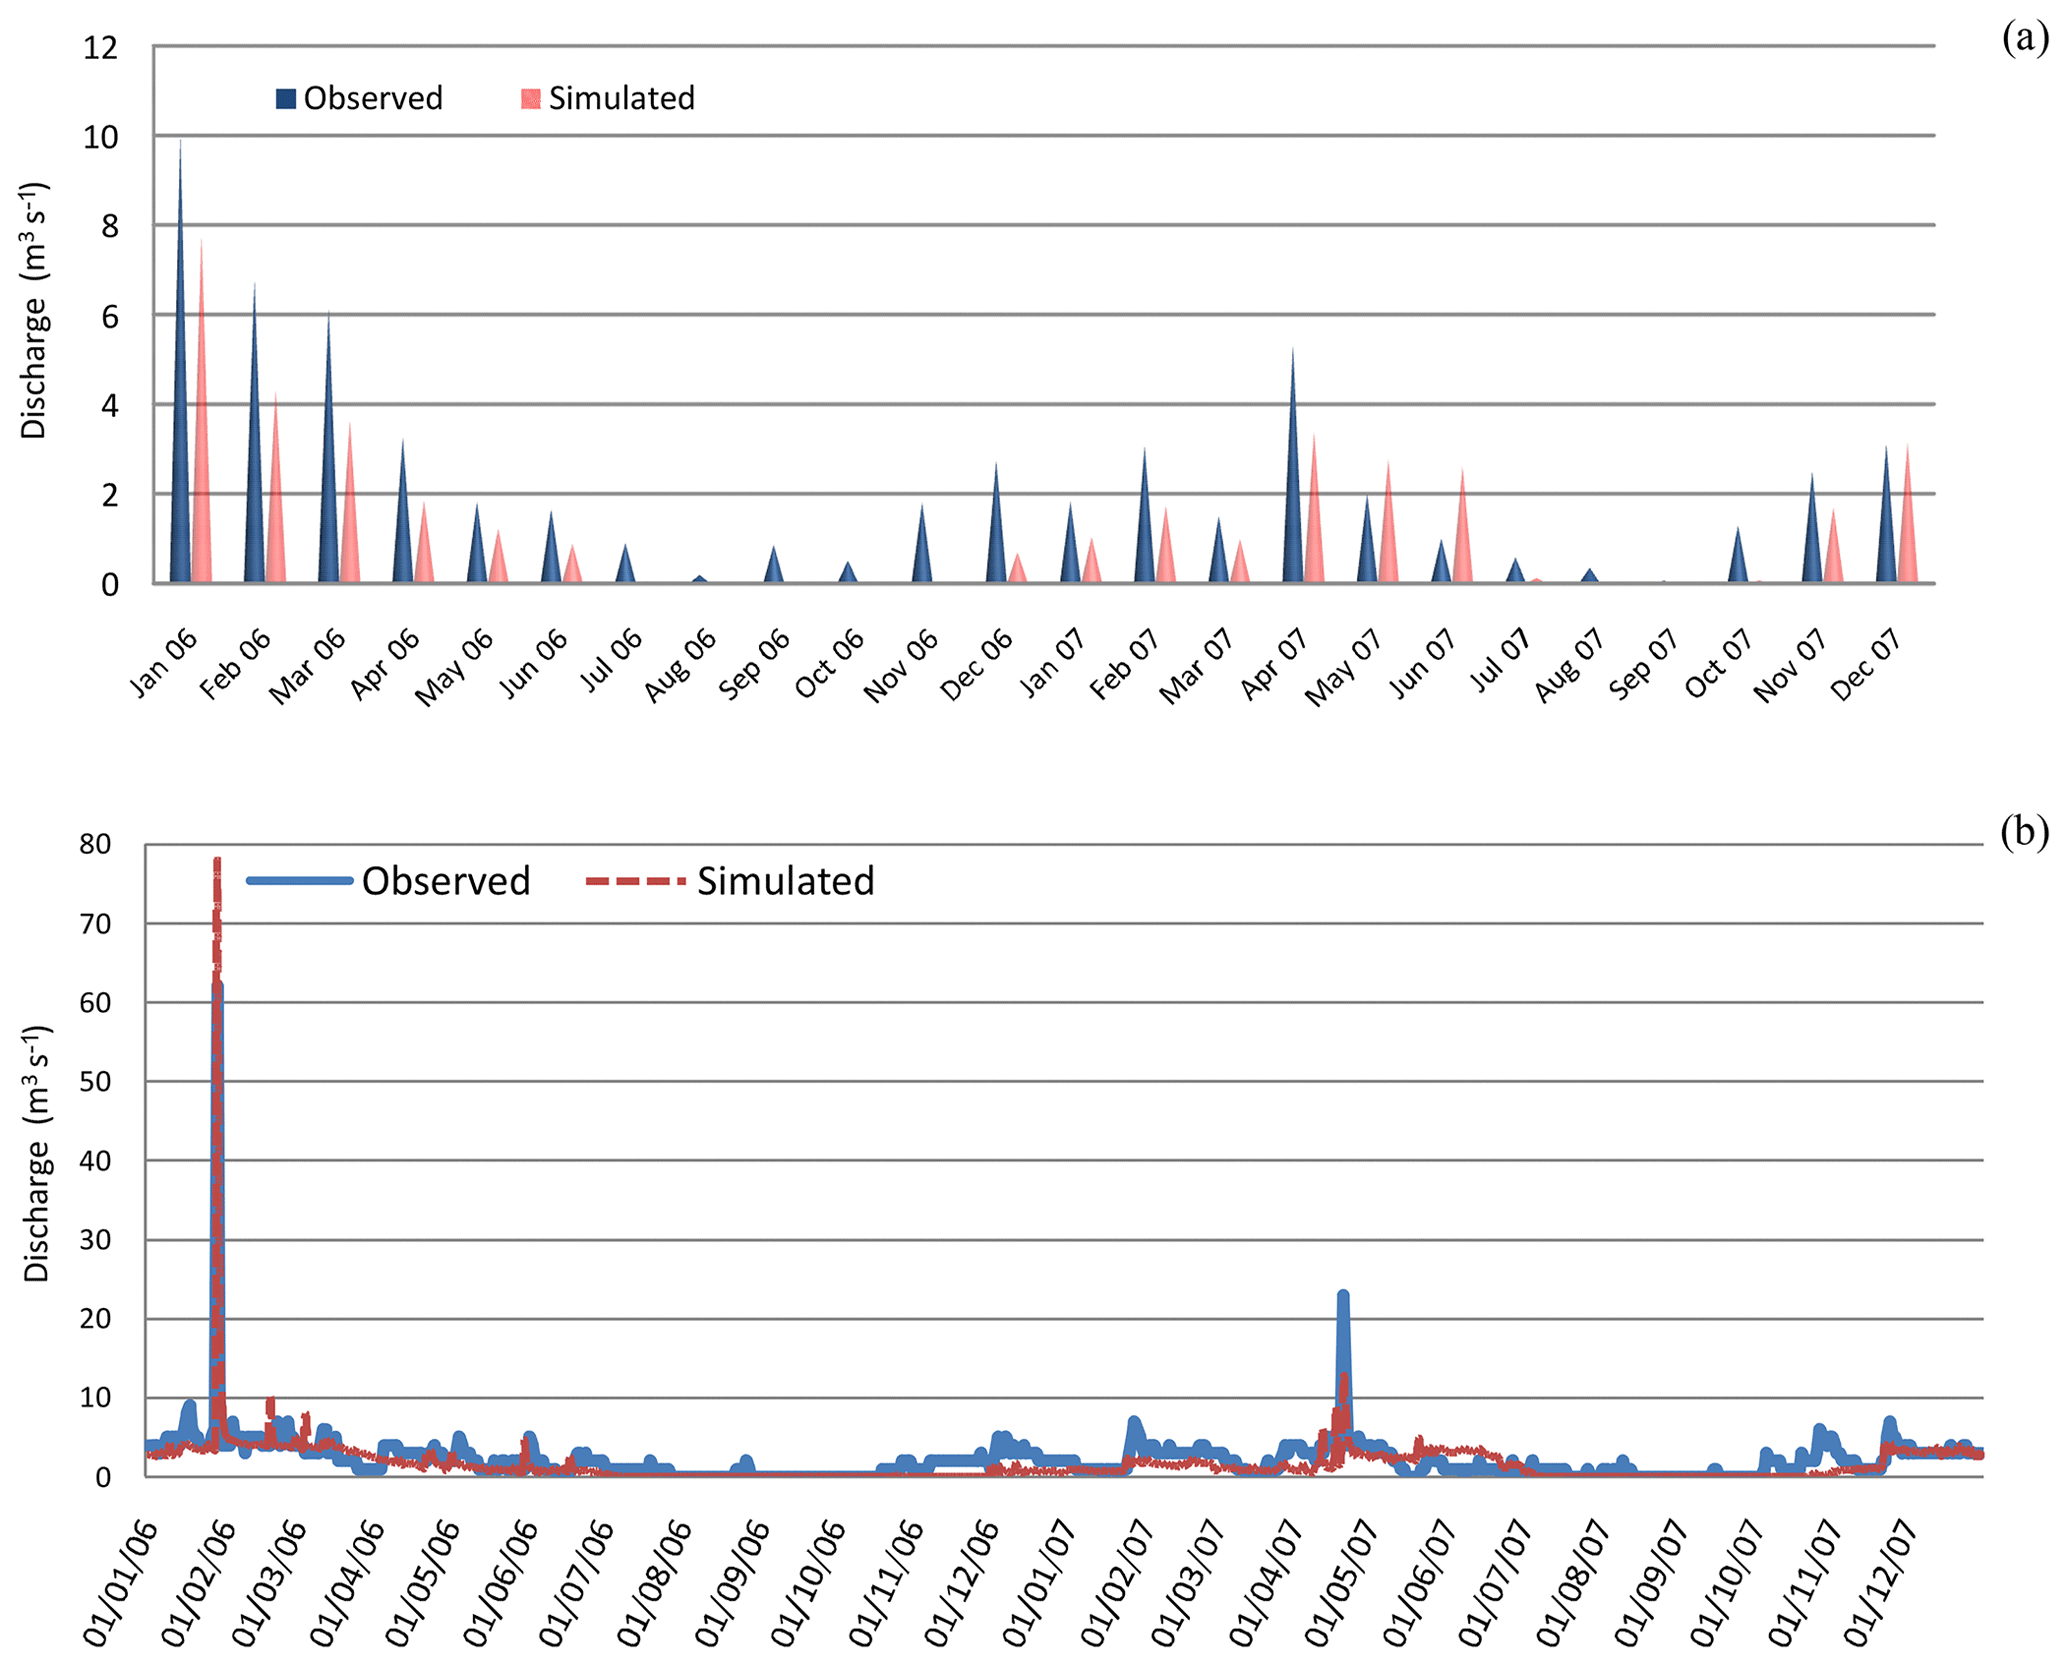
Figure 2Observed Vs simulated monthly (a) and daily (b) discharge after manual calibration at the Souk Elhad flow gage.
3.4.3 Future climate data and model scenarios
The selected climate change scenarios for this study were generated from the output of the global climate model CNRM CM5 (Centre National de Recherches Meteorologique) based on IPCC Assessment Report (AR5). There are 4 different types of Representative Concentration Pathways (RCPs): RCP2.6, RCP4.5, RCP6.0 and RCP8.5 that represent different alternatives of global development (Kim et al., 2013). The CNRM participated in the Coordinated Regional Climate Downscaling Experiment (CORDEX) with different Regional Climate Models (RCMs) (Dosio, 2016).
In this study, the downscaled RCM CLMcom-CCLM and two RCPs (4.5 and 8.5) were used. Grid size was 12.5 km and the baseline was from January 1981 to December 2005. The future simulation period for both precipitations and temperature (max and min) was from January 2031 to December 2050. Linear scaling and variance scaling approaches were used during the bias correction in order to show some levels of bias against real measured precipitation and temperature data respectively.
4.1 SWAT model application
4.1.1 Sensitivity analysis and calibration
After investigation of relative sensitivity of twelve different SWAT input parameters for flow, 4 parameters were revealed as the most influential (Table 2) with different sensitivity degrees.
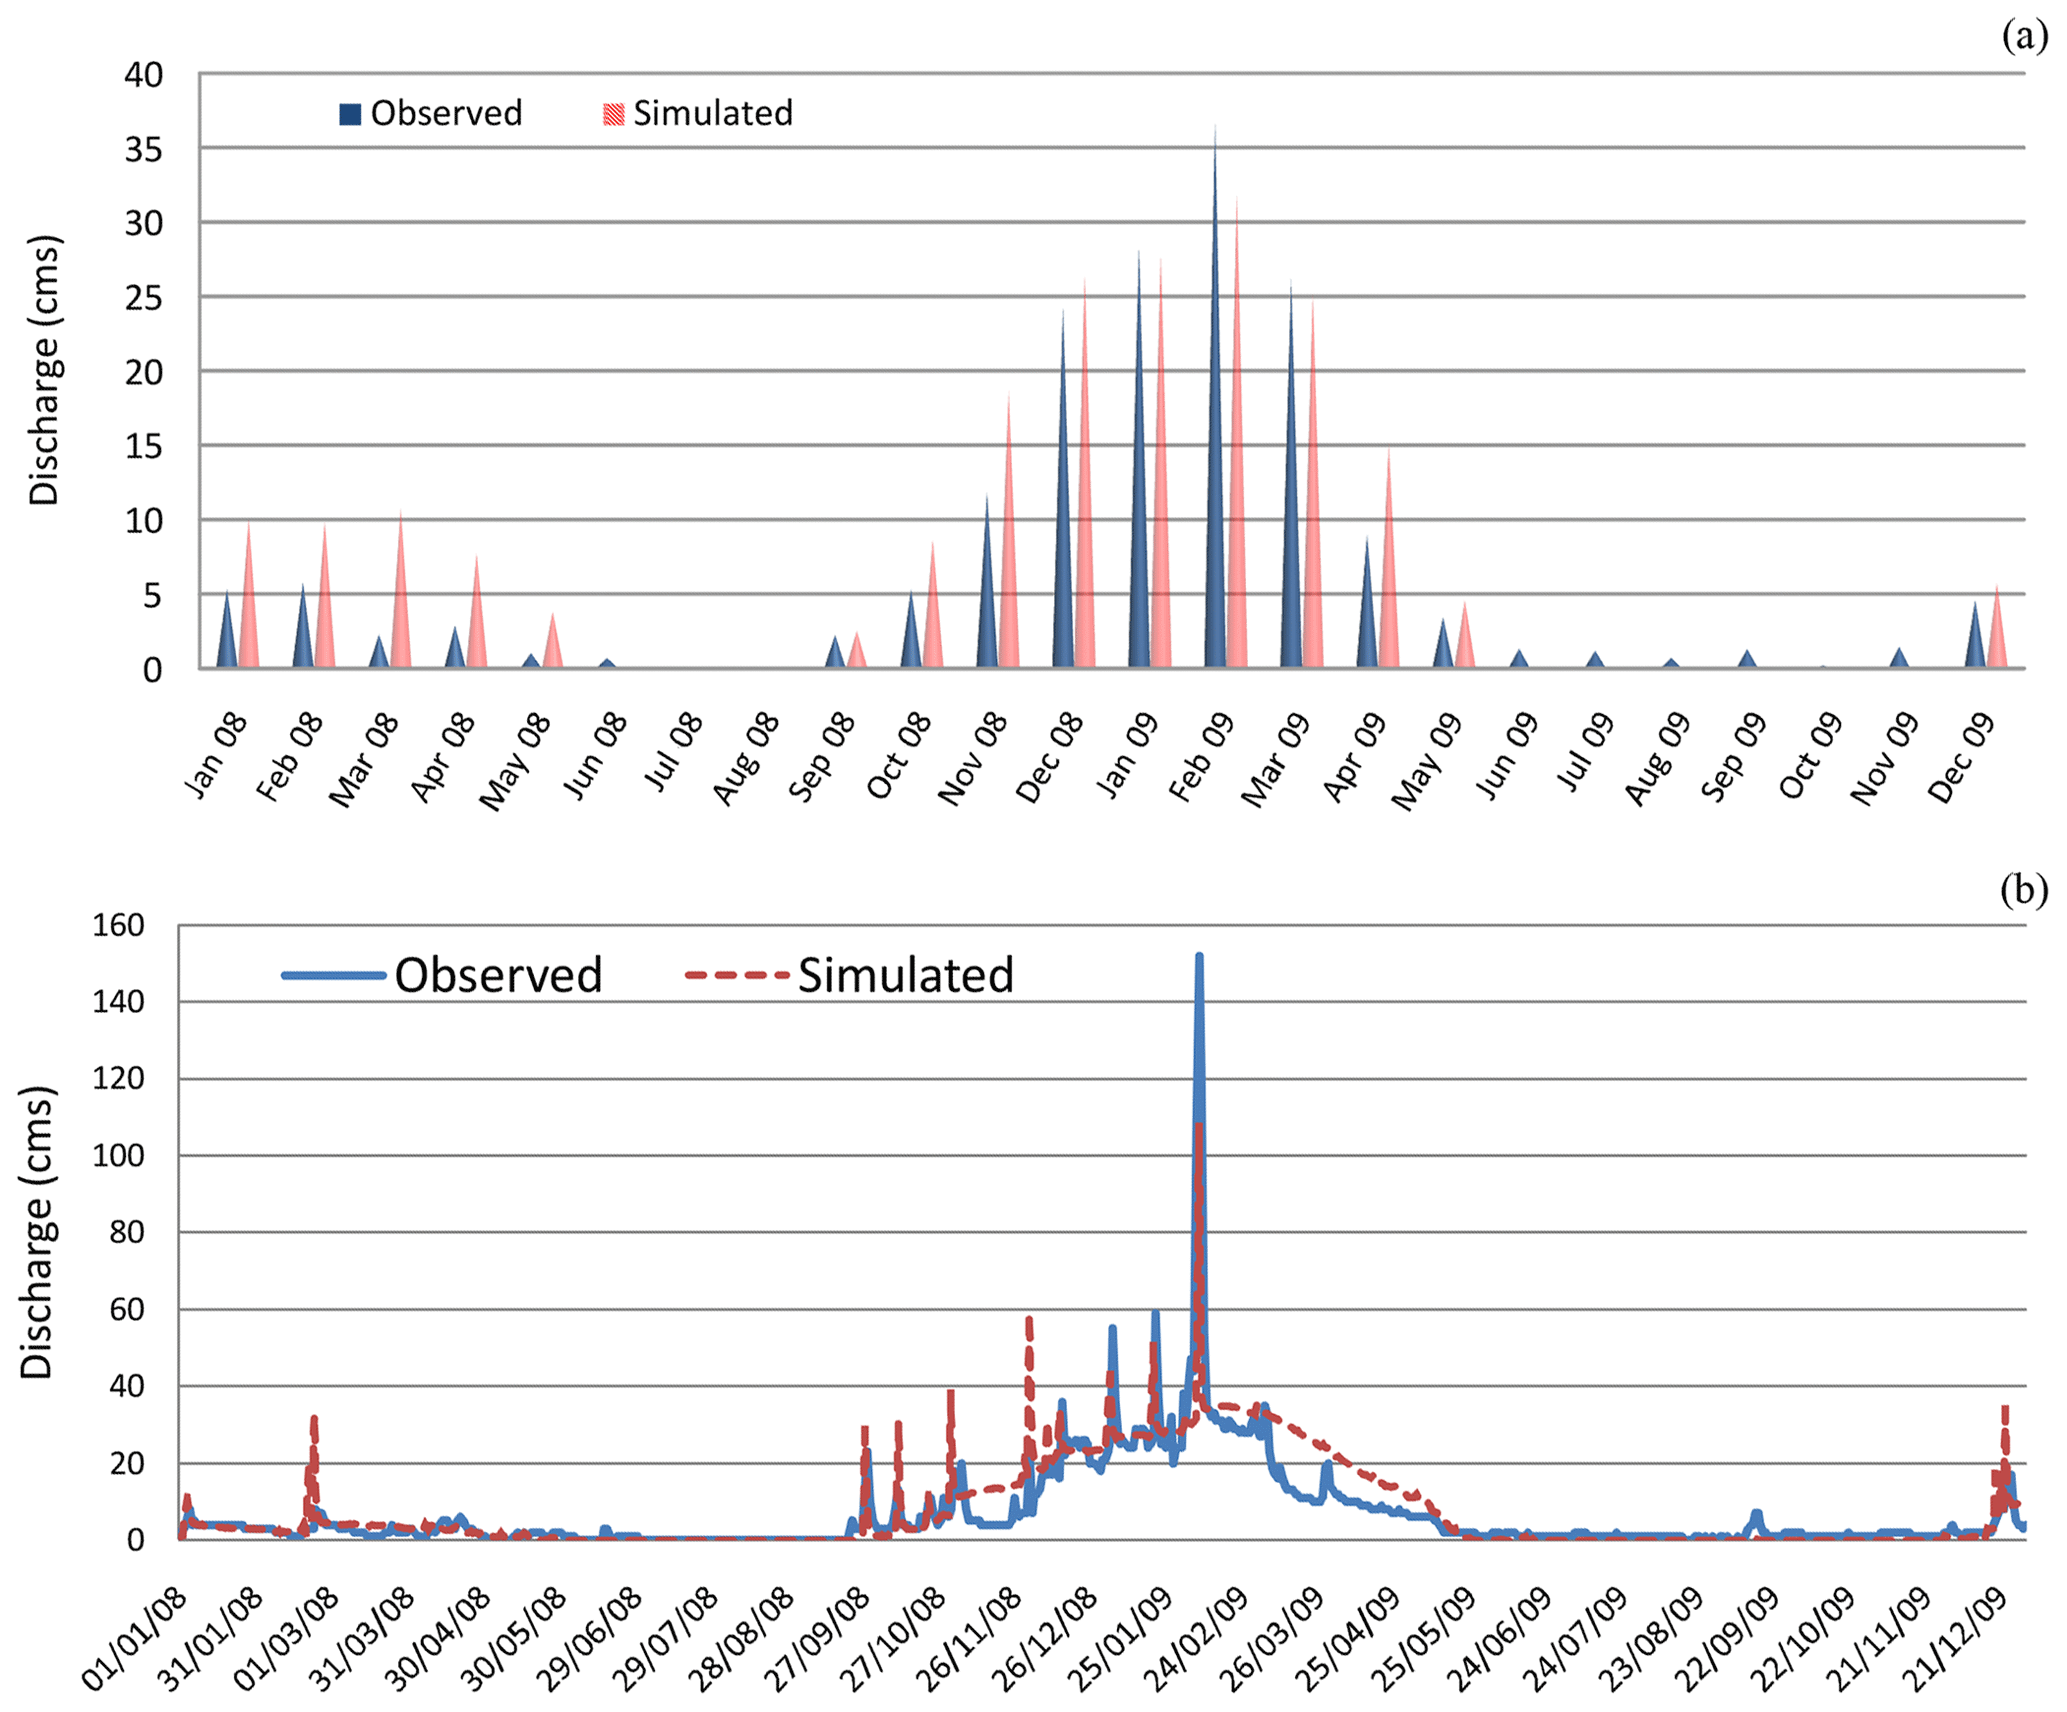
Figure 3Observed Vs predicted monthly (a) and daily (b) discharge during the validation period at the Souk Elhad flow gage.
Table 2Relative sensitivity values for all tested SWAT input parameters.
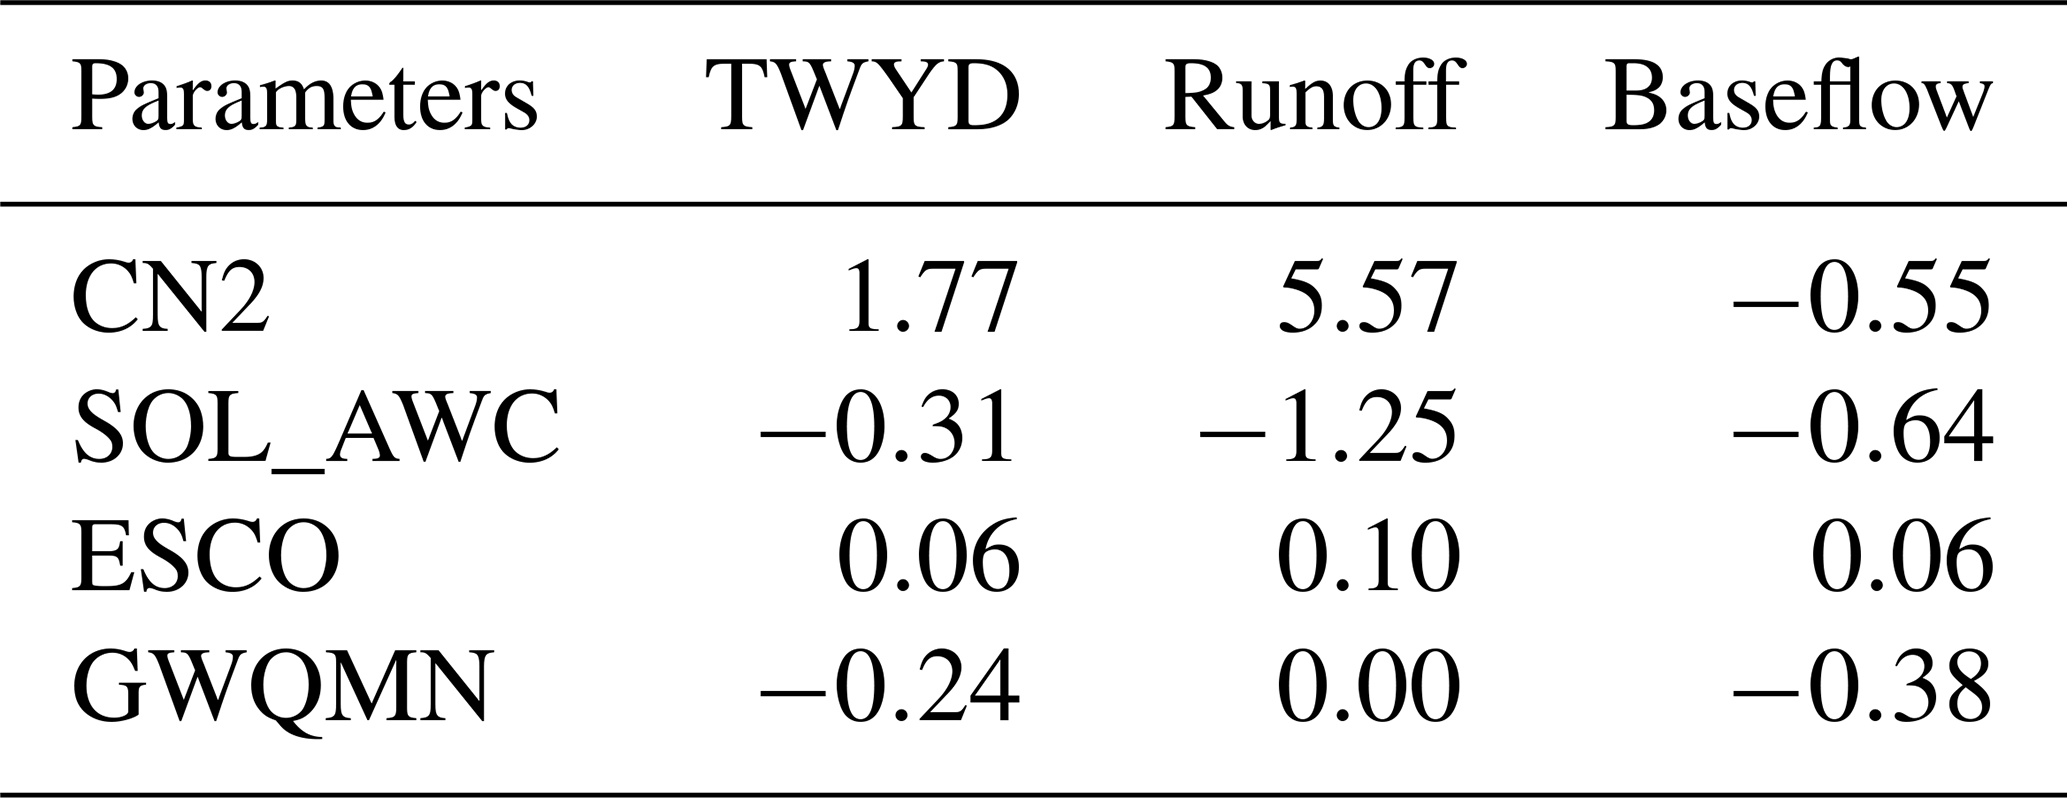
With: CN2: initial SCS runoff curve number for moisture condition II; SOL_AWC: available water capacity of the soil layer (mm H2O mm−1 soil); ESCO: soil evaporation compensation factor; GWQMN: threshold depth of water in shallow aquifer required for return flow to occur (mm H2O).
During manual calibration process, the focus was on the 4 most influential parameters to parameterize SWAT to the local R'dom watershed condition by comparing model flow prediction with observed data at outlet level. The R2 and NSE have been used to evaluate model prediction performance while bearing in mind that they should exceed 0.5 to be able to judge the calibration as satisfactory according to many papers (Arnold et al., 2012).
After several SWAT iterations, a satisfactory agreement between simulated and measured discharge in both monthly and daily time steps was found (Fig. 2); the NSE and R2 values were respectively 0.68 and 0.85 for the monthly time step; 0.58 and 0.79 for the daily time step.
During SWAT model validation process, predicted discharge trend followed observed discharge pattern during all the validation period with NSE and R2 values of 0.88 and 0.91 for the month time step respectively, 0.65 and 0.73 for the daily time step (Fig. 3).
4.1.2 Water balance
Simulated over the period January 2006 to December 2009, the R'dom water balance showed that actual evapotranspiration is very important and represents around 83 % of annual rainfall and irrigation, the surface runoff represents less than 2 % of the total annual rainfall (Table 3).
Table 3Average of simulated monthly Water balance components of R'dom basin during the actual simulation period (2004–2009).
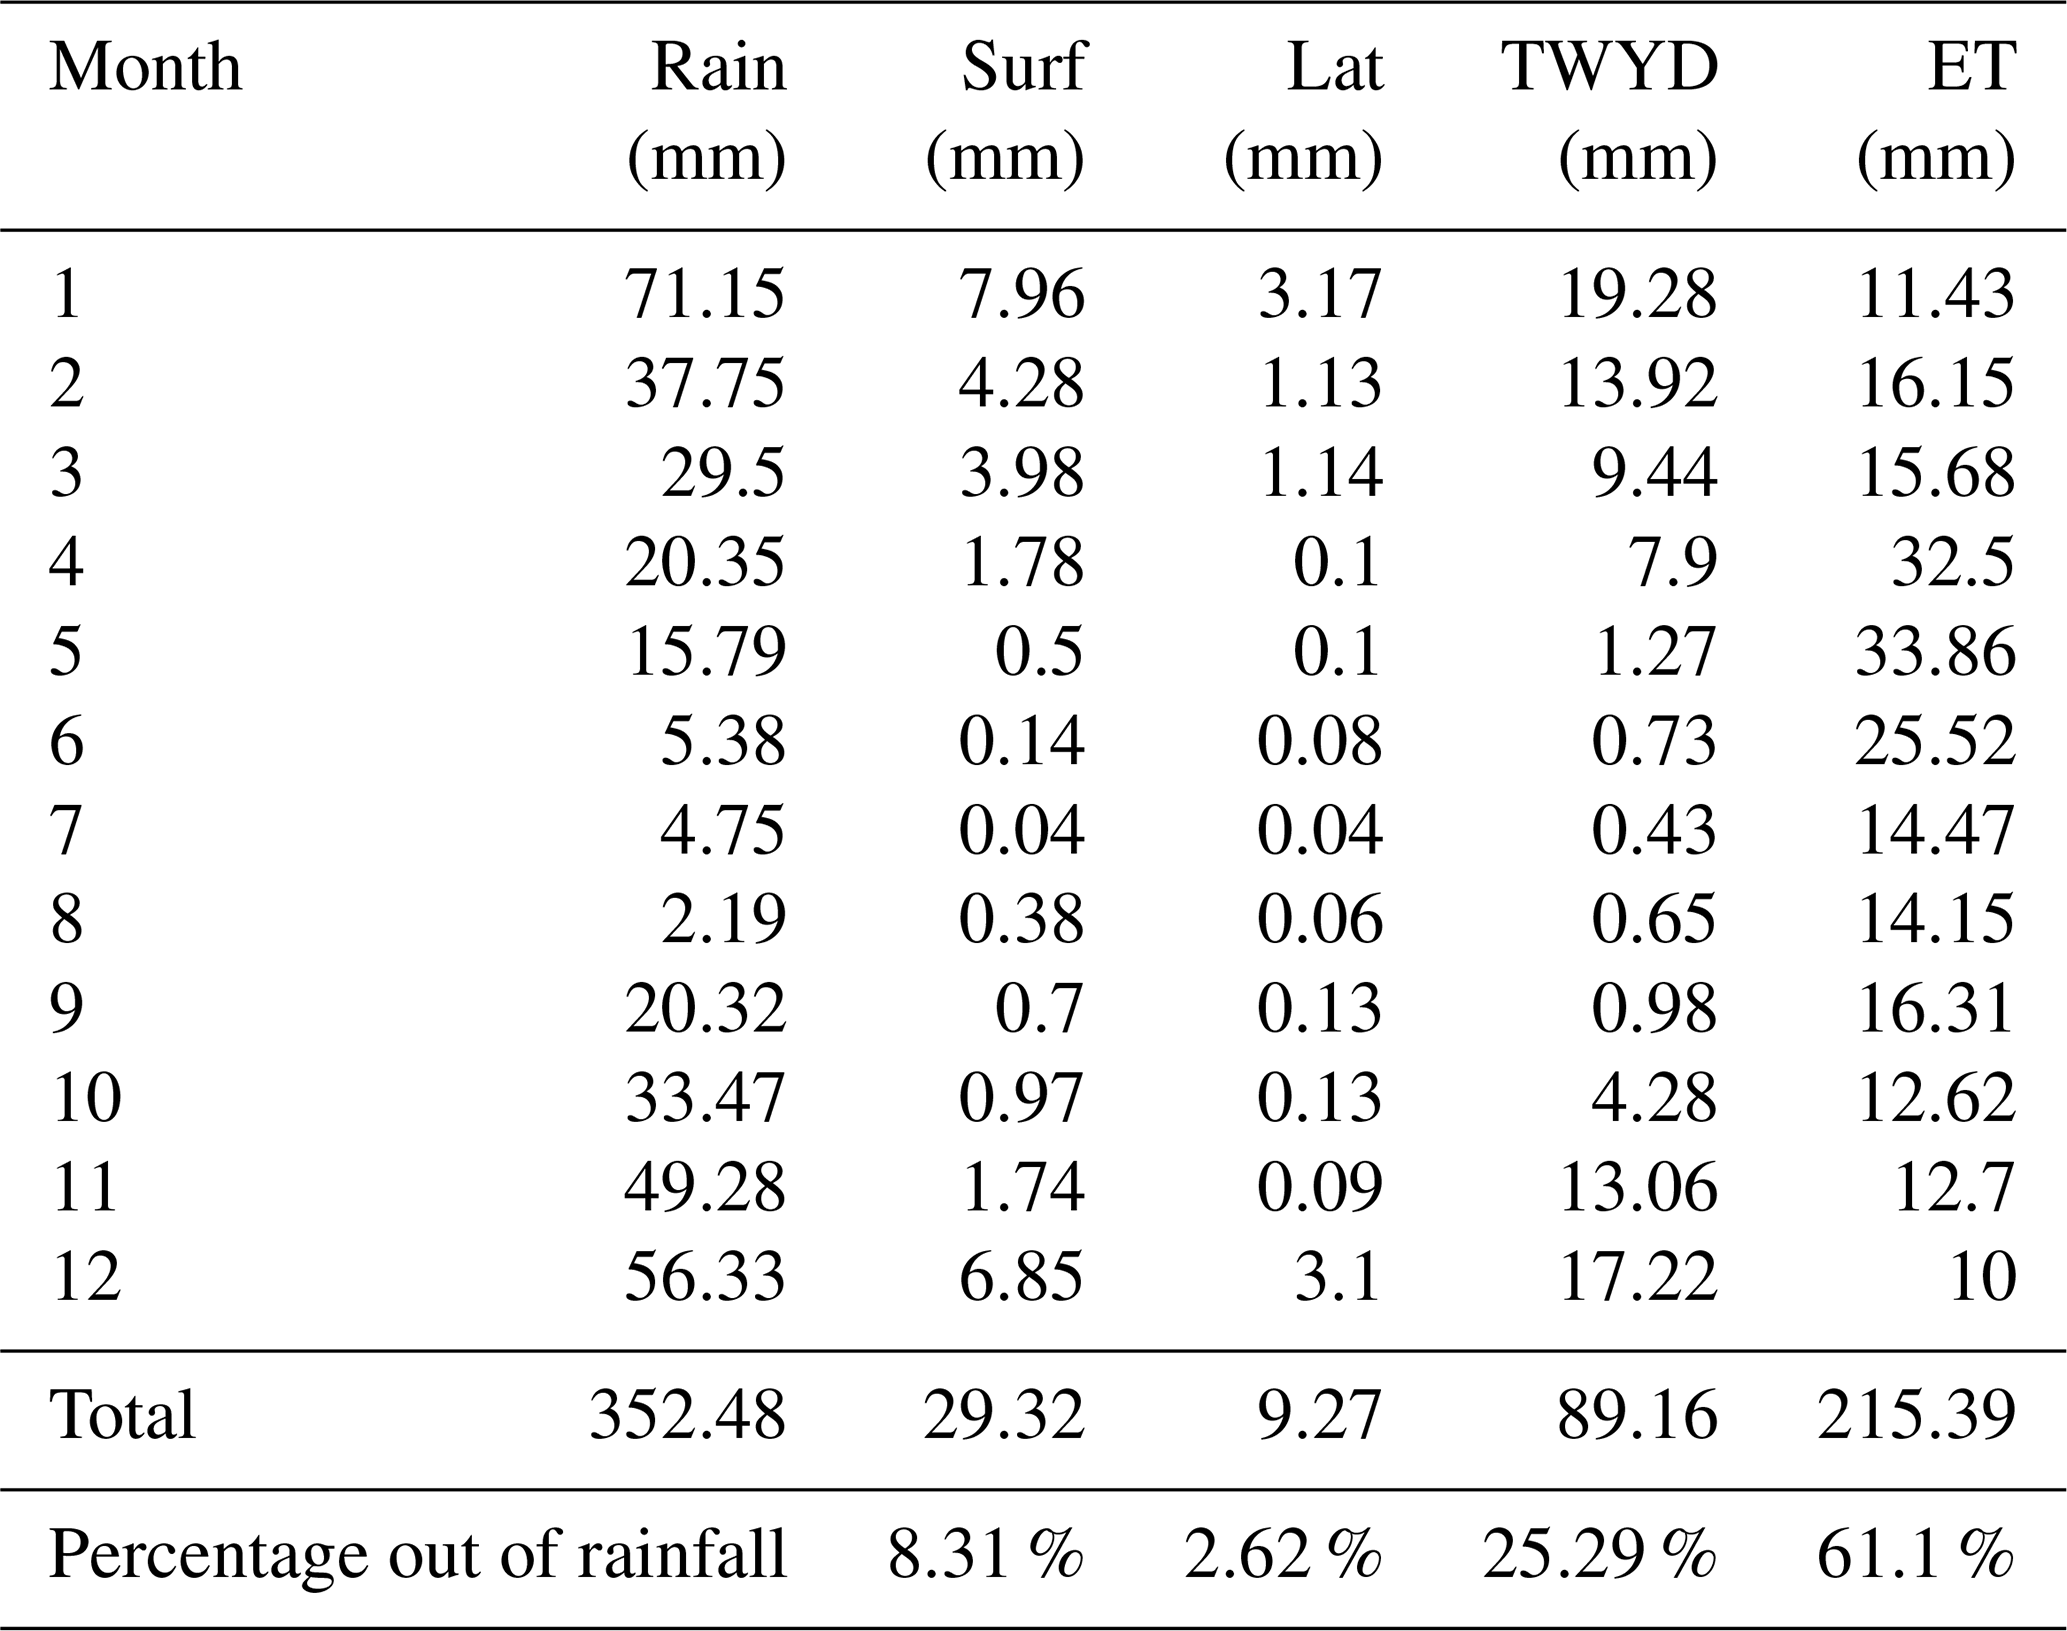
With, Surf: surface runoff; Lat: lateral flow; TWYD: total water yield and ET: evapotranspiration.
Total water yield is the sum surface runoff, lateral flow, groundwater contribution net transmission losses; its distribution within the R'dom watershed, Fig. 4 represents the average of simulated actual water yield by sub-basins. In overall the average total water yield is decreasing going from upstream (South) to upstream (North) taking the same trend of altitude which is high in the South and low in the North.
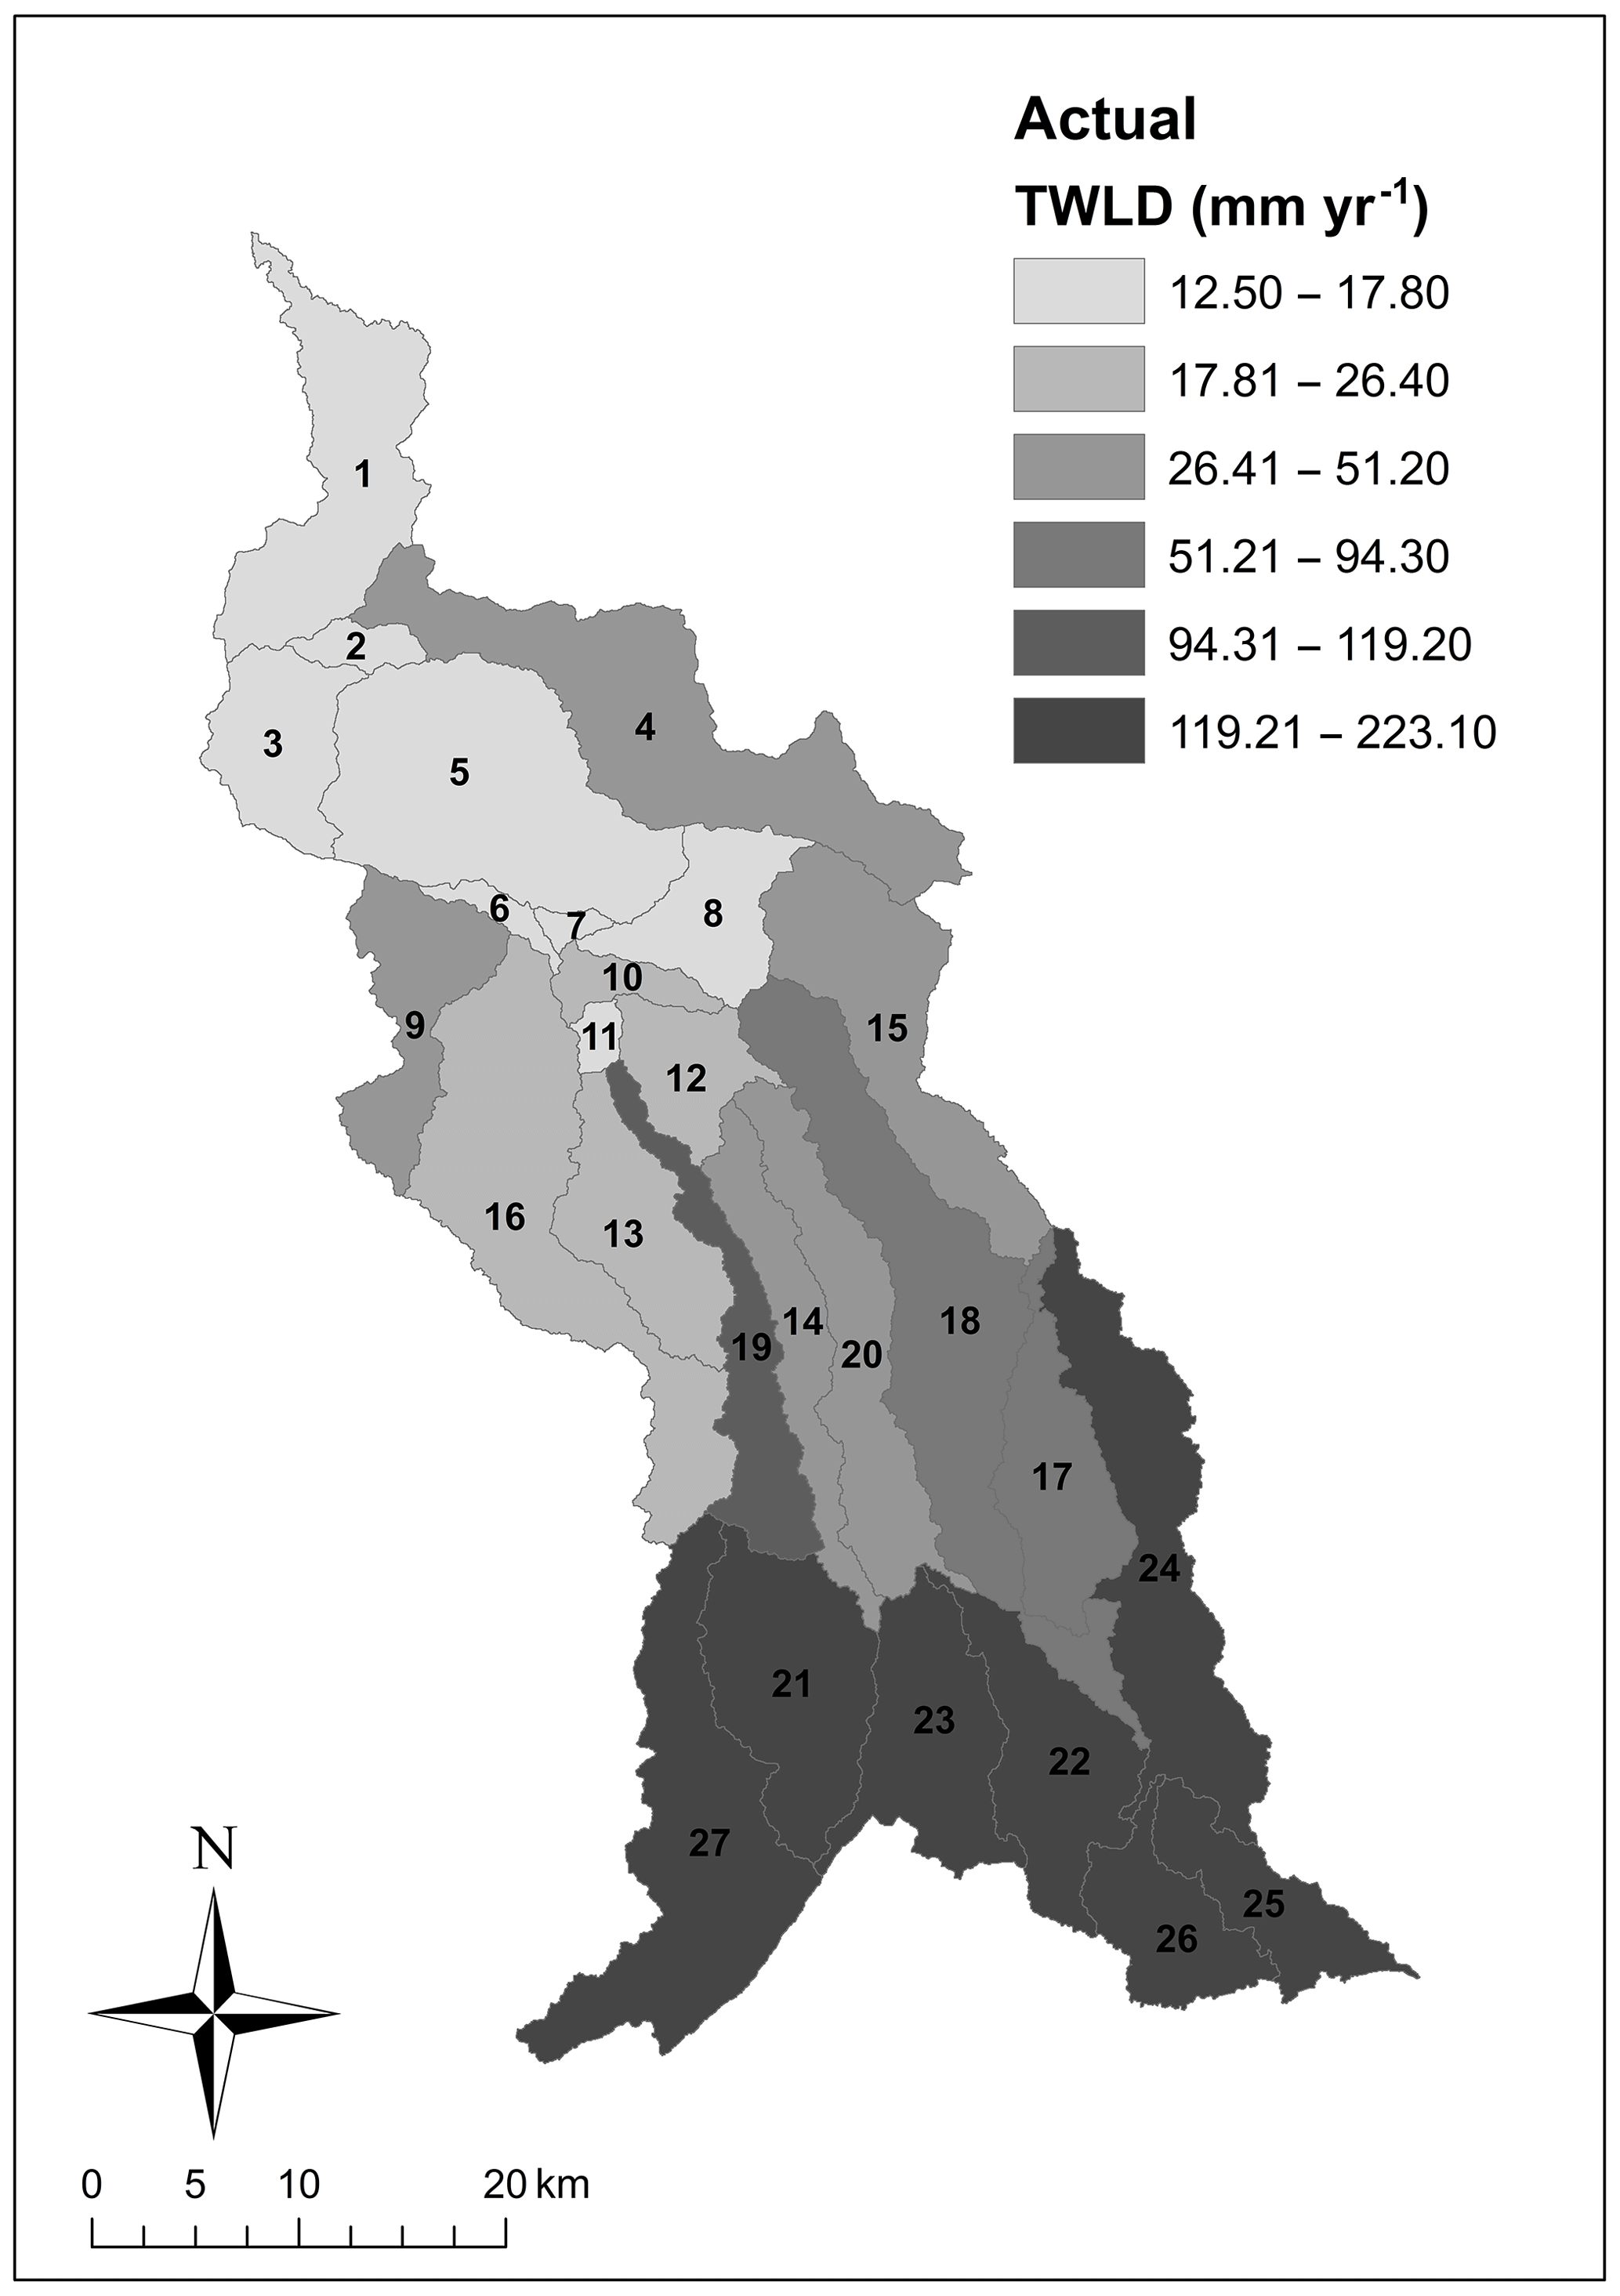
Figure 4Average of simulated total water yield by sub-basins under for the period 2004 to 2009.
The main agricultural activities are held in the centre and northern part of the watershed, the southern part of the basin is covered mainly by forest and pasture lands.
4.2 Implication of climate change scenarios on streamflow
The climate change scenarios that have been generated and corrected statistically were used as inputs to the calibrated SWAT model over the R'dom watered conditions, in order to simulate future streamflow of the study watershed. The same HRUs and crop management setting used for SWAT calibration were kept for the future scenarios simulation with the future rainfall and temperature data as the only changes.
As the big focus of this study was the to assess the potential effect of two climate change scenarios on streamflow pattern in the R'dom watershed, the yearly average of total water yield (TWYL), mm yr−1, was picked as the hydrologic variable to monitor by sub-basin over the watershed. Total water yield is considered as the sum of surface runoff, lateral flow, groundwater contribution net of transmission losses.
Figure 5 represents the percentage of change of simulated total water yield by SWAT at sub-basin scale under the future scenarios RCP4.5 and RCP8.5 during the period 2031 to 2050 comparing to the actual simulation period 2004 to 2009.
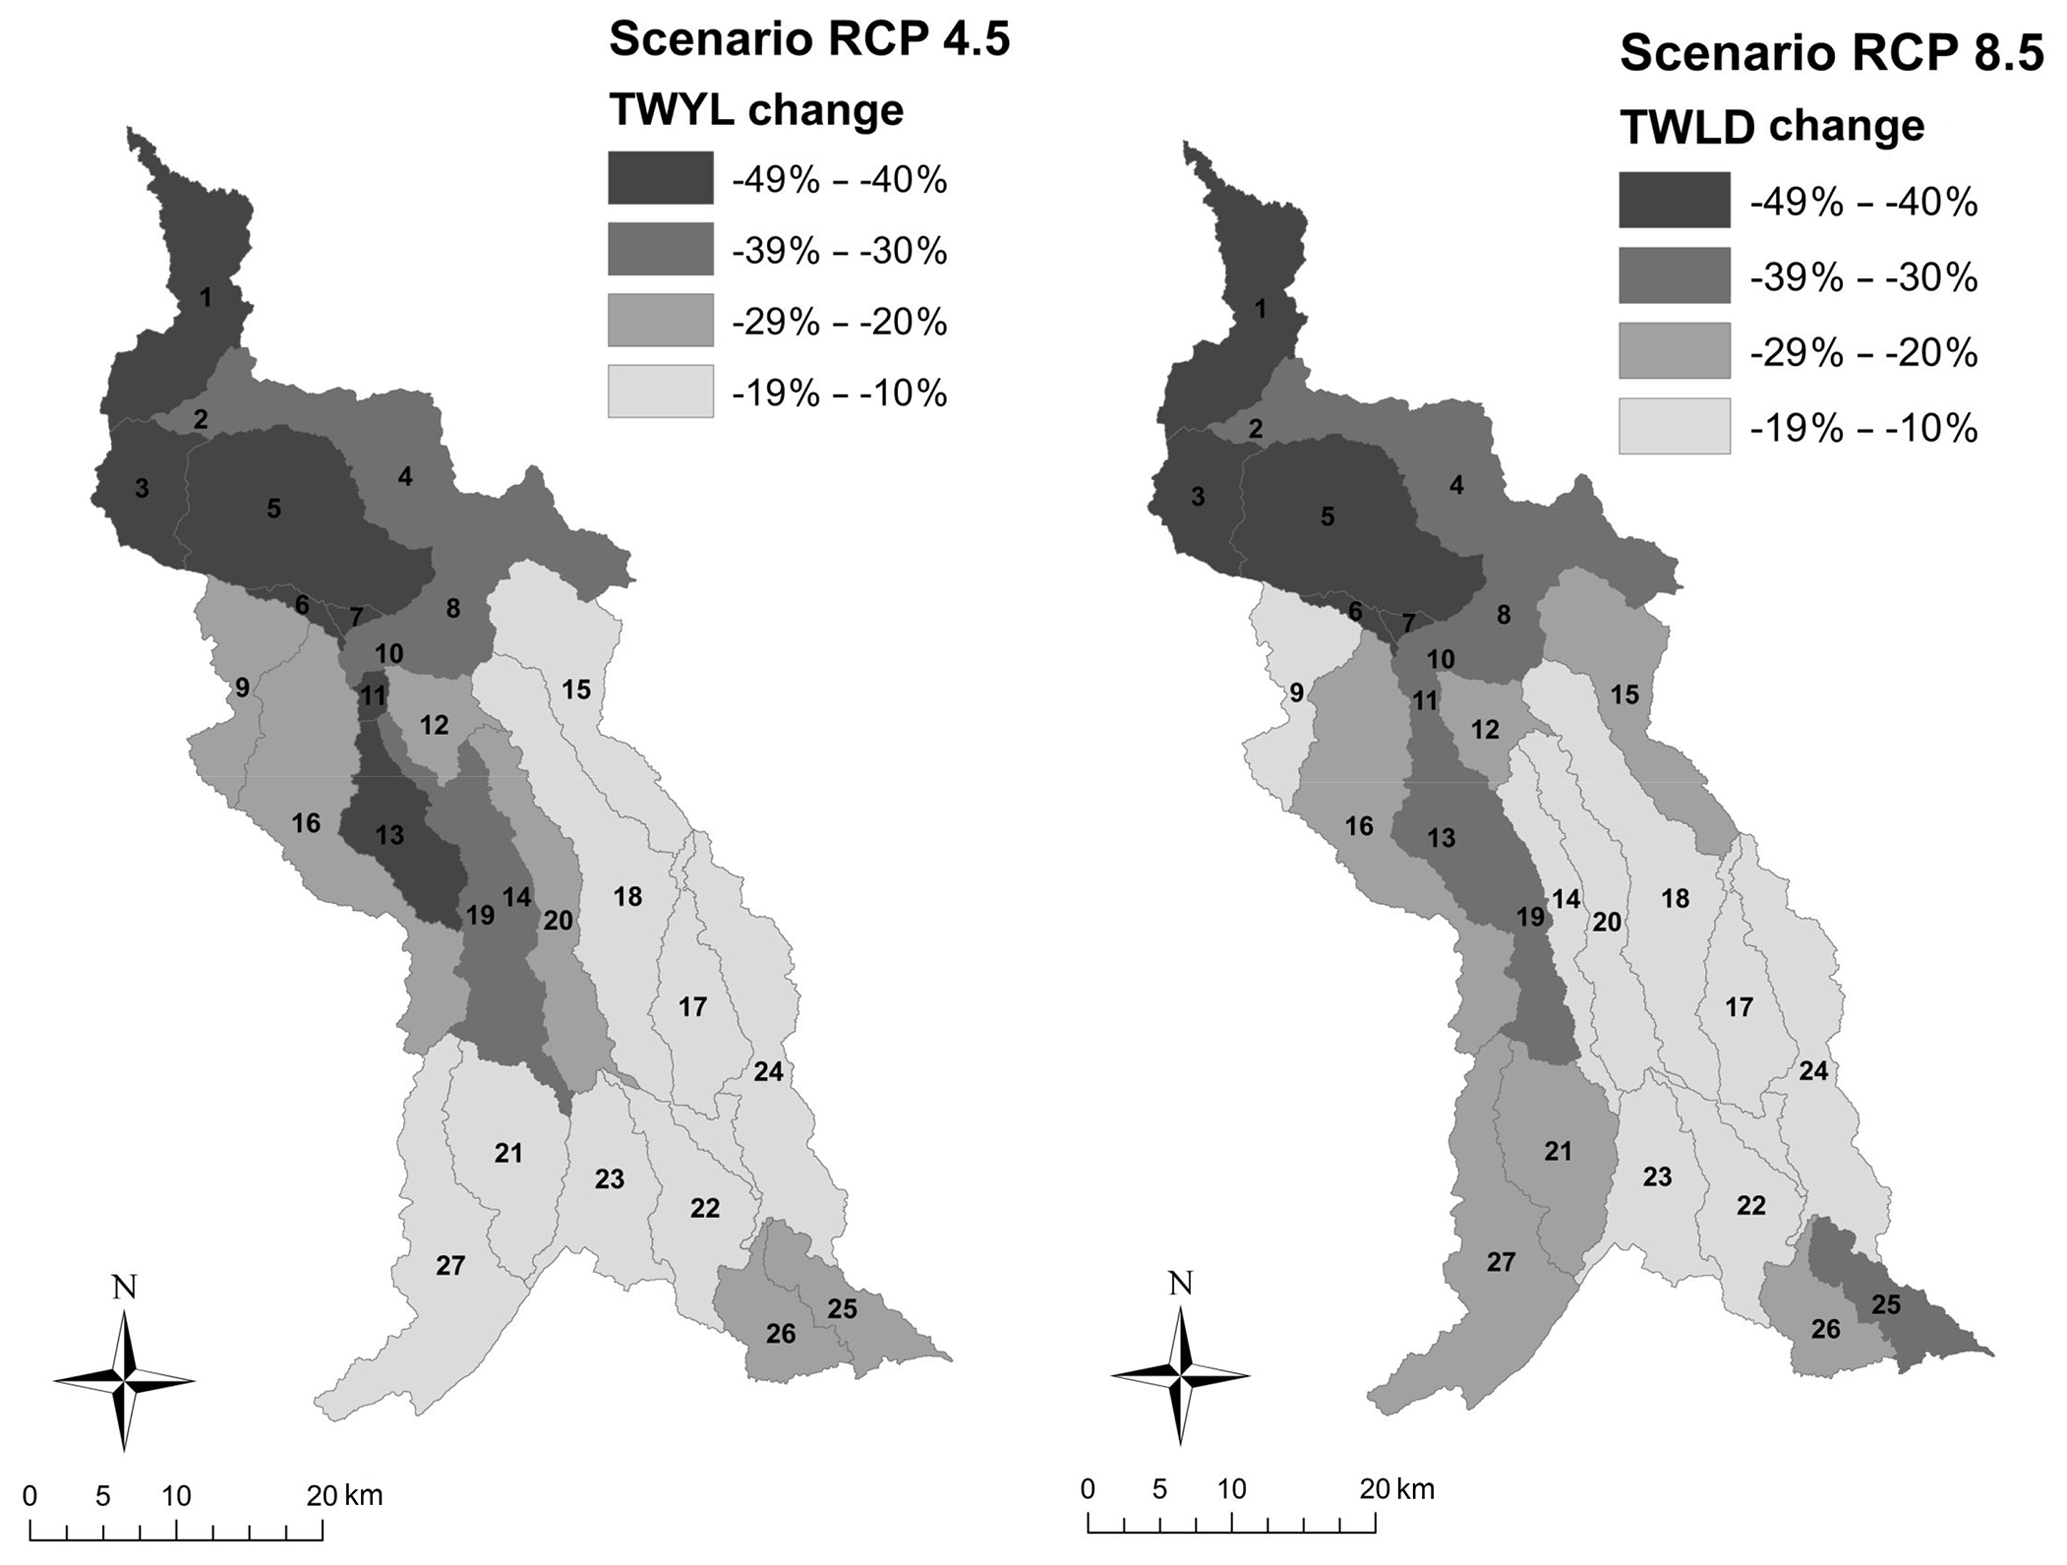
Figure 5Changes of TWYL by sub-basins under future scenarios RCP4.5 and RCP8.5 for the period 2031 to 2050.
On watershed scale, both scenarios showed decrease on average water yield per sub-basin ranging from −3 % (RCP4.5) till −47 % (RCP8.5). The biggest decreases are more in the lower altitudes: the outlet and the watered centre.
For the scenario RCP4.5, it is in the northern and centre of the watershed where highest changes of TWYL average are expected; these areas are hosting most of the farming activities in the R'dom catchment. The highest percentage of average TWYL decrease is expected in the northern sub-basins and should range from −40 % to −49 %.
For the scenario RCP8.5, and in addition to almost all affected areas in the RCP4.5, nearly all western sub-basins of the catchment should be affected with percentages of average TWYL change ranging between −29 % and −40 %. It is worthy to mention that most of sub-basins affected exclusively in scenario 8.5 are home of forestry and pasture activities.
The analysis of the both climate change scenarios projected very significant impact on streamflow over the R'dom watershed, this impact have different geographic distribution inside the study catchment but the scenario 8.5 is likely to be more economically significant as the streamflow change is expected to be significant in areas where farming, pasture and forestry activities are held.
This study assesses the impact of climate change on water balance (represented by water yield variable) in the semi-arid R'dom watershed situated in Morocco. Two emission scenarios (RCP4.5 and RCP8.5) were used to evaluate the climate change impact. SWAT is used to simulate the changes in different components of water balance. The performance of SWAT sensitivity analysis, calibration and validation processes were satisfactory and confirmed the ability of this model to simulate hydrological cycle in the R'dom watershed under climate change effects in the near future (2031 to 2050).
Both emission scenarios projected a decrease of the total water yield in the entire R'dom watershed with more dispersed effect under the scenario 8.5 covering almost all the area where the main economical activities are carried out.
The decrease of water availability in R'dom watershed will definitely have negative impact on the availability of water resources for both rainfed and irrigated agriculture as well as on ecosystems in the forest within the watershed. This change would affect also the economical and social balances in the area as the main activities in the R'dom basin are pasture and agro-forestry. Appropriate adaptation strategies should then be implemented to face the climate change impacts.
This study tried to prove the ability of a hydrologic modeling tool to predict the situation of water resources under climate change effect in a Mediterranean basin. The main outcome is that, in such semi-arid area, water resources are very vulnerable. The results will be a starting point for further analysis of other water balance components response to climate change in the R'dom basin in order to provide more data that will be useful for future water resources management strategies in similar climatic conditions.
The used data in this study are subject to intellectual property agreements with the study stakeholders and therefore, the data are not publicly accessible.
YB developed the methodology with RB and AA, he supervised the conceptualization with the help of LB, and he served as the primary writer. AA contributed in the writing of parts of the paper, and AC validated the used tools and methodology.
The authors declare that they have no conflict of interest.
This article is part of the special issue “Hydrological processes and water security in a changing world”. It is a result of the 8th Global FRIEND–Water Conference: Hydrological Processes and Water Security in a Changing World, Beijing, China, 6–9 November 2018.
Abouabdillah, A., Oueslati, O., De Gerolamo, A. M., and Lo Porto, A.: Modeling the impact of climate change in the mediterranean catchment (Merguellil, Tunisia), Fresenius Environ. Bull., 19, 2334–2348, 2010.
Abouabdillah, A., White, M., Arnold, J. G., De Girolamo, A. M., Oueslati, O., Maataoui, A., and Lo Porto, A.: Evaluation of soil and water conservation measures in a semi-arid river basin in tunisia using swat, Soil Use Manage., 30, 539–549, https://doi.org/10.1111/sum.12146, 2014.
Arnold, J. G., Srinivasan, R., Muttiah, R. S., and Williams, J. R.: Large area hydrologic modeling and assessment – part i, J. Am. Water. Resour. Assoc., 34, 73–89, https://doi.org/10.1111/j.1752-1688.1998.tb05961.x, 1998.
Arnold, J. G., Moriasi, D. N., Gassman, P., Abbaspour, K. C., White, M. J., Srinivasan, R., Santhi, C., Harmel, R. D., Van Griensven, A., Van Liew, M. W., Kannan, N., and Jha, M. K.: Swat: Model use, calibration, and validation, T. ASABE, 55, 1491–1508, 2012.
Dosio, A.: Projection of temperature and heat waves for Africa with an ensemble of CORDEX regional climate models, Clim. Dynam., 49, 493–519, https://doi.org/10.1007/s00382-016-3355-5, 2016.
Haan, C. T.: Statistical methods in hydrology, Iowa State Press, Ames, Iowa, 2002.
IPCC: IPCC special report on climate change, desertification, land degradation, sustainable land management, food security, and greenhouse gas fluxes in terrestrial ecosystems, C/O Imperial College, London, UK, 2019.
Kim, J., Choi, J., Choi, C., and Park, S.: Impacts of changes in climate and land use/land cover under ipcc rcp scenarios on streamflow in the hoeya river basin, Korea, Sci. Total. Environ., 452–453, 181–195, https://doi.org/10.1016/j.scitotenv.2013.02.005, 2013.
Krysanova, V. and Srinivasan, R.: Assessment of climate and land use change impacts with swat, Reg. Environ. Change., 15, 431–434, https://doi.org/10.1007/s10113-014-0742-5, 2015.
Lu, Z., Zou, S., Xiao, H., Zheng, C., Yin, Z., and Wang, W.: Comprehensive hydrologic calibration of swat and water balance analysis in mountainous watersheds in northwest china, in: Physics and chemistry of the earth, parts a/b/c, Water scarcity and integrated water resources management, edited by: Xiangsheng Deng, R. B. S., Liu, J., and Guneralp, B., Elsevier B.V., Amsterdam, 76–85, 2015.
Moriasi, D. N., Arnold, J. G., Van Liew, M. W., Binger, R. L., Harmel, R. D., and Veith, T.: Model evaluation guidelines for systematic quantification of accuracy in watershed simulations in watershed simulations, T. ASABE, 50, 885–900, 2007.
Neitsch, S. L., Arnold, J. G., Kiniry, J. R., Williams, J. R., and King, K. W.: Soil & water assessment tool-theoretical documentation – version 2000, Grassland, Soil and Water Research Laboratory – Agricultural Research Service, Temple, Texas, USA, 76502, 2002.
Viola, M. R., Mello, C. R., Acerbi, J., and Silva, A. M.: Modelagem hidrologica na bacia hidrografia do rio aiuruoca, Rev. Bras. Eng. Agric. Embient., 13, 581–590, https://doi.org/10.1590/S1415-43662009000500011, 2009.