the Creative Commons Attribution 4.0 License.
the Creative Commons Attribution 4.0 License.
 | 16 Sep 2020
Precipitation and water stage variability under rapid developments of urbanization in Taihu Basin
Juan Wu
Hejuan Lin
Song Jin
Jian Wu
Haiping Ji
Min Liu
Yueyun Gan
As one of the most developed regions in China, hydrological process of Taihu basin was influenced under rapid development of urbanization. Based on original gauge data and water stage correction data from Bureau of Hydrology, variability in precipitation and water stage was investigated by Mann–Kendall test. The results demonstrated that: (1) The highest water stage (HWS), lowest water stage (LWS), average water stage (AWS) of all months had increasing trends, especially significantly in non-flood season. The LWS also increased significantly in May, July, September, and November, while the AWS increased significantly in September and November. (2) Water diversion from Yangtze River to Taihu Basin and supplying to the downstream, had strong effects on water stage increase of Taihu Lake. Finally, recommendations based on the correlation between precipitation and water stage was proposed to protect effective utilization of water resources from the impacts of rapid urbanization.
- Article
(1489 KB) - Full-text XML
- BibTeX
- EndNote


The influences of urbanization on river systems have been widely recognized as the most significant among all human activities (Dudgeon, 2006; Shi et al., 2010). Under the circumstance of urban occupation, tributaries have been narrowed gradually and even disappeared, while the impervious surface area has been increased significantly, leading to the increase in runoff volume of main rivers (Gregory, 2006; Elmore and Kaushal, 2008; Yuan et al., 2006). Most rivers of Taihu basin were interrupted by sluices, pump stations and floodgates (Cheng et al., 2007; Zhao et al., 2011). There are 68 sluices along the Yangtze River to defend flood and meet water demand of water resources, 230 rivers with 186 sluices around the Taihu Lake, and 9 sluices along the Hangzhou Bay to solve the drainage of the flood (Yin et al., 2009). The flow regimes in Taihu basin are not only facing the effects of the changing climate, but also intense urbanization process (Zhou et al., 2013; Liu and Xu, 2015). By the end of 2015, the population of Taihu Basin reached to 59.97 million and the GDP is 6688 billion Yuan, representing about 4.4 % and 9.9 % of the nation's totals, respectively (Taihu Basin Authority of Ministry of Water Resources, 2015). Due to its rapid socio-economic development, Taihu basin suffers high vulnerability to natural disasters (Zhao and Wen, 2012). As a result, detecting and comparing the trends of precipitation and water stage of Taihu Basin is important to realize the evolution of water resources. In this study, urbanization is defined as the rural lifestyle changing into city lifestyle, according to G. F. Li et al. (2013), after the Reform and Opening-up in 1978, urbanization in China was in the state of acceleration.
Most research on Taihu Basin were focused on hydrological simulation (Liu et al., 2013), flood risk management (Xie et al., 2013; Gong and Lin, 2008), water quality (Zhao et al., 2011; Yu et al., 2007; W. Li et al., 2013; Wang et al., 2014) and ecological problems. Research on hydrological response to urbanization has received wide concerns for recent years (Zeng and Wang, 2012). Zhu et al. (2015) found that the river connectivity of Shanghai had been significantly degraded from 1965 to 2006, and the land use changed significantly with more building areas and fewer water regions and agricultural land. Yang et al. (2014) analyzed that precipitation differences between cities and suburbs of sub-region in Taihu Basin from 1961 to 2006 and revealed that the amount of precipitation increased with the level of urbanization at spatial and temporal scales, while maximum daily precipitation and the number of rainstorms in urban areas also increased. Deng et al. (2015) investigated the temporal and spatial change of river system in the Taihu region in conjunction with urbanization, and the results demonstrated that the changes in river density, the water surface ratio and main river area length ratio in rapid urbanization period were much greater than those in the slow urbanization period. Wang et al. (2016) assessed the contributions of precipitation and human activity on water stage increase in the plain river network region of Taihu Basin, which demonstrated that human activities played more and more important roles in the extreme water stage changes since the late 1980s.
In this article, the Mann-Kendall test was used to detect precipitation change of Taihu basin and water stage of Taihu lake from 1954 to 2015. Secondly, based on observed data from annual Water Year Book and water-level correction data from Hydrology Bureau of Taihu basin, the precipitation–water stage relationship was investigated. Thirdly, we discussed possible causes of water stage trends variation, including the variation of precipitation, regulation of sluices and other influencing factors. This research can provide a scientific foundation to further researches, such as water projects regulation impacts on flow regime, flood control and water resources management in Taihu basin.
Taihu Basin (30∘28′ ∼32∘15′ N, 119∘11′ ∼121∘53′ E) locates in the core area of Yangtze River Delta with Yangtze River in the north, Qiantangjiang in the south, East Sea in the east and the mountainous areas such as Mount Tianmu and Mount Maoshan as the boundary in the west. In terms of administrative division, Taihu Basin, the total area is 36 895 km2, belongs to Jiangsu Province with area 19 399 km2, Zhejiang Province 12 095 km2, Shanghai Municipality 5176 km2 and Anhui Province 225 km2. The hydrographic net of Taihu Basin is complicated (Deng et al., 2016), with rivers and lakes accounting for 17 % of the total area of the basin. As the largest lake of the basin with area 2338 km2 (Hu and Wang, 2009), Taihu Lake is the center of floodwater storage and regulation, whose average water depth is 1.89 m and water content is 4.428 billion m3.
The Taihu basin lies in the subtropical zone (Wang et al., 2011) and has a monsoon climate with an average annual precipitation of 1218.1 mm, mainly concentrated in flood season ranging from May to September. There are three rainy seasons annually in the Taihu Basin: Spring rainy period, Meiyu period and Typhoon period (Chen and Wang, 1999). The spring rainy period from March to May accounts for about 24.2 % of the annual precipitation. The Meiyu period with abundant precipitation from June to July accounts for about 19.8 % of the annual precipitation. However, there exist large changes in precipitation days and amount of the Meiyu period, for example, the Meiyu period did not appear in 1958 and 1978, whereas the Meiyu period lasted for 43 d with 681 mm in 1999 and 55 d with 645 mm in 1991, resulting in two catastrophic floods. The Typhoon period from August to October has high precipitation intensity and often leads to severe regional floods, for instance, the No.14 typhoon brought 150.1 mm for Taihu Basin, which occurred on 5 September 1962.
After witnessed basin-wide catastrophic flood in 1991 (Wu and Guan, 2000), in accordance with the planning of water conservancy, the first round of comprehensive regulation started intermediately. The 11 key projects have been built in the basin: Wangyu River, Taipu River, Lake Levee, Hangjiahu South Discharge, Huxi Cited Discharge, Wuchengxi Cited Discharge, Tiaoxi Flood Protection in East and West, Hangjiahu North Exhaust Passage, Red Flag Pond, expanding Lanlugang and Xietang, Huangpu River Upstream Flood Control. Combined with the existing water projects in the basin, the Taihu Basin has formed one project system, through which the flood flows northwards into the Yangtze River, eastwards into the Huangpu River and southwards into the Hangzhou Bay. The first four projects were completed in 1999, while the last seven projects were accomplished in 2002. By the end of 1999, the problems of quality-induced water shortage and water environment deterioration over Taihu Basin were very serious, where 80 % of river network was subject to pollution of varying degrees, and more than 70 % of the water in Taihu was in a eutrophic state. In order to improve the water environment, the Taihu Basin Authority (TBA) began to carry out Water Diversion from Yangtze River to Taihu Basin through Wangyu River and supplying water to the downstream through Taipu River since 2002. Therefore, 2002 can be considered as an important demarcation point to study Taihu water stage variation. The flood control capacity is further enhanced after 2002, since the complex system of flood control infrastructure has formed, including dikes, numerous large sluice gates, and pumping stations.
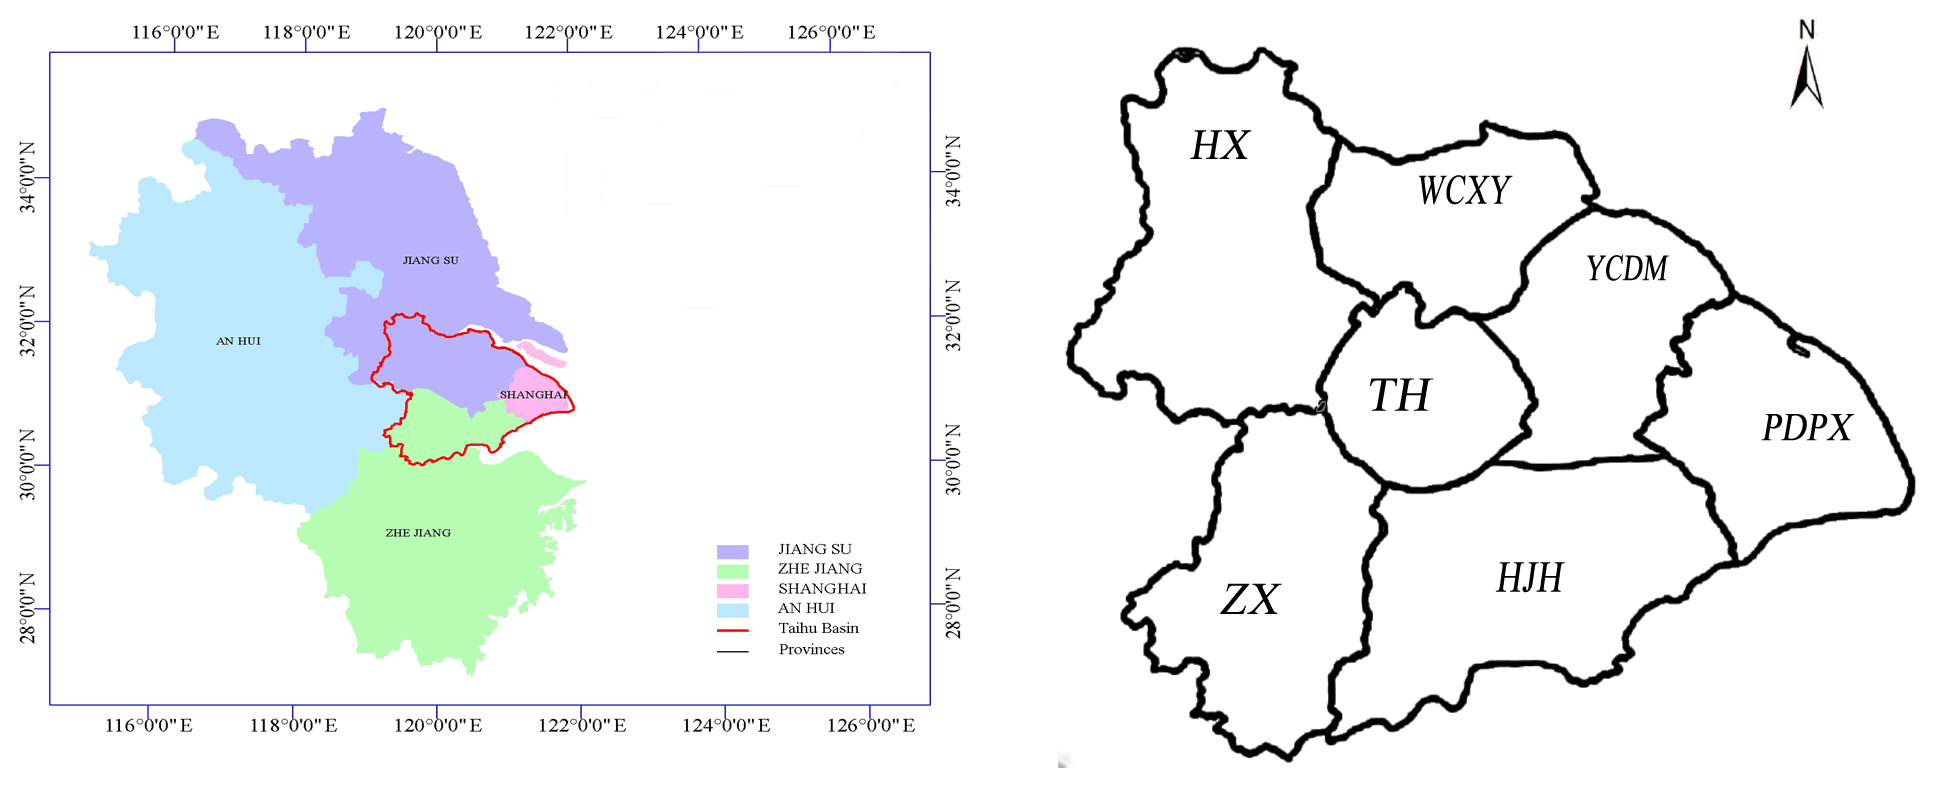
Figure 1Taihu Basin and its sub-regions in China.
Based on spatial and temporal distribution of precipitation and characteristics of the watershed runoff and confluence, the Taihu basin was divided into seven sub-regions, Zhexi sub-region (ZX) with 15 stations to calculate average precipitation, Huxi sub-region (HX) with 17 stations, and Taihu sub-region (TH) with 8 stations, Wuchengxiyu sub-region (WCXY) with 10 stations, Yangchengdianmao sub-region (YCDM) with 11 stations, Hangjiahu sub-region (HJH) with 11 stations and Pudongpuxi sub-region (PDPX) with 9 stations. The first three sub-regions are called the upper area, while the last four sub-regions are in the downstream, which was shown in Fig. 1. The arithmetic mean method was applied in calculating average precipitation of each sub-region, while the weighting mean method was applied to calculate average precipitation of Taihu Basin based on sub-region area.
The water stage of Taihu Lake is an important index for the Taihu Basin, which has significant effects on regional flood defense, water supply safety, and water resources management. In this study, the water stage of Taihu Lake is determined by the mean value of the water stages from the five stations surrounding the lake: Dapukou (DPK), Wangting (WT), Xishan (XS), Xiaomeikou (XMK), and Jiapu (JP). Location of the research area, hydrometric stations were shown in Fig. 2.
Suffering from severe land subsidence caused by extensive groundwater exploitation since 1980s, the maximum cumulative subsidence was over 1 m for some stations in Taihu Basin (Wu et al., 2009). However, water stage in Water Year Book was observed based on stationary datum for most hydrometric stations. The occurrence of land subsidence leads to height datum distortion, thus, the water stage should be corrected. Four kinds water stage correction: average distribution method, segment correction method, datum reference method, and region approximation method were applied in our study (Zhao et al., 2015). The water stage of five stations surrounding the lake was modified before tendency analysis.
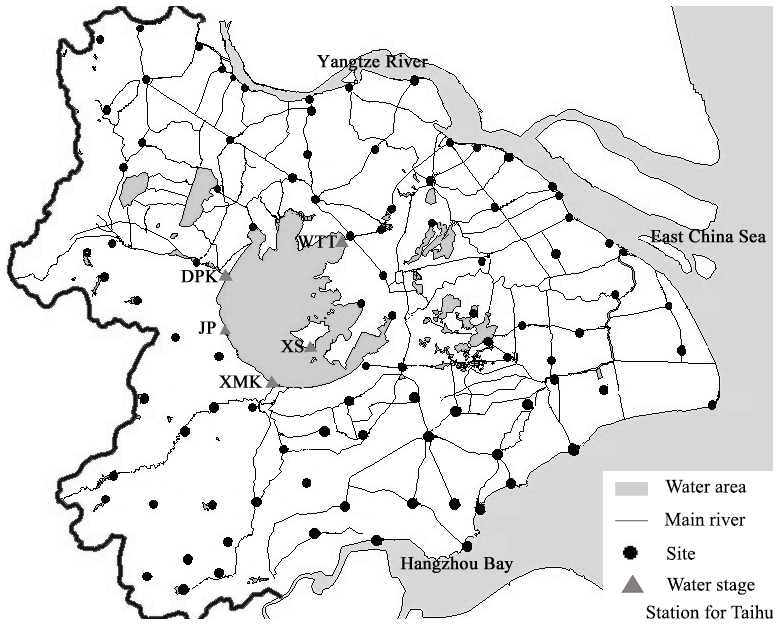
Figure 2Location of study area and hydrometric stations selected.
3.1 Mann-Kendall test
Mann-Kendall test is a simple but useful method to identify changes for long-term hydrological series (Mann, 1945; Kendall, 1975), especially for complicated basins where mathematics modeling was very difficult to provide satisfactory results (Yin et al., 2012). In the Mann-Kendall test (Xu et al., 2003; Zhao et al., 2007), the null hypothesis H0 is that the data () are a sample of n independent and identically distributed random variables. The alternative hypothesis (Peng et al., 2016) H1 of a two-sided test is that the distribution of xk and xj is not identical, and j≥k. The test statistic S is computed by:
Where
When n≥8, the statistics S is approximately normally distributed with the mean and the variance as follows:
Where ti is the number of ties of extent i. The standardized statistics (Z) is formulated as:
A positive and negative Z values indicate the upward and downward trends, respectively. The existing trend is considered to be statistically significant if at significance level of α. In this study, α is set to be 0.05 and 0.10 with equal to 1.96 and 1.65, respectively.
3.2 API (Antecedent Precipitation Index) hydrological model
API (Antecedent Precipitation Index) hydrological model is commonly used in streamflow analysis. In order to build correlation between precipitation and runoff, the first step is to select precipitation and runoff event with single peak, secondly, antecedent influence precipitation (Pa) of each flood was computed, thirdly, curve can be completed, which was made up of several lines characterizing the relation between precipitation and runoff under equal value intervals of antecedent influence precipitation. Pa is calculated as:
Where Pa, t+1 is the antecedent influence precipitation at time t+1, Pa,t is the antecedent influence precipitation at time t, Pt is the precipitation at time t, K is the regression coefficient of soil, is monthly average potential evaporation, and Wm is maximum water storage. Pa, t+1 is no more than Wm, Wm is 100 mm in Taihu Basin, the initial Pa, t is 40 mm according to artificial experience in this study.
4.1 Tendencies of precipitation and Taihu water stage variations
The increasing trend of annual precipitation and precipitation in flood season (from May to September) over Taihu basin were not statistically significant, with Z value of 0.72 and 0.02. The monthly precipitation decreased significantly at the significance level of 0.05 in April, May, and September, with Z value of −2.54, −2.33, and −2.82. The precipitation in non-flood season (January to March, October to December) demonstrated increasing trends, but only the precipitation in January increased significantly at significance level of 0.05. For the upper area, the annual precipitation and precipitation of flood season over ZX had an insignificant decreasing trend, while the annual precipitation and precipitation in flood season over HX had an insignificant increasing trend. For the downstream areas, the annual precipitation and precipitation in flood season over WCXY, YCDM, PDPX had an insignificant increasing trend. The monthly precipitation in January increased significantly at the significance level of 0.05 for each sub-region, whereas monthly precipitation in April, May and September decreased significantly at the significance level of 0.1 except HX. The precipitation in non-flood season (February, March, November and December) and precipitation in flood season (July and August) demonstrated increasing trends for each sub-region. The monthly precipitation over Taihu basin was shown in Table 1.
Table 1Tendencies analysis of precipitation over Taihu basin from 1954 to 2015.
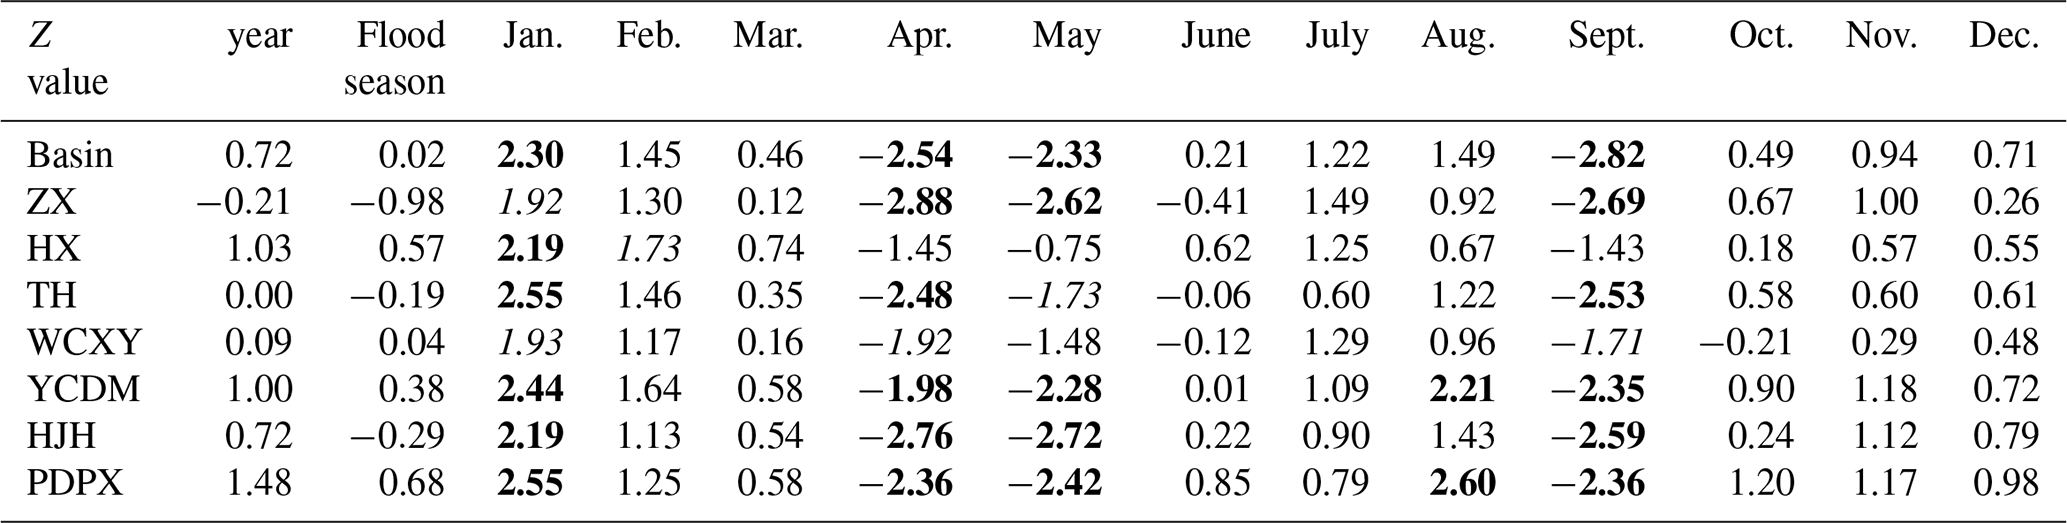
Texts in Bold indicate the results were significant at a significance level of 0.05; texts in italic indicate the results were significant at a significance level of 0.1; negative value means decreasing and positive value means increasing.
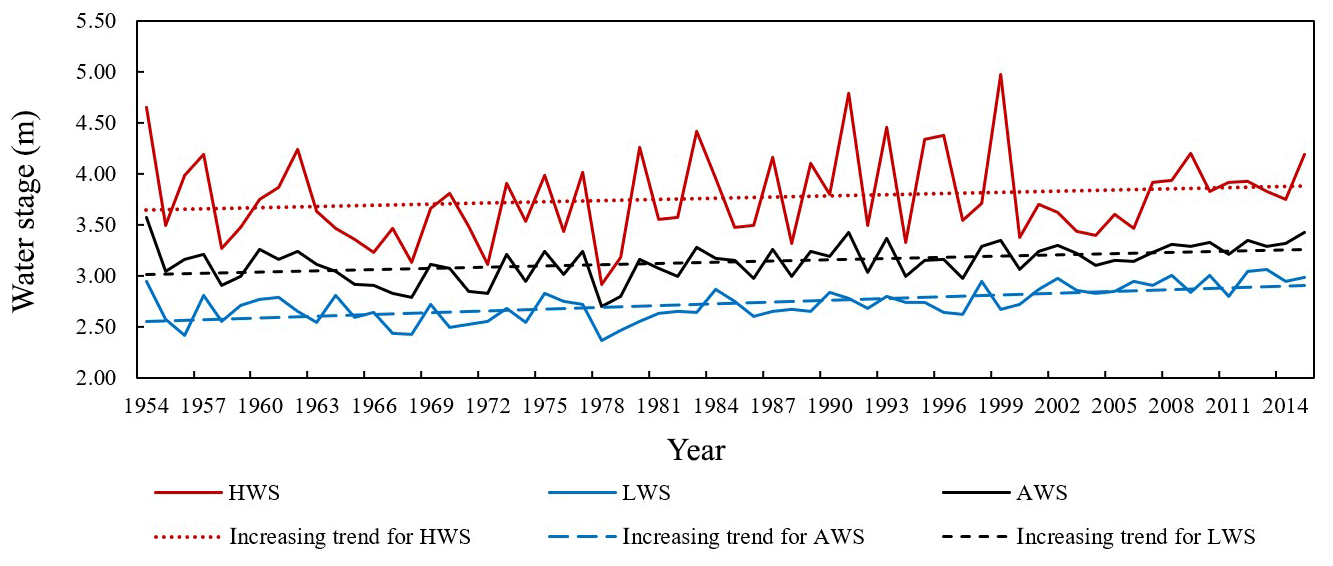
The increasing tendency of annual highest Taihu water stage (HWS) was not significant, with Z value 1.45. However, The Z value of annual lowest Taihu water stage (LWS) reached to 5.08, while the annual average Taihu water stage (AWS) reached to 2.57, which indicated that LWS and AWS increased significantly at a significance level of 0.05 (Fig. 3). The HWS, LWS, AWS of all months had increasing trends, especially significantly in January, February, March, April, August, and December, which was shown in Table 2. Apart from this, the LWS in May, July, September, November also increased significantly, while the AWS in September and November increased significantly.
Table 2Tendencies analysis of HWS, LWS, and AWS from 1954 to 2015.
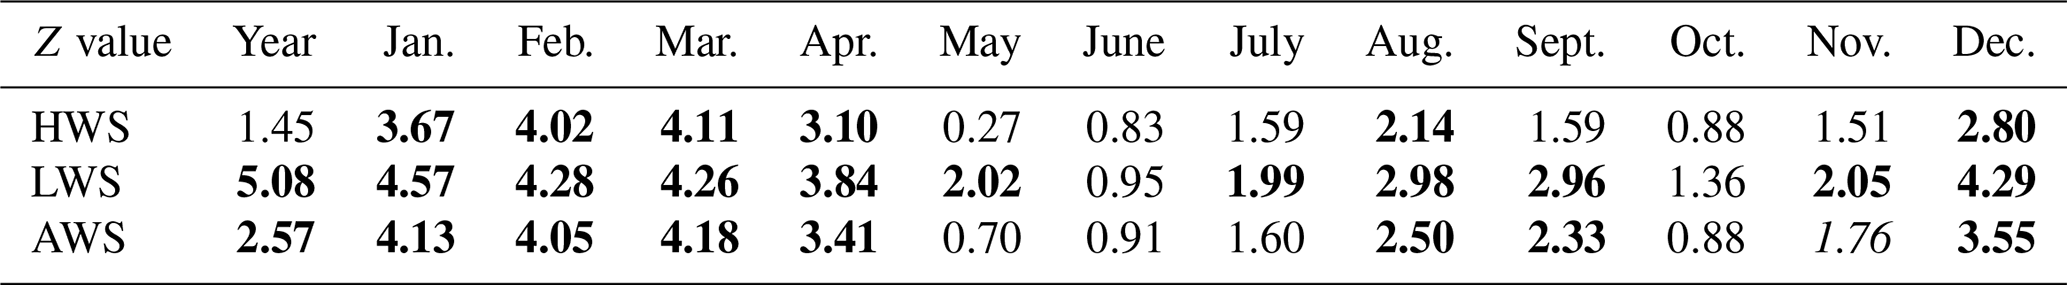
Texts in Bold indicate the results were significant at a significance level of 0.05; texts in italic indicate the results were significant at a significance level of 0.1; negative value means decreasing and positive value means increasing.
Considering the 11 key projects completed and Water Diversion started in 2002, the HWS, LWS, and AWS variation were compared before 2001 and after 2002, which was showed in Table 3. From December to April, the HWS increased more than 0.18 m, the LWS increased more than 0.19 m and the AWS increased more than 0.17 m. The largest increasing extent of the HWS, LWS, and AWS reached more than 0.29 m in March, whereas the least increasing extent reached more than 0.04 m in July.
Table 3The highest, lowest and average variation of Taihu water stage before 2001 and after 2002.

4.2 Tendencies of net water diversion, inflow and outflow variations
The HWS, LWS, and AWS of April, May and September increased, although monthly precipitation of the same period decreased. Therefore, monthly net water diversion and drainage amount of sluices along the Yangtze River, as well as net inflow into Taihu Lake, should be analyzed, both of which were defined as daily accumulative amount of water diversion minus drainage in this study. The net water diversion and drainage amount were dominant by 4 sluices of HX sub-region (Jianbi Sluice, Jiuquhe Sluice, Xiaohe Sluice and Weicun Sluice), 3 sluices of WCXY sub-region (Zhangjiagang Sluice, Dingbo Sluice, and Shiyiwei Sluice) and Wangyu Sluice. The net inflow into Taihu Lake was dominant by HX, Wangting Sluice, and ZX, and the net outflow from Taihu Lake was dominated by Taipu Sluice, YCDM, WCXY, and HJH.
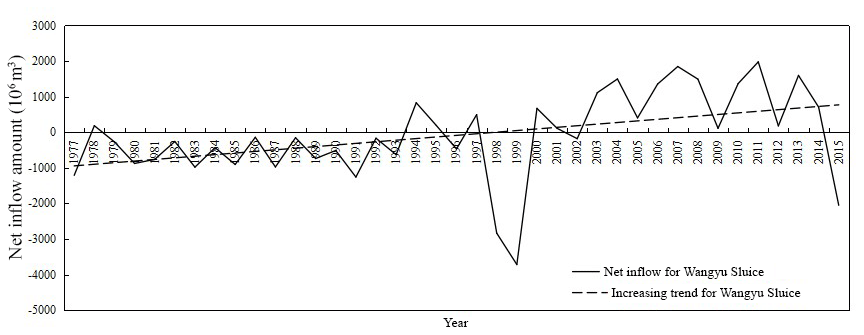
The net water diversion and drainage amount along the Yangtze River were demonstrated in Table 4, while the annual net water diversion amount for Wangyu Sluice was demonstrated in Fig. 4. The net water diversion amount of Wangyu Sluice was mainly negative before 2001, which changed into positive after water diversion from Yangtze River to Taihu Basin through Wangyu River after 2002. Wangyu Sluice had a significant increasing trend from January to May, as well as September to December. HX had a significant increasing trend in September while decreasing trends in January, February, April, and November. All months of the non-flood season (January to April, October to December) in WCXY had increasing trends, which was significant in January, April, October, November, and December.
Table 4Tendencies analysis of net water diversion and drainage amount along the Yangtze River.
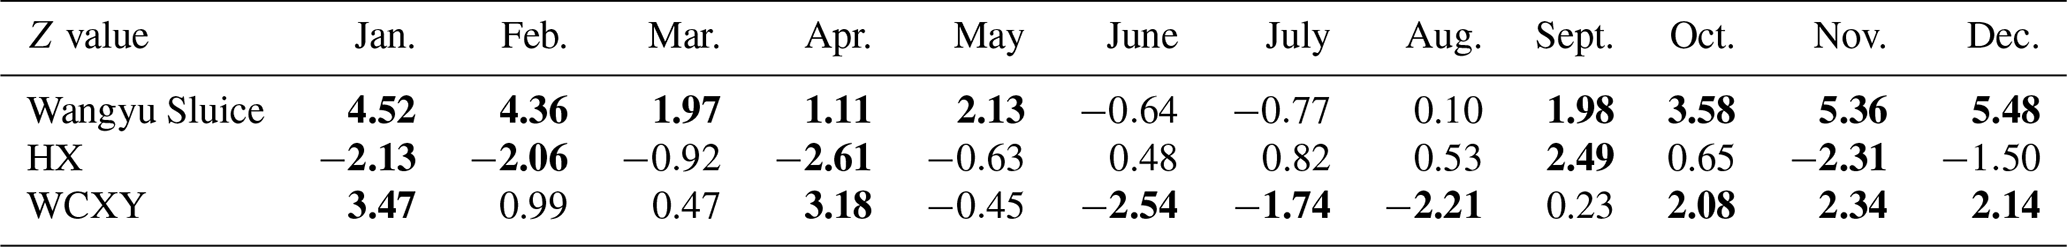
Texts in Bold indicate the results were significant at significance level of 0.05; texts in italic indicate the results were significant at significance level of 0.1; negative value means decreasing and positive value means increasing.
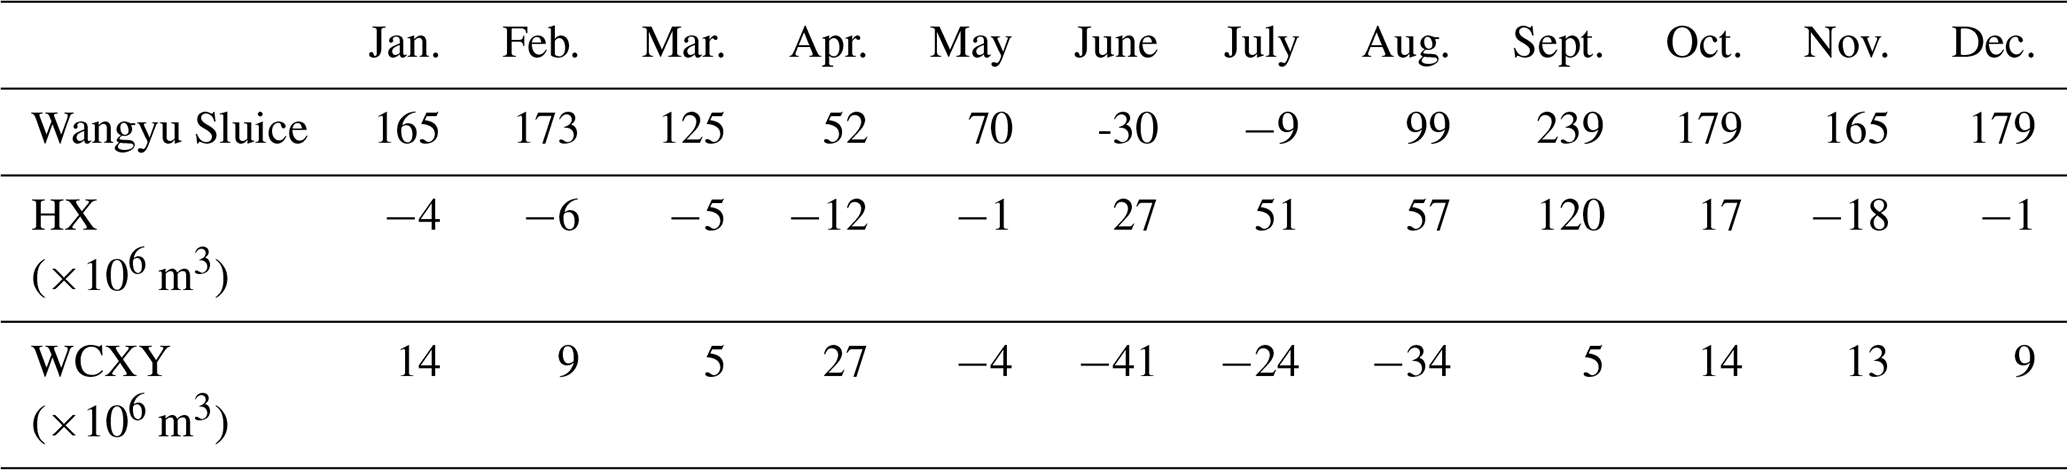
The net water diversion and drainage variation were compared before 2001 and after 2002, which was showed in Table 5. Wangyu Shuice increased 239 million m3 in September, with an increase of 52 to 179 million m3 in non-flood season. HX increased by 120 million m3 in September, with an increase of 17 to 57 million m3 from June to October. WCXY increased 27 million m3 in April, with 5 to 14 million m3 increasing in other months of the non-flood season.
Table 5Net water diversion and drainage variation along the Yangtze River before 2001 and after 2002.
As shown in Table 6, the net inflow of HX into Taihu Lake had significant increasing trends for all months, and a net inflow of Wangting Sluice into Taihu Lake had insignificant increasing trends in non-flood season except April. The net outflow of Taipu Sluice from Taihu Lake had decreasing trends in non-flood season except March, with significant decreasing trends in October. The net outflow of YCDM from Taihu Lake in April, May, and September had insignificant decreasing trends, whereas HJH and WCXY from Taihu Lake had increasing trends.
Table 6Tendencies analysis for net inflow and outflow of Taihu Lake.
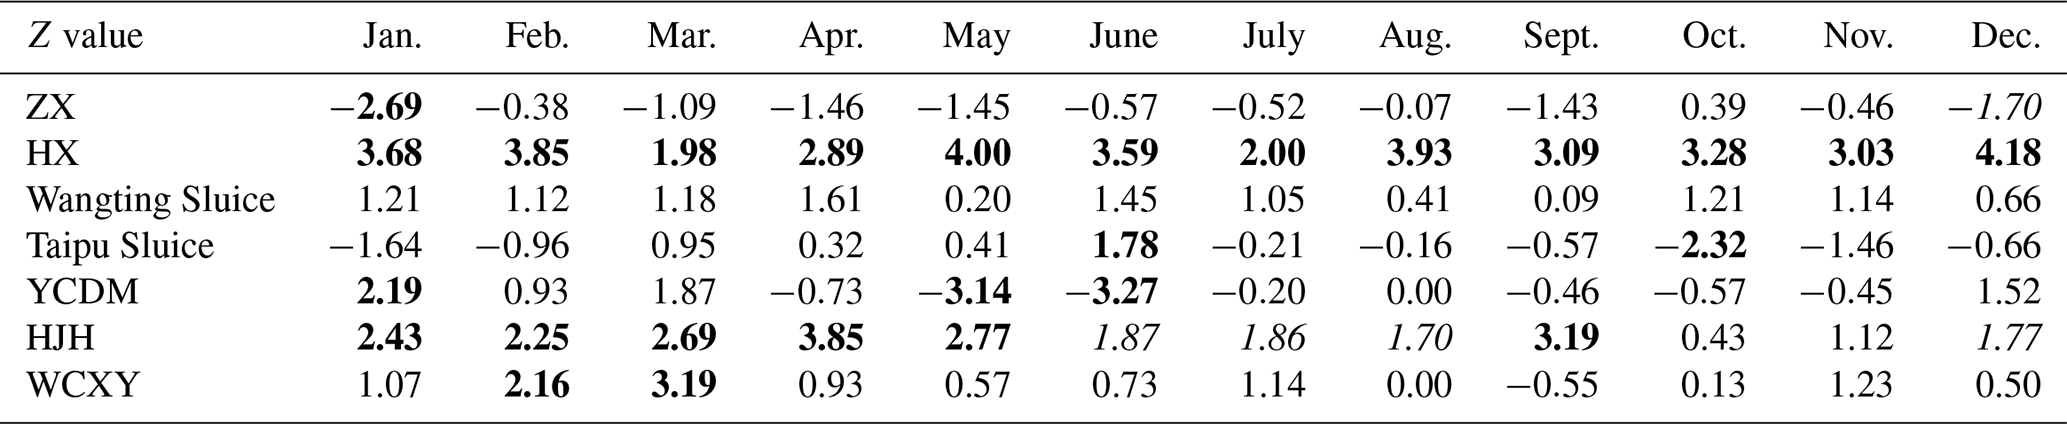
Texts in Bold indicate the results were significant at significance level of 0.05; texts in italic indicate the results were significant at significance level of 0.1; negative value means decreasing and positive value means increasing.
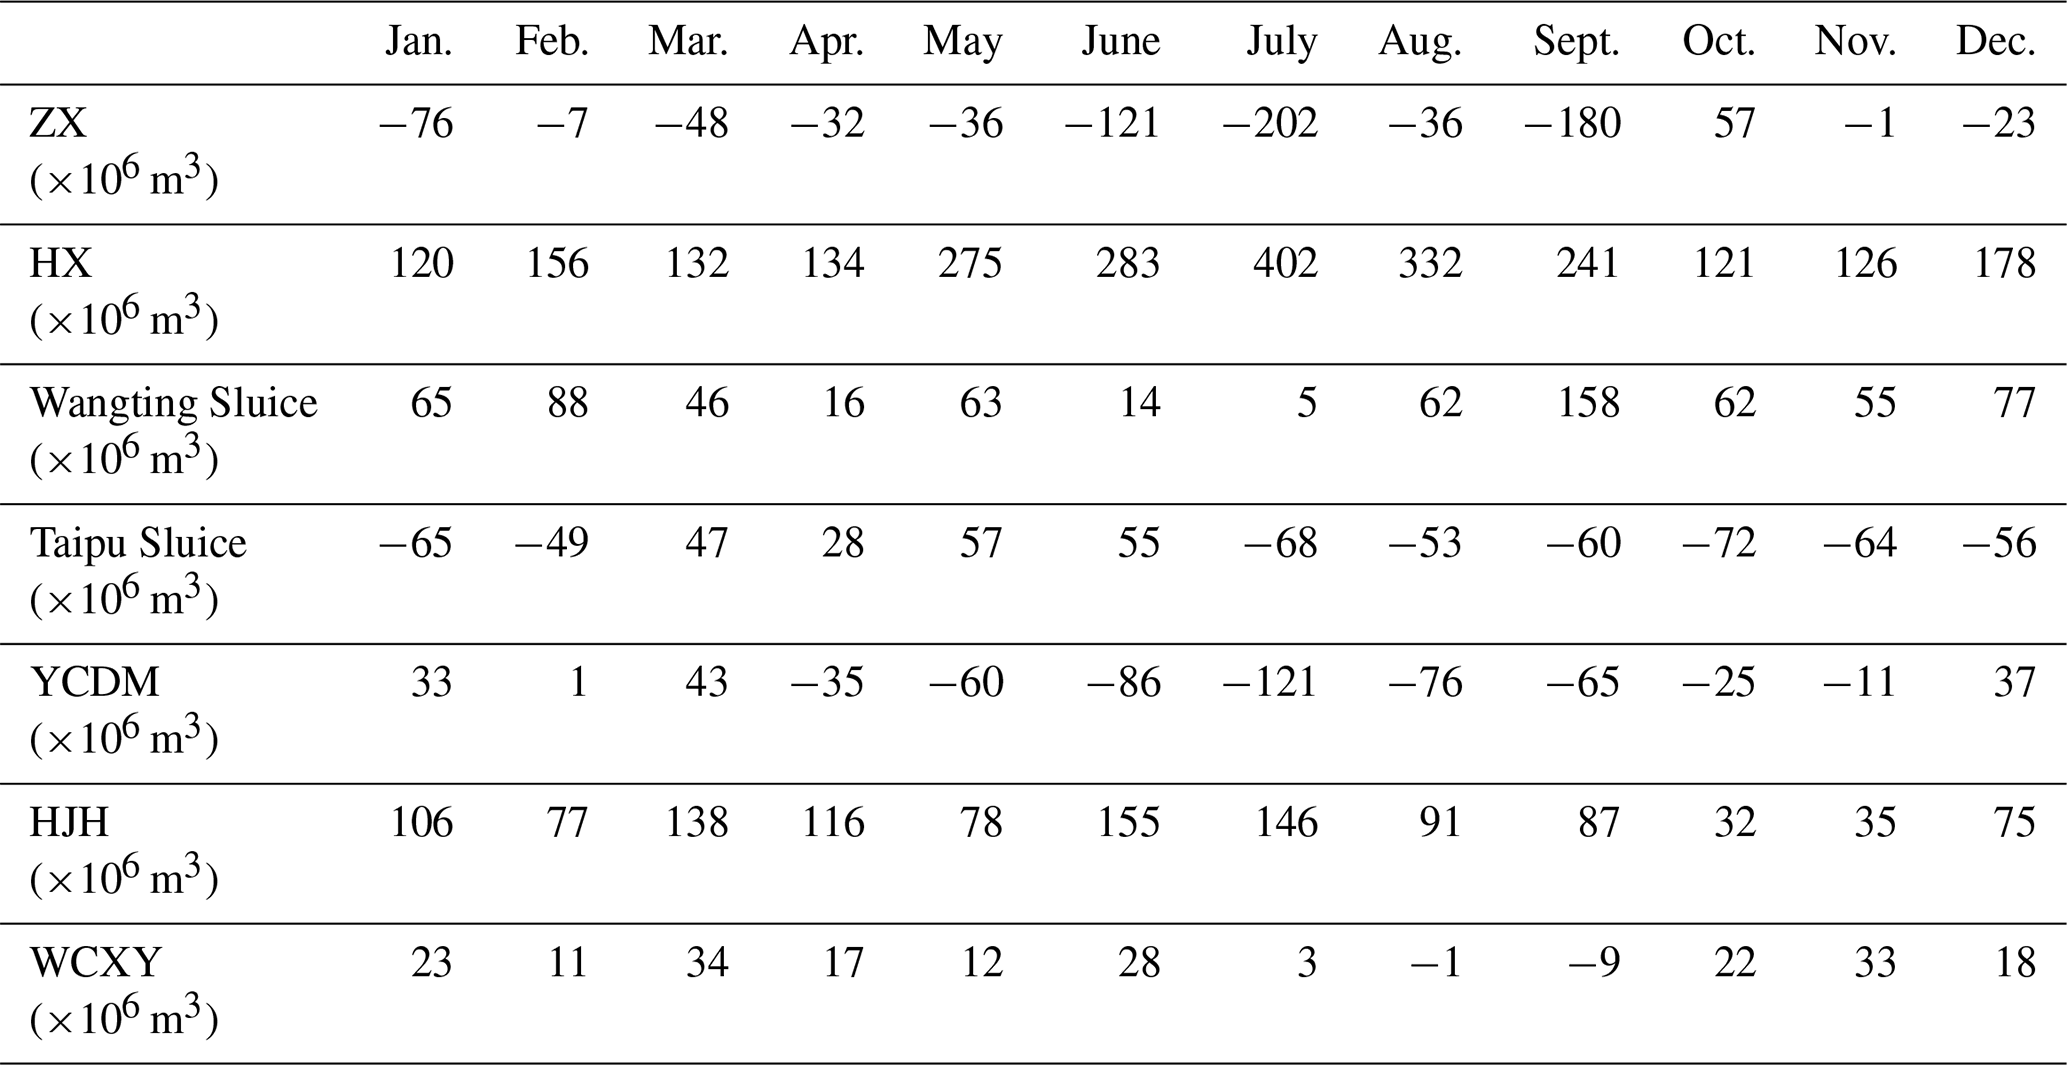
The net inflow and outflow variation into Taihu Lake were compared before 2001 and after 2002, which was showed in Table 7. The net inflow from ZX into Taihu Lake decreased 36 to 202 million m3 in flood season, and decreased 1 to 76 million m3 in non-flood season, however, HX increased 120 to 402 million m3 for all months, while Wangyu Shuice increased 5 to 185 million m3 for all months. The net outflow of Taipu Sluice decreased 49 to 72 million m3 in non-flood season, while the net outflow of YCDM decreased 11 to 121 million m3 from April to November, and increased 1 to 43 million m3 from January to March. The net outflow of HJH increased 32 to 155 million m3 for all months, whereas the net outflow of WCXY increased 11 to 34 million m3 for non-flood season.
Table 7Net inflow and outflow of Taihu Lake variation before 2001 and after 2002.
The average annual inflow and outflow variation into Taihu Lake were compared before 2001 and after 2002, which was showed in Table 8. Compared with inflow into Taihu Lake before 2001, ZX decreased 0.23, HJH decreased 0.73 and WCXY decreased 0.30 billion m3. However, HX increased 2.36 while Wangting Sluice increased 0.83 billion m3. Compared with the outflow from Taihu Lake before 2001, ZX increased 0.48, and HJH increased 0.41 billion m3. Nevertheless, Taipu Sluice decreased 0.31 and YCDM decreased 0.21 billion m3. Compared with the net flow (differences between inflow and outflow) before 2001, the net inflow of HX increased 2.49, Wangting Slucie increased 0.71 while ZX decreased 0.71 billion m3; on the other hand, net outflow of Taipu Sluice decreased 0.30, YCDM decreased 0.35, while net outflow of HJH increased 1.14 and WCXY increased 0.19 billion m3.
Table 8Average annual inflow and outflow of Taihu Lake variation before 2001 and after 2002.
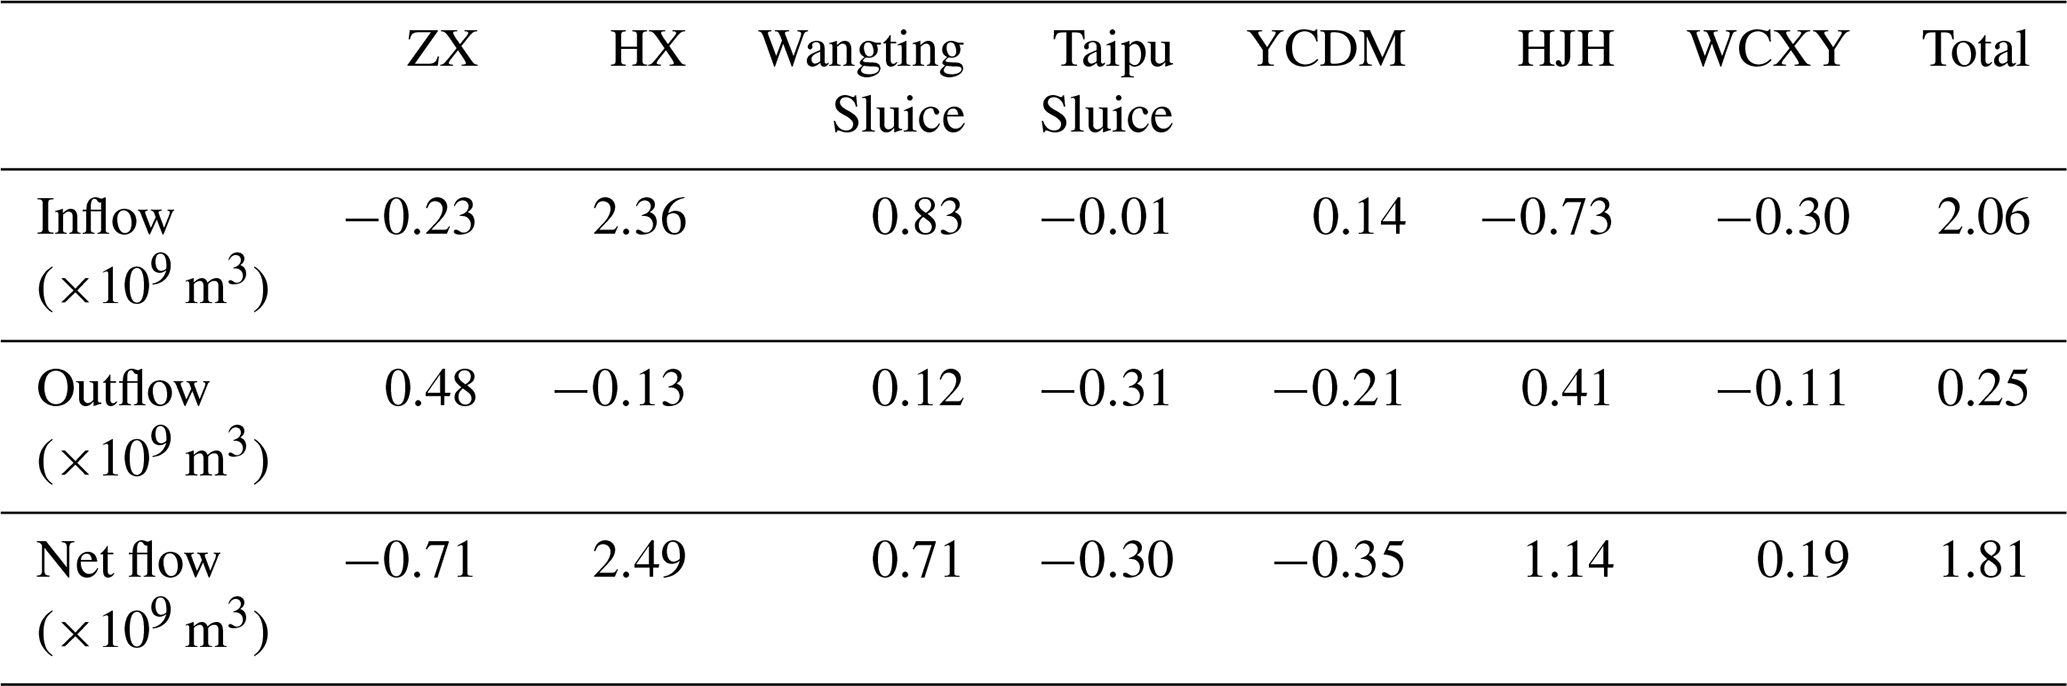
Negative value means decreasing and positive value means increasing.
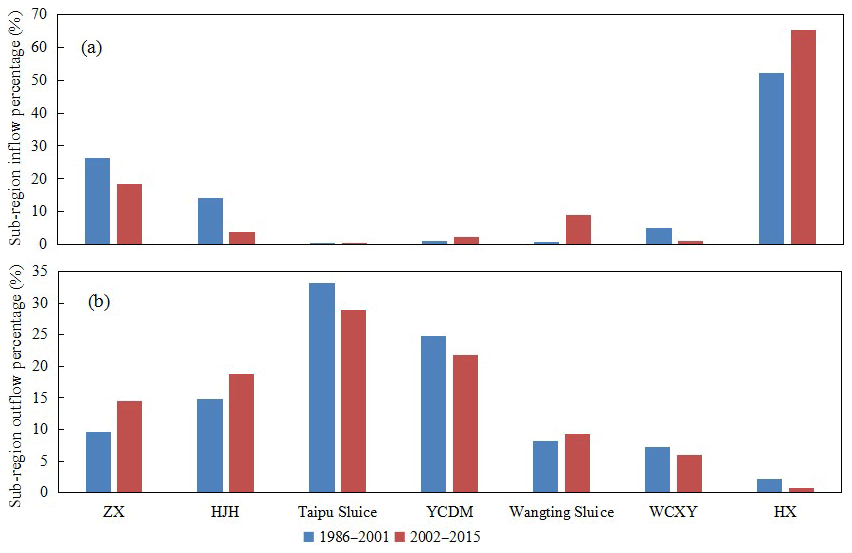
The annual inflow and outflow percentage of sub-regions were compared before 2001 and after 2002, which was showed in Fig. 5. The flood movement pattern changed a lot, with bigger differences existing in inflow percentage of sub-regions. The inflow percentage of ZX, HJH sub-region decreased, whereas HX and Wangting Sluice increased. Total inflow percentage of ZX and HX sub-region were 79 %, and total inflow percentage of Wangting and HX sub-region reached to 74 %, which indicated inflow from Wangting sluice and HX sub-region contribution became more and more important. On the other hand, outflow percentage of ZX and HJH increased, while Taipu Sluice and YCDM decreased. Different from inflow concentrating in HX and Wangting sluice, outflow distribution was relatively uniform.
In order to solve problems in pollution induced water shortage areas, the water diversion from Yangtze River to Taihu Basin through Wangyu River and supplying water to the downstream through Taipu River was initialized by Taihu Basin Authority of Ministry of Water Resources in 2002. From 2002 to 2015, total water diversion from Yangtze River through Wangyu River reached to 27.24 billion m3, with net inflow into to Taihu Lake 12.42 billion m3, and water supplying to downstream through Taipu River reached to 18.28 billion m3. Therefore, the increase of net water diversion along the Yangtze River leads to significant net inflow increase of HX, Wangting Sluice into Taihu Lake. Under this condition, the net outflow from Taihu Lake converted into net inflow into Taihu Lake after 2002.
Under the circumstance of rapid urbanization developments, the HWS, LWS, and AWS of April and May increased, although monthly precipitation of the same period decreased, which may be caused by the water diversion of Wangyu Sluice from Yangtze River. The HWS, LWS, and AWS in August and September demonstrated significant increasing trends , although the precipitation of the same period decreased significantly, which may be caused by the water diversion of Wangyu Sluice and HX sub-region from Yangtze River for storing water resources of non-flood season. The HWS, LWS, and AWS in November and December increased significantly, which may due to precipitation increase as well as water diversion of Wangyu Sluice and WCXY sub-region from Yangtze River in order to satisfy water requirements and improve regional water environment.
During flood fluctuation process, the antecedent influence precipitation had great influence on Taihu water stage increasing, which can be considered as main reflection of land surface condition and soil moisture. The Taihu lake is located in plain river network region with indefinite flow direction, which increased difficulty in runoff depth computation. Therefore, instead of runoff depth, the water stage increase of Taihu Lake was analyzed based on precipitation event (Yan et al., 2015). However, few researches concentrated on the correlation between average precipitation of Taihu Basin and water stage of Taihu Lake under the circumstance of rapid urbanization developments. In this study, the relationship between water stage increase and heavy precipitation event was compared before 2001 and after 2002. Based on flood control experience, a significant increase of Taihu water stage was caused by daily average precipitation of Taihu Basin more than 20.0 mm. In order to eliminate effects of previous precipitation or compound flood, the first and last four days of the selected event were less than 1.0 mm, while the starting point to water stage peak lasted for no more than 10 d. Total precipitation amount was defined as daily average precipitation accumulation, and water stage increase was defined as differences from starting point to water stage peak.
For the period before 2001, we selected 116 events with precipitation 57.8 mm, while the water stage increased from 3.10 to 3.22 m averagely. For the period after 2002, we selected 39 events with precipitation 55.9 mm, while the water stage increased from 3.27 to 3.38 m averagely. Compared with water stage increase for the same precipitation before 2001 shown in Table 9, water stage increase after 2002 did not change too much when precipitation was less than 100.0 mm, while the water stage increased more significantly when precipitation was more than 120.0 mm. The more precipitation was, the more quickly water stage increased. The water stage increased 0.10 m for 50.0 mm precipitation, namely 5.0 mm precipitation increased 0.01 m water stage averagely. The water stage increased 0.25 m for 100.0 mm precipitation, namely 4.0 mm precipitation increased 0.01 m averagely. The water stage increased almost 0.40 m for 150.0 mm precipitation, namely 3.8 mm precipitation increased 0.01m averagely.
Table 9Relationships between precipitation and water stage increase before 2001 and after 2002.
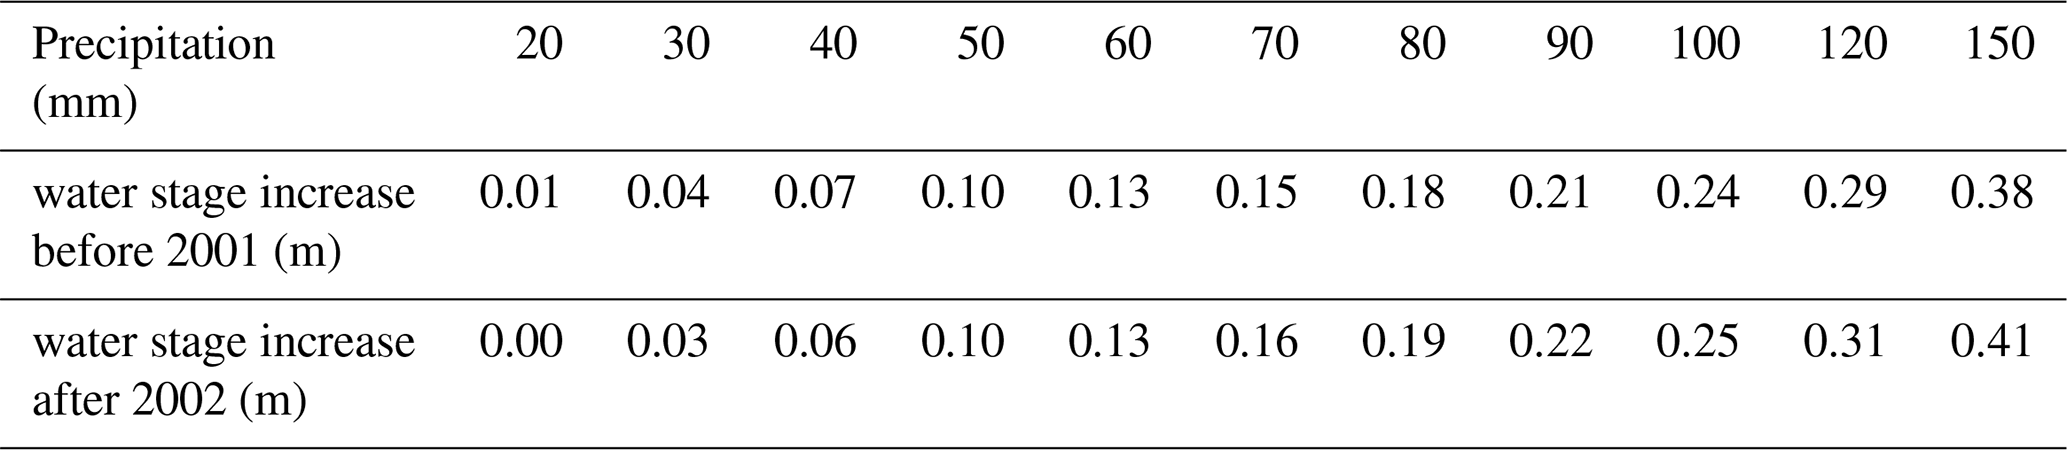
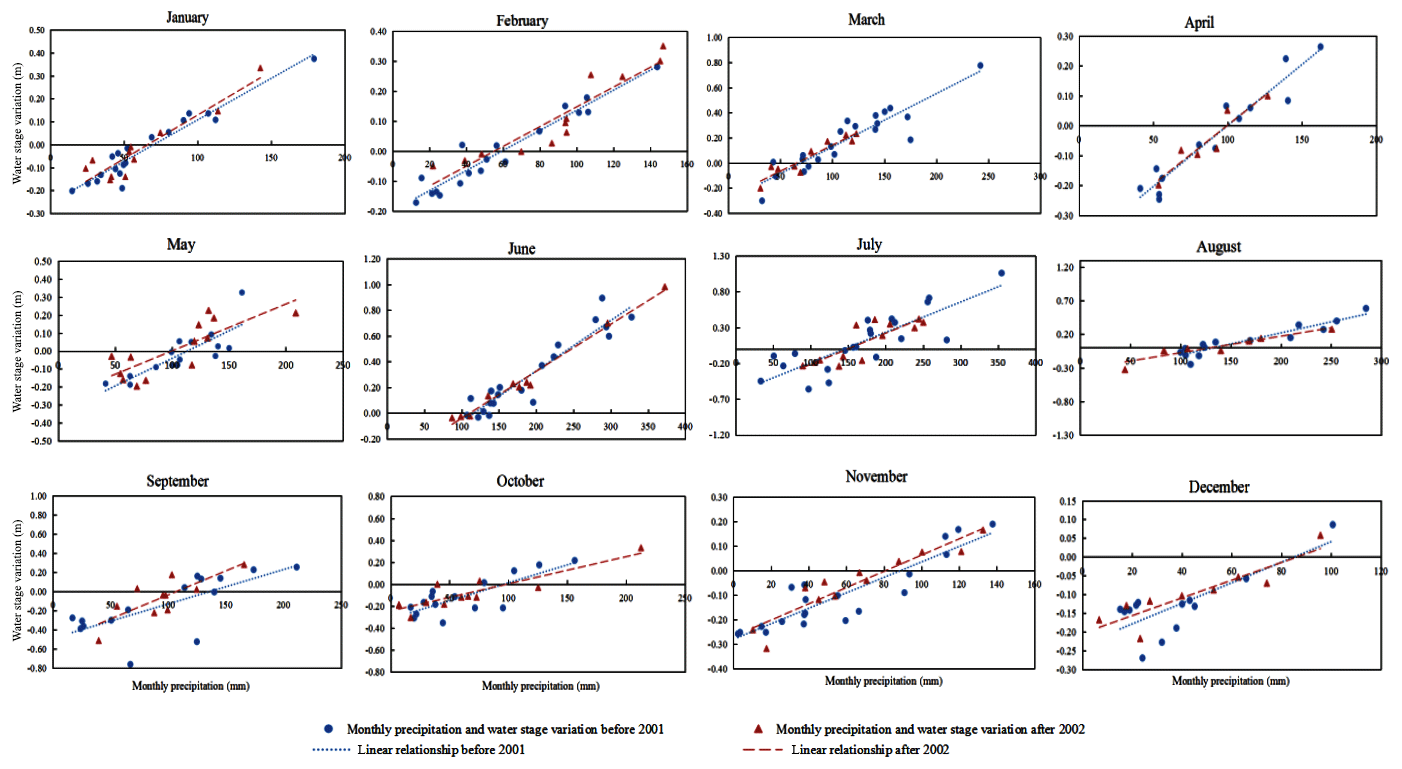
Figure 6Relationships between monthly precipitation and water stage variation before 2001 and after 2002.
Monthly water stage variation increased 0.01 to 0.02 m in non-flood season for the same monthly multi-year average precipitation. Monthly water stage variation increased more when precipitation is abundant, while monthly water stage variation decreased less when precipitation is scare. However, For the same monthly multi-year average precipitation in flood season, monthly water stage variation after 2002 increased 0.04 m in May, 0.01 m in June, 0.08 m in September, which was caused by the water diversion of Wangyu Sluice into Taihu lake from Yangtze River for storing water resources of non-flood season after 2002. However, monthly water stage variation decreased 0.01 m in August for the same monthly multi-year average precipitation after 2002, monthly water stage variation decreased more in August in abundant precipitation. Relationships between monthly precipitation and water stage variation were demonstrated in Fig. 6.
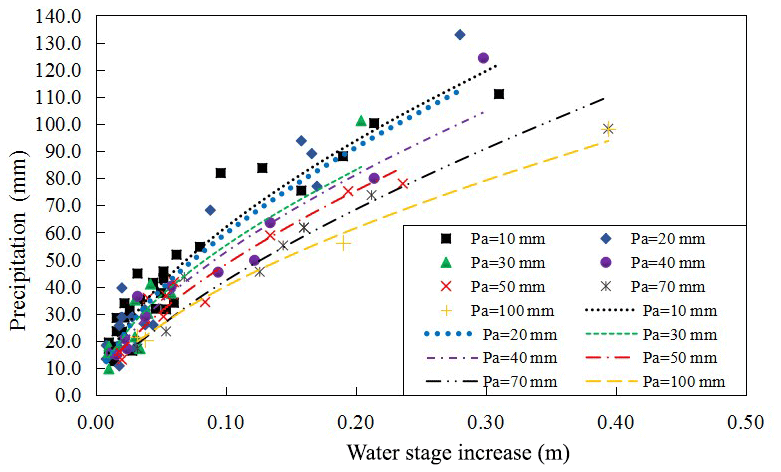
Accumulated precipitation amount more than 20.0 mm concentrated in flood season from 2002 to 2015, was selected in the , which was demonstrated in Fig. 7. With the value of Pa increased from 10 to 100 mm, the curve got closer to abscissa axis, and the upper part of curves were approximately parallel. Under the same precipitation amount with 50 mm, water stage increased 0.07 m when Pa equals 10 mm water stage increased 0.08 m when Pa equals 20 mm, water stage increased 0.09 m when Pa equals 30 mm, water stage increased 0.095 m when Pa equals 40 mm, water stage increased 0.11 m when Pa equals 50 mm, water stage increased 0.13 m when Pa equals 70 mm, and water stage increased 0.14 m when Pa equals 100 mm.
Based on forecasts application requirement and technical level, the permissible error of Taihu water stage peak was set as 0.10 m according to Chinese national standards for hydrological forecasting (Chinese National Standards, 2008). The success rate was defined as ratio between Taihu water stage peak forecasts number within permissible error not more than 0.10 m and total forecasts number. 30 precipitation events in 2016 and 2017 were selected for parameters validation with success rate 93 %, which can achieve first grade in real-time flood forecasts.
In this paper, precipitation, water stage, net water diversion along the Yangtze river, as well as net inflow and outflow of Taihu Lake using long time data, were analyzed under rapid urbanization developments. Moreover, the correlation between precipitation and water stage were discussed. The following conclusion is gained:
The monthly precipitation of Taihu Basin and its sub-regions decreased significantly in April, May, and September, while increased in January, February, March, October, November and December. The HWS, LWS, AWS of all months had increasing trends, and HWS increased more than 0.18 m, LWS 0.19 m and AWS 0.17 m in the non-flood season after 2002.
The monthly net water diversion and drainage amount along the Yangtze River in HX sub-region increased 27 to 120 million m3 in flood season, while Wangyu Shuice increased 239 million m3 in September, with 52 to 179 million m3 increase in non-flood season after 2002. Total net inflow into Taihu increased 1.81 billion m3, of which HX increased 2.49 billion m3 and Wangting Sluice increased 0.71 billion m3 after 2002.
The correlation between precipitation and water stage increase after 2002 did not change too much when precipitation was less than 100.0 mm. The water stage peak had strong relationships with starting point.The higher starting point was, the higher water stage peak was. The more precipitation for the same period was, the more quickly water stage increased. Thus, meeting the demands of water resources utilization, reducing initial water level of Taihu Lake by applying pre-discharging method could take an active role of flood control.
Monthly water stage variation increased 0.01 m to 0.02 in non-flood season for the same monthly multi-year average precipitation. For the same monthly multi-year average precipitation in flood season, monthly water stage variation after 2002 increased 0.04 m in May, 0.01 m in June, 0.08 m in September, which was caused by the water diversion of Wangyu Sluice into Taihu lake from Yangtze River for storing water resources of non-flood season after 2002. With the value of Pa increased from 10 to 100 mm, the curve got closer to abscissa axis, and the upper part of curves were approximately parallel.
In conclusion, urbanization has an evident influence on the increase of Taihu water stage. Nevertheless, urbanization on water stage increase is the interaction of precipitation and underlying surface variation. Thus, in order to evaluate the impacts of urbanization on Taihu Basin in detail, each characteristic of urbanization indicator contributed to water stage rise should be quantified and assessed in the following study.
The data use in this paper are not publicly accessible.
JW and ZW initiated the concept, structured and wrote the article. SJ, HL reviewed the manuscript and provided valuable suggestions. JW, HJ, ML, YG processed precipitation, water stage, net inflow of Taihu Basin, net water diversion data along the Yangtze River.
The authors declare that they have no conflict of interest.
This article is part of the special issue “Hydrological processes and water security in a changing world”. It is a result of the 8th Global FRIEND-Water Conference: Hydrological Processes and Water Security in a Changing World, Beijing, China, 6–9 November 2018.
This research has been supported by the National Key Research and Development Program (grant no. 2018YFC0407900), the National Science Foundation of China (grant no. 51779071), the National Science Foundation of China (grant no. 51579065), the National Key Research and Development Project (grant no. 2017YFC1502403), and the Special Public Sector Research Program of Ministry of Water Resources of China (grant no. 201501014).
Chen, Z. Y. and Wang, Z. H.: Yangtze Delta, China: Taihu lake-level variation since the 1950s, response to sea-level rise and human impact, Environ. Geol., 37, 333–339, 1999.
Cheng, J., Yang, K., Zhao, J., Yuan, W., and Wu, J. P.: Variation of river system in center district of Shanghai and its impact factors during the last one hundred years, Scientia Geographica Sinica, 27, 85–91, https://doi.org/10.13249/j.cnki.sgs.2007.01.85, 2007.
Chinese National Standards: Standard for hydrological information and hydrological forecasting, Chinese Ministry of Water Resources-GB/T 22482-2008, 5–6, 2008.
Deng, X. J., Xu, Y. P., Han, L. F., and Wang, Y. F.: Impacts of urbanization on river systems in the Taihu Region, China, Water, 7, 1340–1358, https://doi.org/10.3390/w7041340, 2015.
Deng, P. X., Xu, Y. P., Han, L.F., Yang, M. N., Yang, L., Song, S., Li, G., and Wang, Y. F.: Spatial-temporal evolution of the distribution pattern of river systems in the plain river network region of the Taihu Basin, China, Quaternary Int., 392, 178–186, https://doi.org/10.1016/j.quaint.2015.04.010, 2016.
Dudgeon, D.: The impacts of human disturbance on stream benthic invertebrates and their drift in North Sulawesi, Indonesia, Fresh Water Biol., 51, 1710–1729, https://doi.org/10.1111/j.1365-2427.2006.01596.x, 2006.
Elmore, A. J. and Kaushal, S. S.: Disappearing headwaters: Patterns of stream burial due to urbanization, Front. Ecol. Environ., 6, 308–312, https://doi.org/10.1890/070101, 2008.
Gong, Z. and Lin, Z. X.: Strategy of flood control in Taihu Basin, Advances in Water Resources and Hydraulic Engineering-Proceedings of 16th IAHR-APD Congress and 3rd Symposium of IAHR-ISHS, 3, 1011–1016, 2008.
Gregory, K. J.: The human role in changing river channels, Geomorphology, 79, 172–191, https://doi.org/10.1016/j.geomorph.2006.06.018, 2006.
Hu, Q. F. and Wang, Y. T.: Impact assessment of climate change and human activities on annual highest water level of Taihu Lake, Water Sci. Eng., 2, 1–15, https://doi.org/10.3882/j.issn.1674-2370.2009.01.001, 2009.
Li, G. F., Xiang, X. Y., Tong Y. Y., and Wang, H. M.: Impacts assessments of urbanization on flood risk in the Yangzte river Delta, Stoch. Environ. Res. Risk Assess., 27, 1683–1693, https://doi.org/10.1007/s00477-013-0706-1, 2013.
Li, W., Yang, M. Y., Liang, Z. W., Zhu, Y., Mao, W., Shi, J. Y., and Chen, Y. X.: Assessment for surface water quality in Lake Taihu Tiaoxi River Basin China based on support vector machine, Stoch. Environ. Res. Risk Assess., 27, 1861–1870, https://doi.org/10.1007/s12665-016-6051-1, 2013.
Liu, L. and Xu, Z. X.: Hydrological projections based on the coupled hydrological-hydraulic modeling in the complex river network region: a case study in the Taihu basin, China, J. Water Clim. Change, 6, 386–399, https://doi.org/10.2166/wcc.2014.156, 2015.
Liu, L., Xu, Z. X., Reynard, N. S., Hu, C. W., and Jones, R. G.: Hydrological analysis for water stage projections in Taihu Lake, China, J. Flood Risk Manage., 6, 14–22, https://doi.org/10.1111/jfr3.12015, 2013.
Mann, H. B.: Nonparametric tests against trend, Econometrica, 13, 245–259, https://doi.org/10.2307/1907187, 1945.
Peng, D. Z., Qiu, L. H., Fang, J., and Zhang, Z. Y.: Quantification of Climate Changes and Human Activities That Impact Runoff in the Taihu Lake Basin, China, Math. Probl. Eng., 2016, 1–7, https://doi.org/10.1155/2016/2194196, 2016.
Shi, Y. L., Wang, R.S., Fan L. Y., Li, J. S., and Yang, D. F.: Analysis on land-use change and its demographic factors in the original-stream watershed of Tarim river based on GIS and statistic, Procedia Environ. Sci., 2, 175–184, https://doi.org/10.1016/j.proenv.2010.10.021, 2010.
Taihu Basin Authority of Ministry of Water Resources: Taihu basin and southeast rivers water resources bulletin, available at: http://www.tba.gov.cn/slbthlyglj/szygb/content/slth1_8931163d6fc84971b633faea493e0a40.html (last access: 7 August 2020), 2015.
Wang, L., Cai, Y. L., Chen, H. Q., Dag, D., Zhao, J. M., and Yang, J.: Flood disaster in Taihu Basin, China: causal chain and policy option analyses, Environ. Earth Sci., 63, 1119–1124, https://doi.org/10.1007/s12665-010-0786-x, 2011.
Wang, Y. F., Xu, Y. P., Xu. Y., Song, S., Li, G., and Wu, L.: Changing patterns of extreme water stages in urbanizing plain river network region of Taihu Basin, China: characteristics and causes, Hydrol. Earth Syst. Sci., 1–24, https://doi.org/10.5194/hess-2016-184, 2016.
Wang, Y. K., Sheng, D., Wang, D., Ma, H. Q., Wu, J. C., and Xu, F.: Variable Fuzzy Set Theory to Assess Water Quality of the Meiliang Bay in Taihu Lake Basin, Water Resour. Manage., 28, 867–880, https://doi.org/10.1007/s11269-014-0521-6, 2014.
Wu, J. C., Shi, X. Q., Ye, S. J., Xue, Y. Q., Zhang, Y., and Yu, J.: Numerical simulation of land subsidence induced by groundwater overexploitation in Su-Xi-Chang area, China, Environ. Geol., 57, 1409–1421, https://doi.org/10.1007/s00254-008-1419-5, 2009.
Wu, H. Y. and Guan, W. Q.: 1991's flood in Taihu basin, Beijing, China Water Power Press, 170, 2000.
Xie, J. B., Sayers, P., Sun, D. Y., and Zhang, H. H.: Broadscale reliability analysis of the flood defence infrastructure within the Taihu Basin, J. Flood Risk Manag., 6, 42–56, https://doi.org/10.1111/jfr3.12034, 2013.
Xu, Z. X., Takeuchi, K., and Ishidaira, H.: Monotonic trend and step changes in Japanese precipitation, J. Hydrol., 279, 144–150, https://doi.org/10.1016/S0022-1694(03)00178-1, 2003.
Yan, Q. H., Lei, T. W., Yuan, C. P., Lei, Q. X., Yang, X.S., Zhang, M. L., Su, G. X., and An, L. P.: Effects of watershed management practices on the relationships among rainfall, runoff, and sediment delivery in the hilly-gully region of the Loess Plateau in China, Geomorphology, 228, 735–745, https://doi.org/10.1016/j.geomorph.2014.10.015, 2015.
Yang, M. N., Xu, Y. P., Pan, G. B., and Han, L. F.: Impacts of urbanization on precipitation in Taihu Lake Basin, China, J. Hydrol. Eng., 19, 739–746, https://doi.org/10.1061/(ASCE)HE.1943-5584.0000852, 2014.
Yin, Y. X., Xu, Y. P., and Chen, Y.: Relationship between flood/drought disasters and ENSO from 1857 to 2003 in the Taihu Lake basin, China, Quat. Int., 208, 93–101, https://doi.org/10.1016/j.quaint.2008.12.016, 2009.
Yin, Y. X., Xu, Y. P., and Chen, Y.: Relationship between changes of river-lake networks and water stages in typical regions of Taihu Lake Basin, China, Chinese Geographical Science, 22, 673–682, https://doi.org/10.1007/s11769-012-0570-9, 2012.
Yu, G., Xue, B., Lai, G. Y., and Liu, X. M.: A 200-year historical modeling of catchment nutrient changes in Taihu basin, China, Hydrobiologia, 581, 79–87, https://doi.org/10.1007/978-1-4020-6158-5_9, 2007.
Yuan, W., Philip, J., and Yang, K.: Impact of urbanization on structure and function of river system: case study in China, Chinese Geographical Science, 16, 102–108, 2006.
Zeng, C. F. and Wang, L. C.: A study of hydrologic responses to land use and cover change in Taihu Lake Basin, southeast China, J. Food Agr. Environ., 10, 1404–1408, 2012.
Zhao, Q. J. and Wen, Z. M.: Integrative networks of the complex social-ecological systems, Proc. Environ. Sci., 1383–1394, https://doi.org/10.1016/j.proenv.2012.01.131, 2012.
Zhao, D. Y., Ge, L. B., and Huang, G. Y.: Research on water stage correction for depressed area, Journal of China Hydrology, 35, 72–76, 2015.
Zhao, F. F., Xu, Z. X., and Huang J. X.: Long-term trend and abrupt change for major climate variables in the upper Yellow River basin, Acta Meterol. Sin., 21, 204–214, https://doi.org/10.1029/2006JD007471, 2007.
Zhao, G. J., Gao, J. F., Tian, P., and Ni, G. H.: Spatial-temporal characteristics of surface water quality in the Taihu Basin, China, Environm. Earth Sci., 64, 809–821, https://doi.org/10.1007/s12665-011-0902-6, 2011.
Zhao, J., Shan, F. Z., Yang, K., and Wu, E. K.: River sinuosity in tidal plain and its response to rapid urbanization, Adv. Water Sci., 22, 631–637, 2011.
Zhou, F., Xu, Y. P., Chen, Y., and Du, J. K.: Hydrological response to urbanization at different spatio-temporal scales simulated by coupling of CLUE-S and the SWAT model in the Yangtze River Delta region, J. Hydrol., 485, 113–125, https://doi.org/10.1016/j.jhydrol.2012.12.040, 2013.
Zhu, H. F., Ren, X. Y., Jin, Y., Yang, K., and Che, Y.: Multilevel analysis of a riverscape under rapid urbanization in the Yangtze delta plain, China: 1965–2006, Environ. Monitor. Assess., 187, 711–724, https://doi.org/10.1007/s10661-015-4931-6, 2015.