the Creative Commons Attribution 4.0 License.
the Creative Commons Attribution 4.0 License.
 | 22 Apr 2020
Subsidence prediction of reinforced soil layer by geosynthetic using large-scale 1g physical model
Mouhamad Hassoun
Pascal Villard
Fabrice Emeriault
Abbas Farhat
Subsidence can result from the collapse of underground cavities. The impact of the movements on existing structures and infrastructures is generally dramatic. Geosynthetic sheets (RG) can be used to reduce their impact. This paper focuses on the use of large-scale physical modelling to study the subsidence mechanisms and to estimate the RG efficiency for cohesive or granular soil layers. The results have shown that the RG reduced the ground movement even under important overload. The deformation of the RG and the surface settlement depend both on the soil type and overload intensity. The experimental results are compared to analytical solutions proposed to design the RG for cohesive and granular soils. Stress distribution on the RG was investigated. The analytical and experimental results are rather similar, that shows the relevance of the analytical models to predict the behaviour of reinforced soil layers.
- Article
(533 KB) - Full-text XML
- BibTeX
- EndNote


The French territory contains ubiquitous occurrences of natural or anthropic cavities. These cavities can collapse and cause damage to structures and infrastructures. Prediction, prevention and mitigation are the main tools to avoid the potential damage.
The mitigation methods are divided into two categories: active and passive techniques. The use of geosynthetic sheets as reinforcement (RG) is one of the active mitigation techniques. It prevents the collapse of the soil and limits subsidence at the land surface. The estimation of the surface settlement of RG reinforced soil layers depends on the dimensions of the cavity, the soil embankment thickness, the RG stiffness, the mechanical properties of the soil, the soil/geosynthetic frictional interface parameters and the type of the overloading. Different design methods can be used to estimate the surface subsidence and to design the geosynthetic sheet: Giroud model (1995), the British Standard BS 8006, and the analytical methods derived from RAFAEL research program (Briançon and Villard, 2008; Hassoun et al., 2018, etc.). The domain of validity of these methods is restricted to the case of granular soil. For the case of a cohesive substrate, Huckert (2014) has proposed an analytical model taking into account block fracturing of the cohesive soil layer. The objective of the present work is to compare and validate the analytical models proposed for granular and cohesive soils, using experimental results obtained considering progressive loadings.
Ineris has developed a test platform to study the risks associated with the collapse of underground cavities (Fig. 1). The model consists of a tank designed to receive up to 6 m3 of soil. The test platform is equipped with 15 jacks associated each to a square trapdoor 0.25 m by 0.25 m. Thus, the physical model allows reproducing the formation of a total cavity of 1.25 m by 0.75 m. The model is equipped with: (i) two cameras, in order to detect the 3D movements of the surface, (ii) 7 radars used to measure the vertical displacements of the RG and (iii) 7 sensors to measure the stress within the soil around the cavity (Fig. 1).

Figure 1Description of the 3D-1g physical model and location of the radars “R” and of the pressure measurement cells “C”.
3 tests were carried out to reproduce the formation of a cavity at the base of a granular (SF) or cohesive soil (SK) (H=12.5 cm) reinforced by RG. The cavity has a square section (B=50 cm). The ratio between the thickness of the soil layer and the width of the cavity is: . Two types of soil were used: Fontainebleau sand (SF) and cohesive soil (70 % dry Fontainebleau sand +30 % dry kaolin with a water content of 8 %: SK). The sand is characterized by its friction angle (35∘) and the cohesive soil by cohesion (35 kPa) and friction angle (29∘). The RG is characterized by failure strength (11.9 kN m−1), failure strain (12 %) and the initial tensile stiffness corresponding to 2 % of strain is approximately 170 kN m−1. The 1.7 m×1 m RG sheet was roughly attached around the tank, but not enough to prevent slippage, especially along the axis of 1m length, so that assumption of unidirectional reinforcement was achieved. The test procedure is: soil installation and compaction, lowering of the jacks to simulate the cavity formation, progressive loading on the soil surface and unloading. The result analysis is performed at each step of the procedure.
3.1 Granular soil – Fontainebleau sand
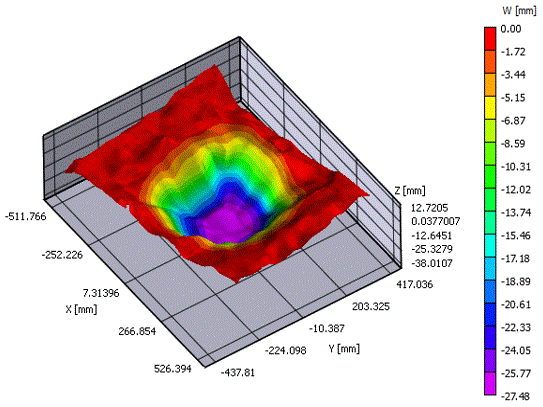
In the absence of the RG, the opening of the cavity created a complete void at the surface. The presence of the RG limits the soil collapse and induces subsidence with a maximum occurring in the centre of the cavity equal to 27.8 mm (Fig. 2).

Figure 3Vertical displacements of the RG after the cavity formation and surface subsidence W.
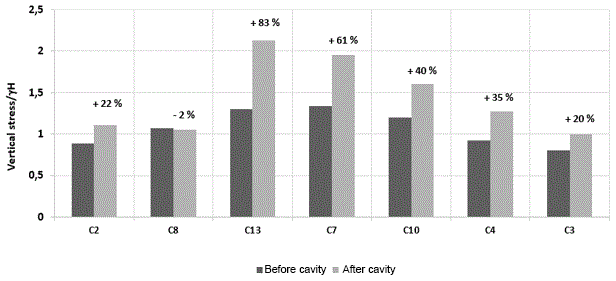
Figure 4Initial and final stress at the base of the soil layer in the case of the granular soil (Fontainebleau sand).
The subsidence surface is slightly larger than the area of the cavity. The deformation of the RG is flattened, mainly in the central part above the cavity (Fig. 3). This is explained by the fact that the load acting on the RG is not uniform. The displacements of the soil surface are smaller than those of the RG thanks to the expansion of the granular soil volume. Figure 4 presents the measurements of the vertical stresses before and after the formation of the cavity. The initial stress measured is of the order of 40 % compared to γH. The difficulty of measuring the stresses in that the sand is very well identified (Hassoun et al., 2018). The final stresses increase by 80 % after the formation of the cavity close to its boundary.
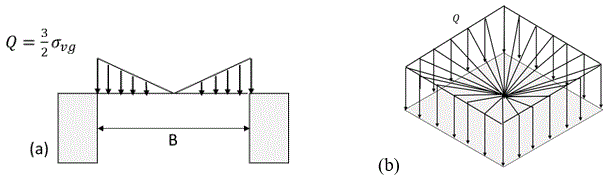
Figure 5RG stress distribution above the cavity (a) 2D representation on the central geosynthetic strip and (b) 3D representation.
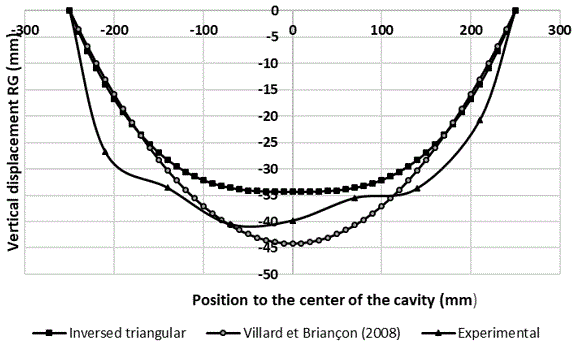
Figure 6Comparison of experimental and analytical RG vertical displacements after cavity opening – granular soil.
The vertical displacements of the RG were calculated analytically (Briançon and Villard, 2008). The two friction angles of the interface (geosynthetic/soil and geosynthetic/wood plate friction) in the anchor zones are estimated at 30 and 22∘ respectively. The analytical solution is developed for 2D conditions and the RG is assumed to be unidirectional (Briançon and Villard, 2008). The load transfer hypothesis proposed by Terzaghi for circular cavities (Eq. 1, 1946) leads to a theoretical value of the uniformly distributed load σvg acting on the RG of 1.82 kN m−12. The soil characteristics are: K=0.27, γ=15.3 kN m−1 and ϕ=35∘. K is assumed to be the active earth pressure coefficient (K) but its value is not well established. Following 2D laboratory experiments, Chevalier et al. (2012) has proposed values of K equal to 0.55 and 1.2 for coarse sand and gravel respectively. P is the overload applied on the surface.
The 2D design method (Briançon and Villard, 2008) is applied to the geosynthetic strip, sited in the axis of the cavity. Load distribution is assumed to be uniform or to have an inverse triangular shape in 3D as presented in Fig. 5b. Figure 6 presents the analytical and experimental results. As it can be seen, the proposed load distribution, in form of an inverse triangle, allows to obtain a better concordance between the experimental and analytical deformations of the geosynthetic.
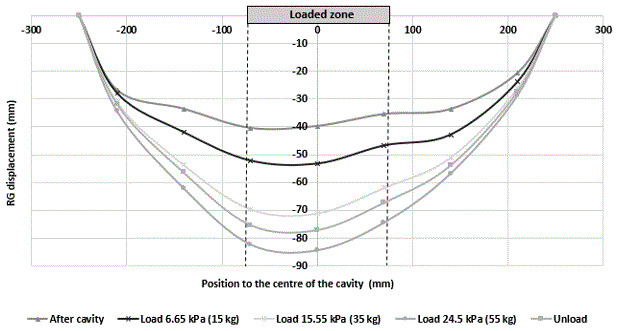
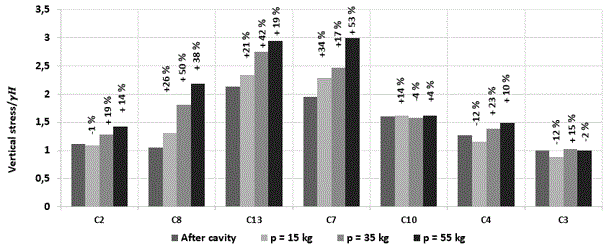
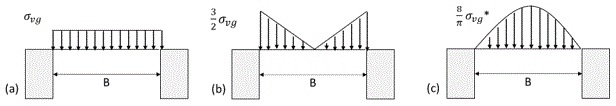
Figure 92D stress distribution geometries (a) uniform, (b) inverse triangular and (c) parabolic.
Effect of overload: after the opening of the cavity, the soil surface is overloaded in the centre of the cavity on a 15 cm wide square surface. The overload was applied progressively in three phases: 15, 35 and 55 kg. Figure 7 shows the vertical displacements of RG. The application of a localized overload in the axis of the cavity increases the RG deflection mainly in the central part of the cavity. The unloading phase resulted in an elevation of the RG. The RG deflection obtained at the end of the unloading remains greater than the value before loading, due to the sliding of the geosynthetic in the anchorage areas and the presence of the soil layer that collapsed on the GR and whose behaviour is not reversible (Fig. 7).
To compare the analytical deformation of the RG to the experimental ones, three geometries of stress distribution on the RG have been studied (Fig. 9). The analytical displacement is calculated on the geosynthetic strip, sited in the axis of the cavity. The different load distributions proposed respect the total load calculated using Terzaghi equation 1 (equivalent loads of p respectively 0.6, 1.4 and 2.2 kN m−1 were used to take into account the overloading of 15, 35 and 55 kg). Based on this assumption the maximal value of the overloading for the parabolic distribution is and for the inverted triangular distribution is instead of for the inverted triangular distribution ().
Table 1 compares the analytical and experimental results. The stress distribution acting on the RG, for localized loading, is no longer inverse triangular. Therefore, loading the soil surface modifies the geometry of the load distribution on the RG, from initially inverse triangular to a distribution whose maximum value is in the centre of the cavity.

3.2 Cohesive soil: sand-kaolin
Two tests with the cohesive soil (SK1 and SK2) were carried out. Under the self-weight of the soil, the cohesive soil layers bridge the cavity area and behave as a flexural slab which limits the vertical displacement to values smaller than 2 mm. The maximal vertical displacement of the RG in the axis of the cavity is 7 mm due only to its self-weight. After the opening of the cavity, the stress measured by the sensors closest to the cavity C7, C8 and C13, C10 increase (Fig. 10). The furthest sensors from the cavity (C2, C3 and C4) recorded a small stress increase. The comparison of stress measurements between granular and cohesive soil is presented in Fig. 11. The load of C2, C3 and C4 cells, the furthest away from the cavity, are greater in the case of the granular soil than those obtained with the cohesive soil, for which very small increases in stress are recorded.
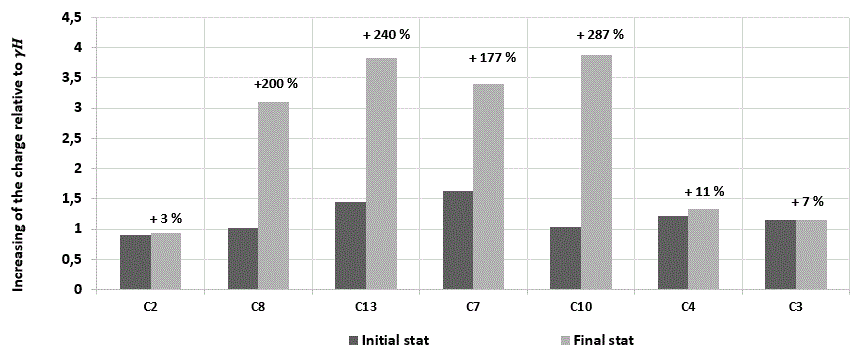
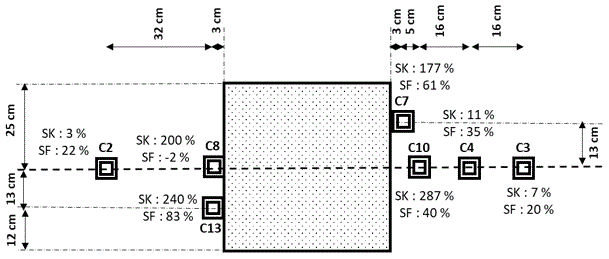
Figure 11Comparison of load transfer in cases of granular soil (average of SF1 and SF2) and cohesive soils (SK1).
As a result, in the case of granular soils, the transferred loads are less intense and more diffuse, whereas they are, due to the beam-like behaviour of the cohesive soil layer, more intense and localized at the edge of the soil.
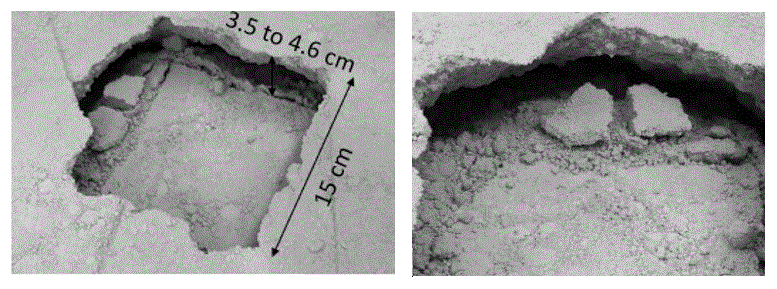
Effect of overload: a progressive overload was applied on the soil surface in the axis of the cavity. Sudden collapse occurred at a load of 55 kg (breakage stress of 24.5 kPa). The collapse of the soil layer leads to a localized subsidence restricted to the loading surface. The volume of collapsed soil is approximately a truncated pyramid of height H with a base equal to the size of the cavity (50 cm×50 cm, Fig. 12). The collapse of the soil layer leads to a vertical displacement of the RG of 54.6 and 58.6 mm for the two tests SK1 and SK2. The average horizontal slippages of the geosynthetic at the right and left edges of the cavity for SK1 and SK2 are 2 and 0.75 mm, respectively.
The comparison of the RG deformations between the experiments with Fontainebleau sand and the sand-kaolin mixture (performed under the same conditions), shows (Figs. 7 and 14) that the deformation of the RG is flattened in the case of the cohesive soil. This flattened shape is a consequence of the breakage in blocks acting in a specific way onto the geosynthetic. Figure 15 compares the maximum RG deflection for both soils. There is a gradual evolution of the geosynthetic deflection in the case of the sand soil layer whereas a sudden soil movement is obtained in the case of cohesive soil. In addition, the deformations of the RG in the central part of the cavity in the case of the cohesive soil are always smaller than those obtained with the sand, even after unloading.
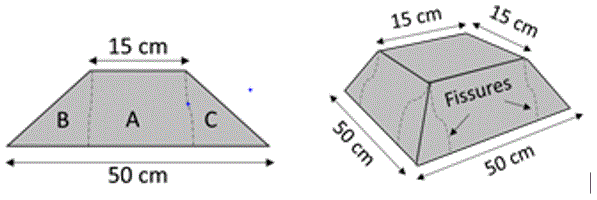
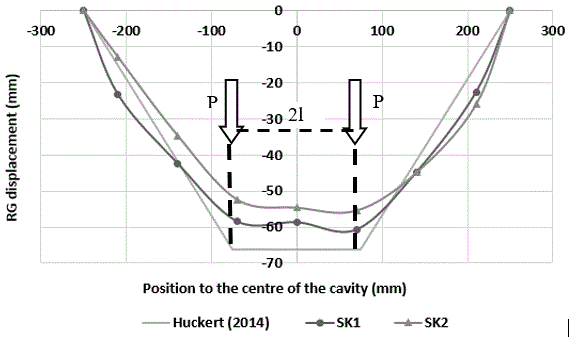

Figure 15Comparison of the maximum deflection of the geosynthetic during the different phases of the loading tests.
Analysis of stresses evolution: After the cavity opening and for a load of less than 55 kg, the sensors C2, C3 and C4, furthest away from the cavity, did not detect any increase in stress. The largest load transfer increase was measured by the C8 sensor for which the stress is increased by 720 %. The two sensors C7 and C13, sited symmetrically to the axis of the cavity, have measured three times the initial value obtained before the cavity opening, i.e. 331 % and 301 % respectively. For an overload of 55kg for which the soil layer was broken, the collapse of the soil layer lead to a sudden drop in stress on various sensors, particularly those closest to the collapse zone.
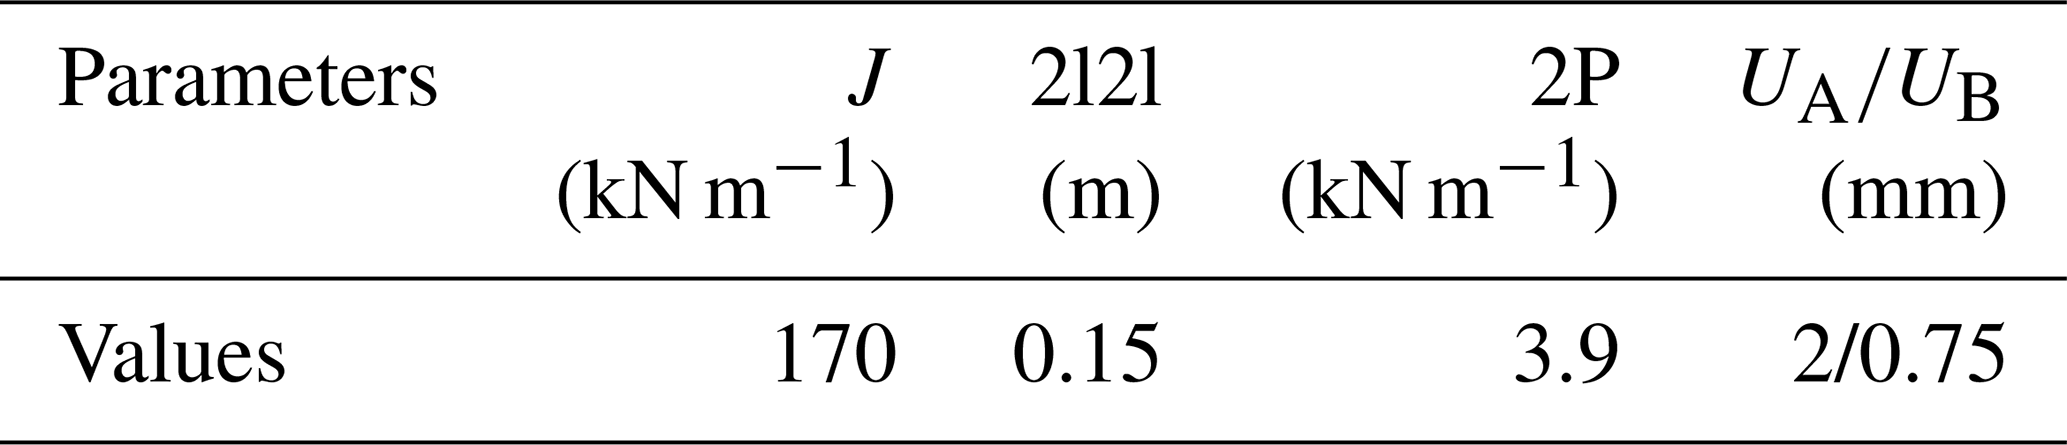
Analysis of load transfer mechanisms: the collapse mechanism obtained in Fig. 12 is quite similar to the one proposed by Huckert (2014), who assimilates the action of the collapsed blocks to punctual loadings. Based on experimental observations, a truncated pyramid shape has been proposed to describe the geometry of the collapsed soil zone (Fig. 13). The 2D design method is applied to the geosynthetic strip, 0.15 cm in width, sited in the axis of the cavity that is assumed to be submitted to the maximum loading (self-weight of the soil and overloading). We assumed that the weight of the collapsed soil (block A) and the surface overload (2P) after collapse are totally transmitted to the RG (i.e., a total load per meter of width of kN m−1). The weight of the two parts B and C on the RG at the edges of the cavity is assumed negligible compared to the intensity of the stress induced in the central part of the cavity by the overload at failure (55 kg). The input parameter values, deduced from observations and experimental measurements, for the use of the Huckert model (2014) are summarized in Table 2. UA and UB are the average horizontal displacements of the geosynthetic at the left and right edges of the cavity due to geosynthetic slippage, respectively. As presented in Fig. 15, the analytical results give a reasonable approximation that can be used to design a GR in the case of a cohesive soil layer prone to subsidence.
Three laboratory experiments were carried out to compare the behaviour of reinforced soil layers located above cavities for both granular soils (Fontainebleau sand) and cohesive soils (Sand-Kaolin). For the granular soil: a progressive subsidence mechanism on the surface is obtained. To compare with the analytical solution of the literature, three shapes of load distributions on the RG were analysed: uniform, inverse triangular and parabolic. The inverse triangular shape stress distribution fits better with the experimental results. In this case, the vertical displacement of the RG is less important than in the case of a uniform stress distribution. Stress measurements showed a maximum load increase at the edges of the cavity which decreases progressively far away from the cavity.
For a cohesive soil, when a significant overload is applied on the surface, a sudden break occurs and the measured stress values at the base of the soil layer in the anchoring zones decrease substantially. The cohesive soil layer breaks up into several collapsed blocks which exert localized loading on the RG that deforms into a flattened geometry. The comparison of the experimental and analytical results shows that the analytical models can be reasonably used to predict the subsidence of reinforced soils.
All the data used are available in the paper, figure and tables.
All the authors contributed to the integral published work.
The authors declare that they have no conflict of interest.
This article is part of the special issue “TISOLS: the Tenth International Symposium On Land Subsidence – living with subsidence”. It is a result of the Tenth International Symposium on Land Subsidence, Delft, the Netherlands, 17–21 May 2021.
This research has been supported by the ADEME (grant no. 1682C0372).
Briançon, L. and Villard, P.: Design of geosynthetic-reinforced platforms spanning localized sinkholes, Science Direct geotextiles and geomembranes, 26, 416–428, 2008.
Chevalier, B., Combe, G., and Villard, P.: Experimental and Discrete Element Modelling studies of the trapdoor problem: influence of the macro-mechanical frictional parameters, Acta Geotech., 7, 15–39, 2012.
Hassoun, M., Villard, P., Al Heib, M., and Emeriault, F.: Soil reinforcement with geosynthetic for localized subsidence problems: Experimental and analytical analysis, Int. J. Geomechanics ASCE, Vol. 18, no. 10, October 2018.
Huckert, A.: Approches expérimentales et numérique du dimensionnement de renforcements géosynthétique sur cavités et inclusions rigides, PhD thesis UJF, Grenoble, Mai, 2014.