the Creative Commons Attribution 4.0 License.
the Creative Commons Attribution 4.0 License.
 | 22 Apr 2020
Land subsidence characteristics and disaster prevention in the Tongzhou area, Beijing
Luo Yong
Zhao Long
Tian Fang
Lei Kunchao
Sun Aihua
Accurately assessing the impact of groundwater exploitation on land subsidence can provide scientific support for decision-makers. This article establishes a groundwater–subsidence model in a typical area using the land subsidence characteristics of Tongzhou, China, and subsequently classifies a land subsidence early warning zone based on the land subsidence rate. Results show that land subsidence occurred throughout the whole Tongzhou District. The land subsidence that developed to the west of Liuzhuang, Tongzhou city and Taihu was the most serious The maximum annual subsidence rate reached 120 mm a−1 under the current groundwater extraction conditions, and the early warning level for land subsidence reached its highest level. If the pumping of groundwater was reduced by 50 % in the second and the fourth aquifers and by 60 % in the third aquifer, the land subsidence early warning level would be largely reduced and would meet the requirements for land subsidence control.
- Article
(98 KB) - Full-text XML
- BibTeX
- EndNote


Land subsidence, which is a slowly developing geological disaster, has become a global geological problem characterized by a long duration, slow generation, a wide influence range, a complex mechanism, and great difficulty with respect to prevention and control (Martinez-Noguez and Hinkelmann, 2015) There are currently more than 60 countries and regions in the world suffering from land subsidence (Yuan et al., 2012). UNESCO, IAHS and other groups have carried out a series of international research projects on land subsidence with research topics including monitoring land subsidence, the mechanism behind land subsidence and its prevention. In Beijing, subsidence mainly develops in Chaoyang, Haidian, Shunyi, Tongzhou, Changping and Daxing. The historical maximum land subsidence rate has reached 159.6 mm a−1, and the land subsidence rate is currently still rapidly developing (Zhao et al., 2018a).
The effect of land subsidence on urban planning, development and economic construction has become more prominent. Land subsidence has induced ground fissures in complex geological environments, including Shunyi and Changping, which have subsequently caused damage to infrastructure and reduced the value of land resources (Zhao et al., 2018b). Land subsidence reduces the ground elevation, causing the lifting, tilting and cracking of deep-water well pipes. It has also threatened the operation of rail transit (Liu et al., 2016).
This paper aims to establish an early warning mechanism with respect to land subsidence for disaster prediction and to reduce and control the multiple disasters induced by this phenomenon. This work utilized Tongzhou as the study area. A regional soil–water coupling model based on a three-dimensional groundwater model and a one-dimensional vertical soil deformation model was established. Based on the simulation outcomes from this coupled model, the warning level for land subsidence and possible prevention and control measures were then provided. This study will supply scientific support to ensure the safety of major infrastructure projects, buildings and urban operations.
The study area is located in the Tongzhou and Chaoyang districts, which encompass a total area of about 300 km2. Land subsidence in this area is serious.
2.1 Aquifer structure
The sediments of the Quaternary strata in Tongzhou are formed from the Yongding River alluvial fan and the Chaobai River alluvial fan. The Quaternary strata is less than 300 m thick in the Maji Bridge, Taihu and Yongshun regions, and the thickness increases gradually to the east and southeast, reaching more than 500 m. The Quaternary strain shows gray, gray black and yellow colors. The lithology is clay, clay silt, sandy silt, fine sand, medium coarse sand or gravel. The alternating distribution of sand and clay layers in the strata form the multi-structure.
The study area encompasses the Yongding River, Chaobai River and Wenyu River alluvial plain. Within a depth of 30 m below the ground surface, the soil type sequence comprises an artificial soil layer, a Quaternary new sedimentary layer and a general Quaternary alluvial deposit. There are also two thick sandy soil layers; the sandy soil content increases from west to east, and the depth of the sandy soil layers became shallower.
There is an aquitard at a depth of about 100 m based on an analysis of borehole data. The Quaternary stratum above 100 m is defined as shallow aquifer, whereas that below 100 m is defined as confined aquifer. The lithology is composed of alternative sand and clay, and hydraulic connections exist between the two abovementioned aquifers.
The shallow aquifer can be divided into a phreatic aquifer and a shallow confined aquifer; the first aquifer system has a bottom depth of about 40–50 m, and the second aquifer system has a bottom depth of approximately 80–100 m. The aquifer is mainly composed of fine sand, followed by medium sand and coarse sand, and gravel in local areas. The aquifer generally has five to eight layers with a cumulative thickness ranging from 30 to 50 m. The aquifer recharge conditions are good in the central and northern parts of Tongzhou.
2.2 Subsidence characteristics
2.2.1 Characteristics of horizontal subsidence
The subsidence boundary for Tongzhou has gradually merged with the boundary of subsidence in the Chaoyang District, including the Jinzhan and Heizhuanhu regions (Luo, 2019). Currently, the land subsidence in Tongzhou is still rapidly developing, and the subsidence center is bordered by the downtown area of Tongzhou, Zhangjiawan, Taihu and Ciqu. The maximum cumulative subsidence and subsidence rate in the subsidence center until 2016 was about 1700 mm and 110 mm a−1, respectively. Cumulative subsidence of approximately 500 mm has been observed in the areas west of Songzhuang in Tongzhou and west of Taihu, whereas a higher cumulative subsidence of 1000 mm has been found to the west of Liuzhuang, Tongzhou and Taihu. In Tongzhou and at the junction of Taihu and the Chaoyang, a cumulative subsidence as high as 1500 mm has been recorded.
2.2.2 Characteristics of vertical subsidence
The Zhangjiawan extensometer station began operations on 26 June 2008, and it recorded a cumulative subsidence of 139.128 mm from June 2008 to 26 December 2015. The time series subsidence curve at each monitoring layer showed an increasing trend (Luo, 2019). Land subsidence in the deep stratum has been higher than that in the shallow stratum since 2008.
The contribution of different layers to the cumulative land subsidence showed that the stratum at a depth below 126 m accounted for about 93.4 % of the land subsidence in the Zhangjiawang region. The deformation of the layers at depths greater than 257 m accounted for 54.01 % of the total compression value. The deformation of the strata at a depth between 126 and 193 m and between 193 and 257 m accounted for 27.70 % and 11.69 % of the total compression value, respectively, and the strata at depths of 49–90 m, 30–49 m and 2–30 m accounted for 1.99 %, 6.30 % and 3.18 %, respectively. Notably, the stratum at a depth of 90–126 m was uplifted (Luo, 2019).
3.1 Conceptual model
The Quaternary strata in the study area can be divided into the Holocene first aquifer, the Upper Pleistocene second aquifer, the Middle Pleistocene third aquifer and the Lower Pleistocene fourth aquifer. This study combined the aquifer and aquitard of Quaternary strata and regarded the clay layer lens and aquifer as a whole groundwater system. The direction of groundwater flow is mainly horizontal. The groundwater flow pattern is set as a three-dimensional unstable flow.
The model boundary was set as the flow rate condition on the base of the historical groundwater flow field. The source/sink terms included river channel infiltration, field irrigation infiltration, atmospheric precipitation, evaporation and pumping. The depth of the model bottom was about 350 m, which contained all of the groundwater exploitation layers.
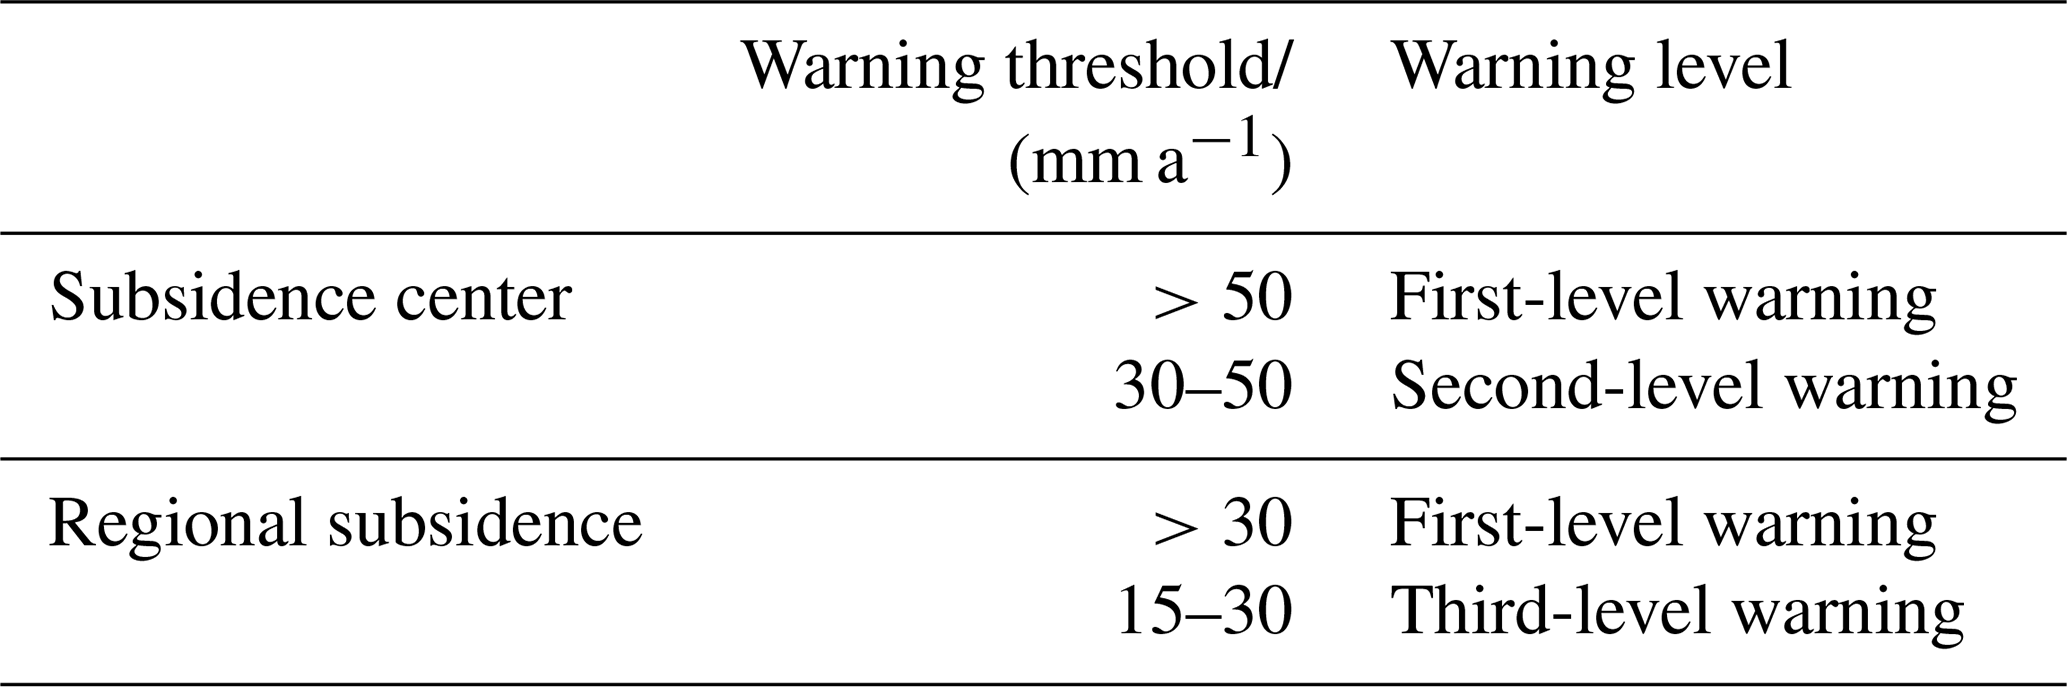
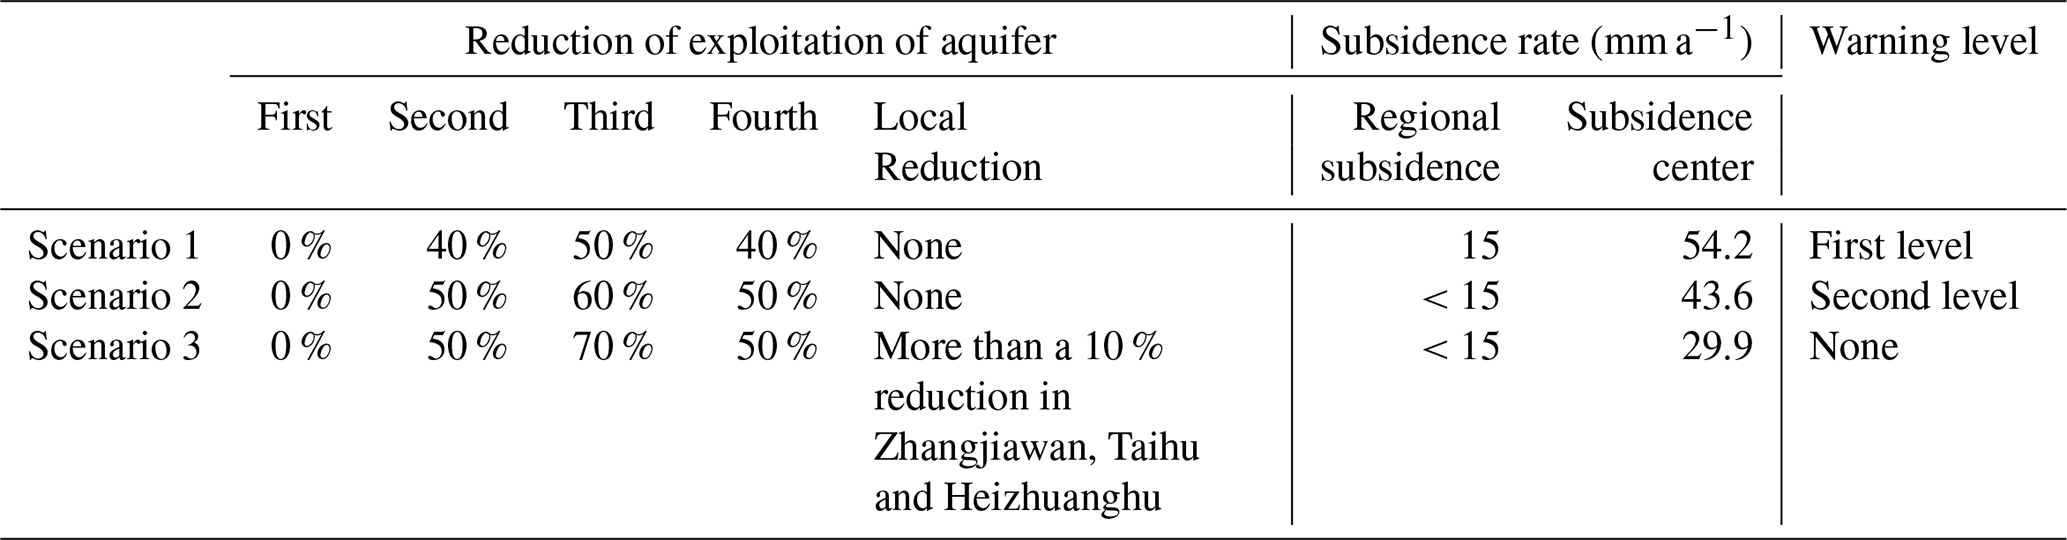
Table 2The different reduction scenarios of groundwater exploitation.
3.2 Groundwater flow numerical model
The classic three-dimensional saturated flow equation is given in Eq. (1).
where Ω is the simulation domain; h is the hydraulic head (m); Kcp, Kv and Kn represent the hydraulic conductivity tensor with the principal components (m d−1); S is the specific storage; μ is the specific yield; σ is the resistance coefficient of the river bed, , where L and Ks are the thickness and vertical permeability coefficient (m d−1) of the river bed, respectively; ε is the source/sink term (d−1); p is evaporation and precipitation (d−1); h0 is the initial water level (m); Γ0 is the upper boundary of the domain; Γ1 is the Dirichlet boundary; Γ2 is the flow rate boundary; Γ3 is the mixed boundary condition; Γ4 is the bottom boundary of the domain; is the normal direction of the boundary; and is the per unit area of the flow rate (m d−1), where inflow is positive and outflow is negative.
3.3 Soil displacement model
This paper assumes that the displacement occurred in the vertical direction, considering the relative small deformation in the horizontal direction compared with that in the vertical direction. The change in the groundwater level enabled the calculation of the amount of the soil deformation as follows:
where Δh is the change in the groundwater level; Ssk is the skeletal specific storage of the aquitard (Sske is the skeletal elastic storage, and Sskv is the skeletal inelastic storage); Δb is the change in the thickness of the aquitard; Cc is the compression index; Cr is the expansion index; γw is the bulk density of water; σ′ is the effective stress; and e0 is the initial porosity ratio.
Once the deformation of each aquifer was calculated, the cumulative value of displacement could be summarized. The flow model and the soil deformation model can be coupled via the flow term:
where m denotes the mth time step, i denotes the ith grid, q is the flow of the unit per unit time, Δtm is the length of the time step m, Hm−1 is the pre-consolidation water level at the end of the time step m−1, h is the calculated water level and is determined by
3.4 Model calibration
The model was vertically divided into four layers and horizontally divided into 2500 grids (50 in the x direction and 50 in the y direction) with a grid size of 400 m×400 m. The simulation time was from January 2005 to December 2015. There were a total of 131 stress periods with an interval of 1 month. Each period included several time steps, and the error of each iteration was strictly controlled.
The trial–correction method was adopted to identify the hydrogeological parameters, boundary values and other equilibrium terms by fitting the historical groundwater level with the long-term monitored data from the same period. During the process, the simulated volumes of recharge and discharge were also compared with the monitored data. The monitored flow field and simulated flow field in December 2015 were compared for validation. The simulated flow field generally reflects the groundwater level distribution. The groundwater level of the long-term monitored data was fitted with the simulated outcomes, which reflected that the two curves were approximately consistent.
The early warning areas and warning levels with respect to land subsidence were differentiated (the latter into three levels) by referring to the “Beijing Land Subsidence Prevention and Control Plan (2013–2020)”, the “Beijing–Tianjin–Hebei Land Subsidence Integrated Prevention and Control Master Plan” and the “Surface Subsidence Investigation and Monitoring Code”. Land subsidence was effectively monitored by InSAR, leveling and GPS. The relations between the subsidence rate and the early warning threshold were determined based on these real-time monitoring data. If the subsidence rate was larger than the threshold, the warning level was given.
In this study, we modeled the subsidence rate in 2020 using the unchanged groundwater exploitation conditions from 2015. The groundwater–subsidence coupling model was utilized with identified and corrected parameters. The results show that the original land subsidence center rapidly developed, and the maximum annual subsidence rate reached 120 mm a−1.
Three kinds of scenarios regarding reductions in the groundwater exploitation were simulated in 2016 to access which scenarios would be effective to reduce the land subsidence from 2016 to 2020 (Table 2). Based on the model predictions, the subsidence rate in scenario 1 is greater than 15 mm a−1, and that in scenario 2 is generally less than 15 mm a−1. However, the subsidence rate for Zhangjiawan, Taihu and Heizhuanghu (the subsidence center) is still greater than 30 mm a−1. Based on the results of scenario 3, the second and fourth aquifer exploitation was set to be reduced by 50 %, and the third aquifer was reduced by 70 % in Zhangjiawan, Taihu, and Heizhuanghu. The modeling results show that the maximum annual subsidence rate is about 30 mm a−1, and the regional subsidence rate is less than 15 mm a−1, which is lower than the warning threshold in 2020.
The three main results of this study are as follows:
-
The Tongzhou district has developed serious land subsidence. The subsidence of the strata at depths below 126 m has dominantly contributed to the total subsidence. Land subsidence in the area comprising Liuzhuang, Tongzhou and downtown Taihu bordering the Chaoyang District is the most serious. The shallow strata show little subsidence, and the stratum from a depth of 90 to 126 m was even uplifted.
-
We established the groundwater flow coupled to a soil deformation model, which can be used to simulate the dynamic features of the groundwater level and land subsidence. Based on the model, land subsidence early warning zones and level were given. The model predicted that the regional and central subsidence rates would reach the highest warning level by 2020 under the current groundwater exploitation conditions.
-
Using alternative projects, including rainwater, reclaimed water, south–north water transfer and homemade well replacement, the decrease in the groundwater level could be restricted and land subsidence would be relieved. The land subsidence warning level would be below the minimum threshold warning level if the pumping volume from the second and fourth aquifers was reduced by 60 % and the pumping volume from the third aquifer was reduced by 70 % the Zhangjiawan, Taihu and Heizhuanghu region, and the pumping volume from the second and fourth aquifers was reduced by 50 % and pumping from the the third aquifer was reduced by 60 % in other regions with respect to the current groundwater exploitation conditions.
The data use in this paper are not publicly accessible. The groundwater and land subsidence data relating to Beijing are part of a confidential document.
LY designed and constructed the model and analyzed the results; ZhaL, ZhuL, and TF debugged the model; and LKo and SA collected and organized the data.
The authors declare that they have no conflict of interest.
This article is part of the special issue “TISOLS: the Tenth International Symposium On Land Subsidence – living with subsidence”. It is a result of the Tenth International Symposium on Land Subsidence, Delft, the Netherlands, 17–21 May 2021.
The authors wish to acknowledge their respective institutes and their colleagues for their efforts with respect to finishing this paper. The authors are also grateful to the editor and the referees for their helpful suggestions.
This research has been supported by the Beijing Council of Science and Technology (grant no. Z191100001419007).
Liu, H. H., Zhang, Y . Q., Wang, R., Gong, H. L., Gu, Z., Kan, J. L., Luo, Y., and Jia, S. M.: Monitoring and analysis of land subsidence along the Beijing-Tianjin high-speed railway, Chinese J. Geophys., 59, 24240–2432, 2016.
Luo, Y.: Land subsidence characteristics and groundwater exploitation optimization in tongzhou Beijing, University of Chinese Academy of Sciences, 4, 31–62, 2019.
Martinez-Noguez, I. and Hinkelmann, R.: Land subsidence caused by a single water extraction well and rapid water infiltration, Proc. IAHS, 372, 33–38, https://doi.org/10.5194/piahs-372-33-2015, 2015.
Yuan, L. M.: Global land subsidence scanning, Earth, 12, 156–159, 2012.
Zhao, L., Wu, Z. K., Li, Y. M., Luo, Y., Sha, T., Liu, H., Tian, M. Z. and Kong, X.R.: Land subsidence distribution and typical disaster types in Beijing, Urban Geol., 13, 51–56, 2018a.
Zhao, L., Li, Y. M., Chui, W. J., Luo, Y.,Zhang, Y. Q., Tian, F., Lei, K. C., Qiao, L., Sha, T., Tian, M. Z., Wang, X. H., Kong, X. R., Liu, H., and Qi, M. H.: disaster characteristics and influence factors for ground fissures at Songzhuang village in Beijing, J. Eng. Geol., 26, 1600–1610, 2018b.
- Abstract
- Introduction
- Characteristics of aquifer structure and land subsidence
- Groundwater–subsidence numerical model
- Early warning and prevention of land subsidence
- Results
- Data availability
- Author contributions
- Competing interests
- Special issue statement
- Acknowledgements
- Financial support
- References