the Creative Commons Attribution 4.0 License.
the Creative Commons Attribution 4.0 License.
 | 22 Apr 2020
Vulnerability of Venice's coastland to relative sea-level rise
Cristina Da Lio
Sandra Donnici
Tazio Strozzi
Pietro Teatini
Relative sea-level rise (RSLR), i.e. sea-level rise due to climate changes combined with land subsidence, is one of the processes that is most severely threatening the coastal systems around the world. The Venice coastland forms the major low-lying area in Italy and encompasses a variety of environments, such as farmlands, estuaries, deltas, lagoons and urbanized areas. Valuable ecosystems, historical heritages and economic activities are located in this area. Since most of the territory lies at a ground elevation below or slightly above the mean sea-level, also a few mm yr−1 of land subsidence can seriously impacts on the Venice coastal system. In this study, we present an analysis of the vulnerability to RSLR considering an uneven land subsidence distribution, with an application on the Venice coastland. The analysis is delineated at the regional scale by an index-based model and a proper coupling of various thematic layers, such as high spatial resolution land subsidence data retrieved by satellite SAR interferometry, ongoing and projected sea-level rise trends, and morpho-physiographic setting of the coastland.
- Article
(18762 KB) - Full-text XML
- BibTeX
- EndNote


Sea-level rise due to climate changes (SLR) combined with land subsidence, namely relative sea-level rise (RSLR), is one of the processes that is threatening most severely the coastal systems around the world. Flooding, saltwater contamination of farmlands and aquifers, coastal erosion, loss of tidal morphologies along with severe damages to infrastructures are among the major effects of RSLR.
Although at different rates, the ocean levels increased over the last decades up to a few mm yr−1 and are expected to rise even more quickly by the end of the century (e.g., IPCC, 2014). Despite this general rise, land subsidence in many coastlands worldwide has exceeded the SLR up to a factor of ten (Erkens et al., 2015).
At regional scales, SLR can be considered spatially homogeneous whereas ground dynamics is often characterized by a considerable variability. During the last decade, the growing use of satellite SAR interferometry over large areas reveled that land subsidence in low-lying coastlands often depicts uneven distribution patterns, primarily controlled by shallow sediment compaction, especially the Holocene deposits (Tosi et al., 2010; Teatini et al., 2011; Jankowski et al., 2017), and the hydro-morphological setting. These are key driving mechanisms in the susceptibility of the low-lying coastal plains to RSLR
Vulnerability analysis is a powerful method for studying the interaction of the various environmental features that determine the exposure of coastlands to RSLR (e.g., Gornitz, 1991). However, previous investigations neglected or poorly considered the variability of the coastal subsidence, generally assuming a quite homogeneous sinking trend also over large areas, or at least with a regional pattern.
Here we present a step forward in the analysis of the vulnerability to RSLR of the Venice coastal system (Fig. 1), considering the actual pattern of the coastal subsidence (e.g., Teatini et al., 2011; Strozzi et al., 2013; Tosi et al., 2016).
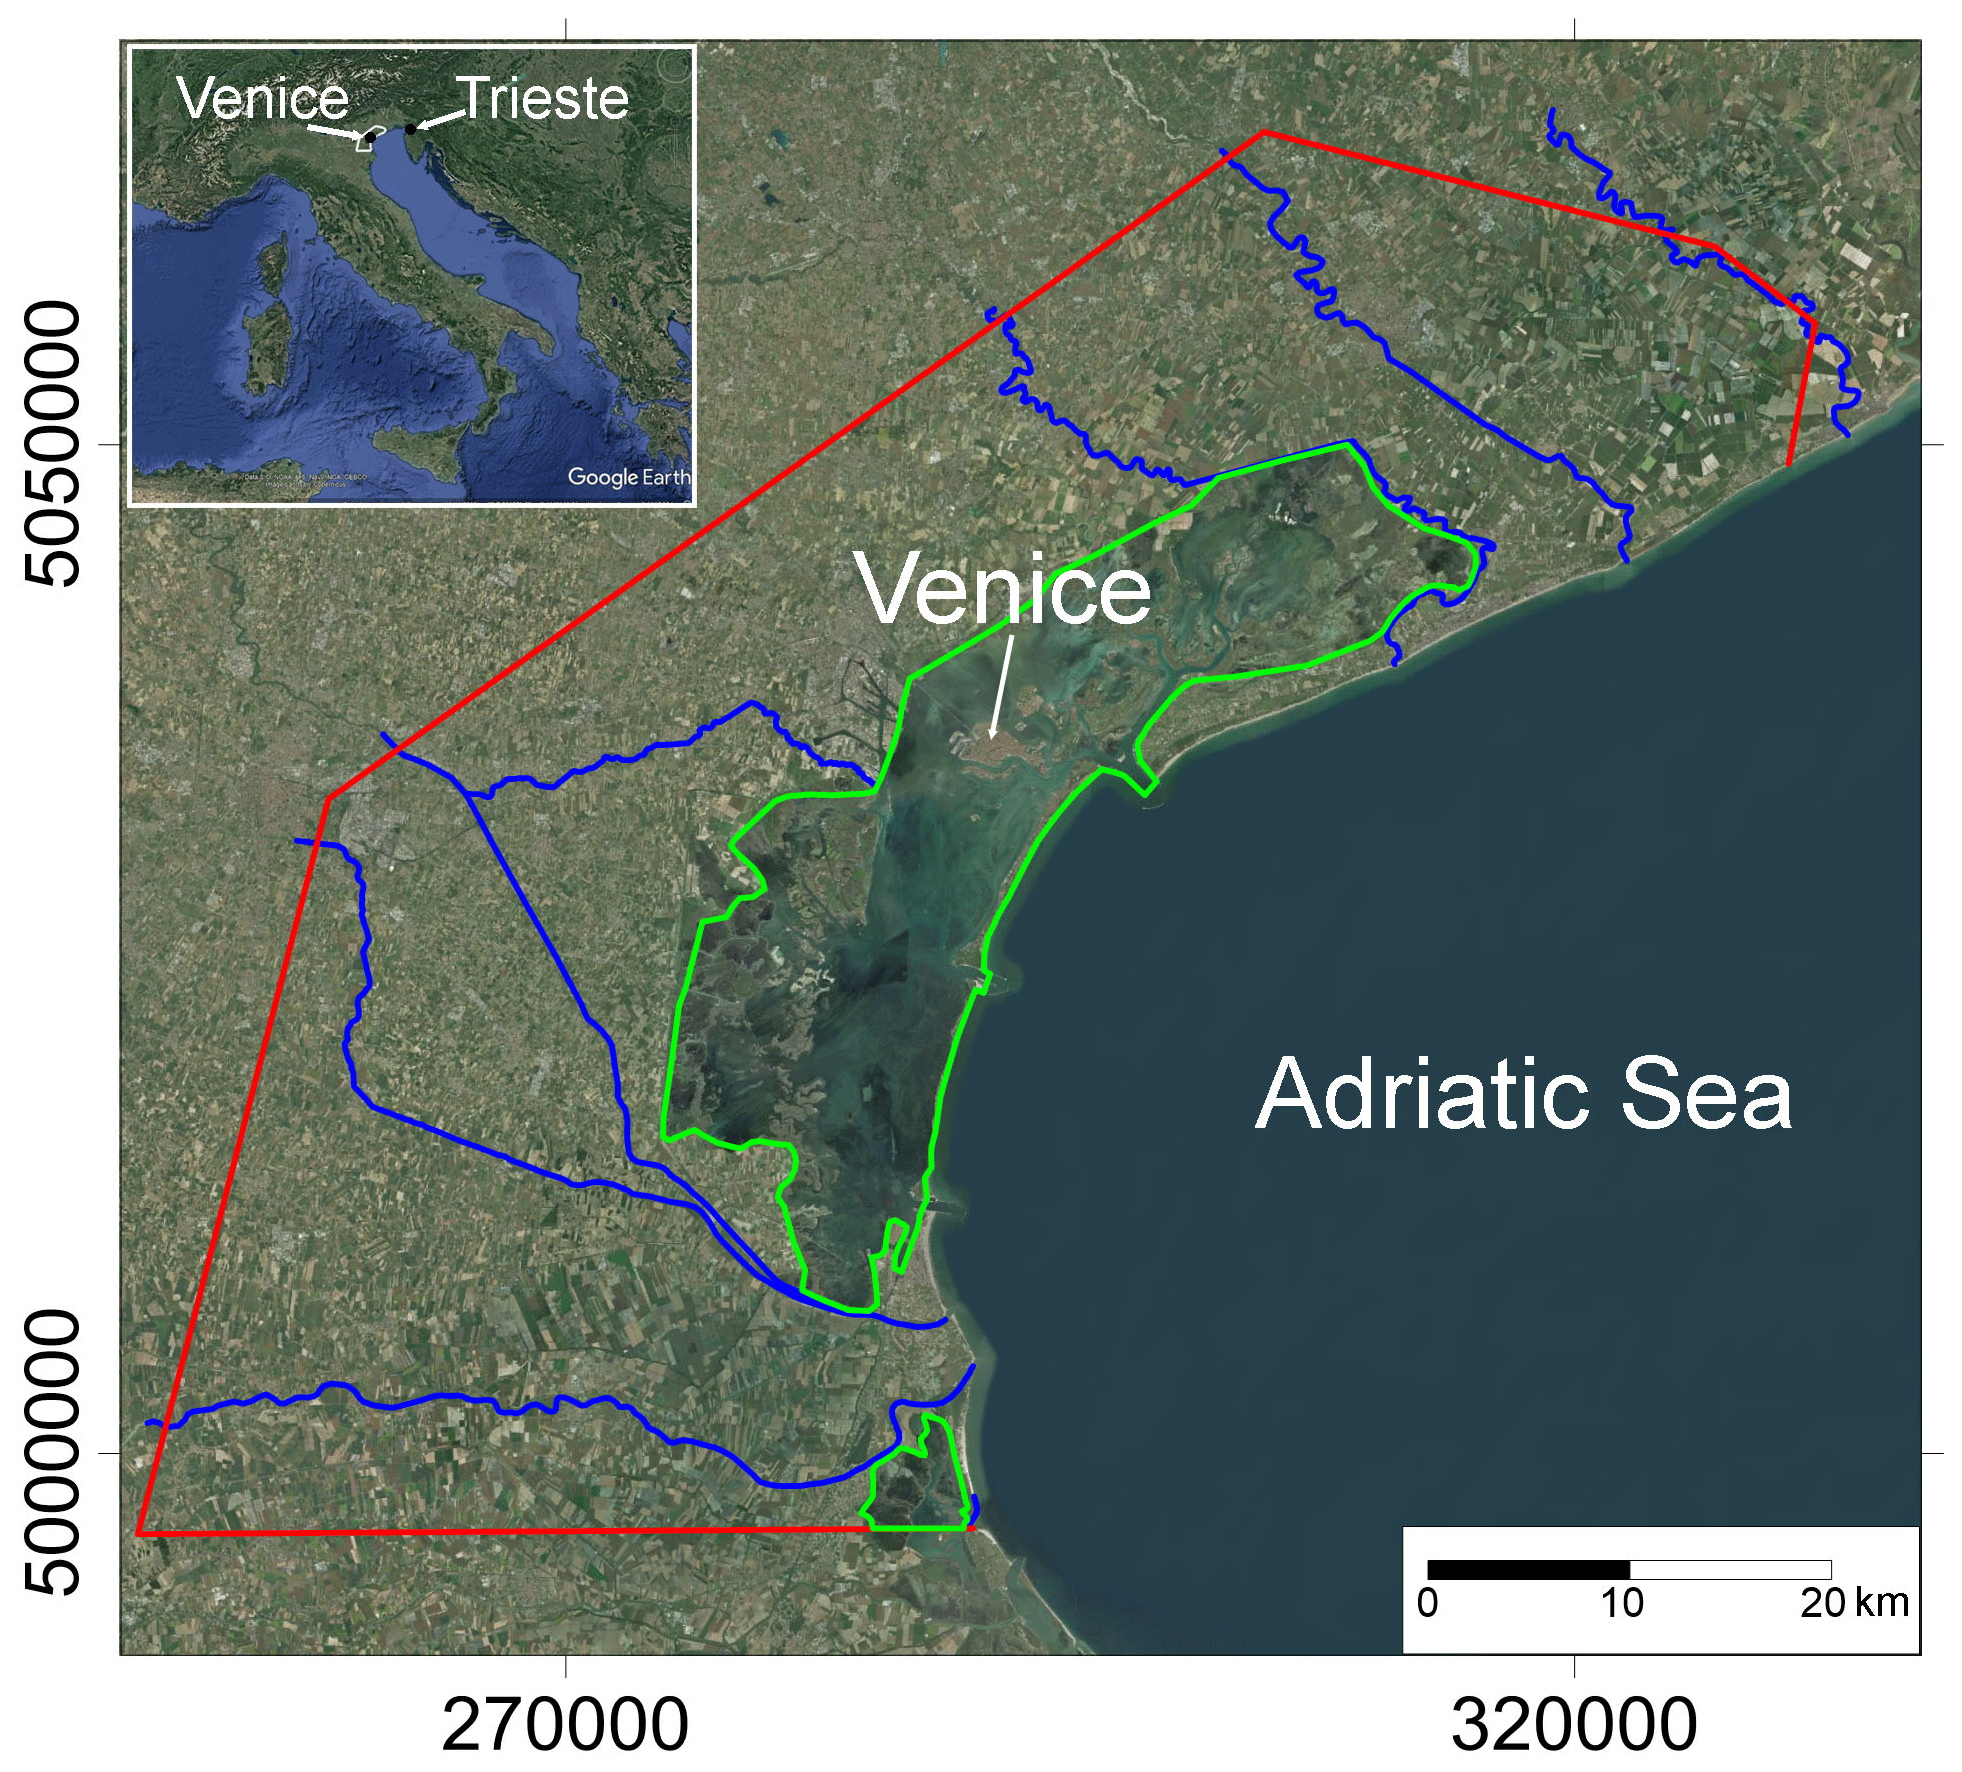
Figure 1Satellite image of the Venice coastland facing the northern Adriatic Sea, Italy. Red line: boundary of the study area in the mainland; Blue lines: major rivers; Green polygons: lagoon boundaries. Base map source: Esri, DigitalGlobe, GeoEye, Earthstar Geographics, CNES/Airbus DS, USDA, USGS, Aerogrid, IGN, and the GIS User Community.
The analysis is conducted at the regional scale by combining high spatial resolution ground movement data obtained through multi-temporal SAR interferometry with information on the hydro-morphological setting of the coastal system and the present and projected sea-level rise trends.
The coastal vulnerability to RSLR was assessed by means of an index-based model that considers the following input dataset: high spatial resolution land subsidence; hydro-morphological setting, including the distance of emerged land from potential pathways for inundation due to RSLR, i.e. the coastline, watercourses, lagoons and wetlands; surface elevation of emerged and submerged sectors; present and projected sea-level rise.
2.1 Land subsidence dataset
Ground movements are derived from a stack of 194 Sentinel-1 images ( m spatial resolution) acquired between 30 March 2015 and 23 February 2019 processed with the Interferometric Point Target Analysis (IPTA) PSI chain (e.g., Wegmüller et al., 2004). Permanent GPS stations located within the study area allowed calibration and validation of the interferometric product. The line of sight (LOS) displacements detected by the satellite have been assumed as to the ground vertical movements to simplify the analysis. This assumption introduces an error in the range of 20 %–25 % for the ground movement velocities, which can be reasonably neglected considering the intervals of the thematic layer classification adopted for the vulnerability analysis to RSLR.
2.2 Hydro-morphological data
The hydro-morphological dataset includes the ground elevation of emerged and submerged areas and the physiographic setting of the major water bodies considered as the main potential flooding sources.
The ground elevations data of emerged areas refers to a 20 m pixel size Digital Elevation Model (DEM). The DEM was obtained by Wegmüller et al. (2009) using SAR cross-interferometry on four pairs of satellite images as part of the ERS2-ENVISAT tandem mission in winter 2007, 2008 and 2009, i.e. the season with the lowest presence of vegetation, and validated on the basis of GPS surveys (Gasparetto-Stori et al., 2012).
The bathymetric data are available from reclamation and regional authorities and refers to the main lagoon basins.
The potential flooding sources are the Adriatic Sea, lagoons, wetlands and the main rivers. The boundaries and paths of the water bodies were drawn manually using images from Google Earth.
2.3 Sea-level rise scenarios
Three SLR rates were adopted, i.e. the ongoing long-time series scenario, ongoing short-time series scenario and future scenario, referring to the time intervals 1875–2018, 1992–2018 and 2018–2050, respectively. The SLR rates for the ongoing long-time series scenario and ongoing short-time series scenario amount to 1.3 and 3.8 mm yr−1, respectively, and were computed from the data recorded by the tide gauge station of Trieste (Northern Adriatic Sea). Since this station is located in an area where land movements are known to be negligible, the records are representative of the sea level changes. Regarding the future scenario, this study adopts the worst-case projection of global mean sea-level rise provided by the IPCC's Fifth Assessment Report (AR5) (IPCC, 2014). Under the Representative Concentration Pathway RCP8.5 scenario, a sea-level rise of 0.74 m with a likely range of 0.52 to 0.98 m (Church et al., 2013) is projected by 2100. For the future scenario, a mean rate of 5 mm yr−1 by 2050 is consequently used.
2.4 Index-based model
The vulnerability to RSLR was assessed by the following steps: (a) Set-up of the thematic layers derived from the selected indices (i.e. land subsidence, water distance and DEM); (b) Classification of the thematic layers; (c) Assignment of a weigh to each index; (d) Aggregation of the thematic layers into a GIS environment; (e) Computation and classification of vulnerability to RSLR.
The thematic layers SUBS (land subsidence), DEM (integrated ground elevation and bathymetric dataset) and WD (water distance) were set up through the interpolation of the associated indices by the kriging technique. Specifically, a 200 m regular grid was chosen as it is a good compromise for mapping both high density data areas (e.g., urban areas) and sectors where SAR reflectors are diffused (e.g., farmlands and wetlands).
The three SLR rates were included in the SUBS layer for obtaining the RSUBS thematic layers corresponding to the different scenarios. SUBS rates were kept the same for the three scenarios, assuming that the groundwater regulation will prevent future increase in induced land sinking and the secondary consolidation rates of Holocene deposits will remain unchanged during such a relatively short time period (e.g., Teatini et al., 2011).
The DEM dataset consists in measurements carried out over various time spans with a common mid-range year around 2008. Because land subsidence is referred to the 2015–2019 period, the DEM dataset was updated by adding the contribution due to ground displacements and SLR for the time interval 2008–2019. The land subsidence trend is assumed to remain unchanged before 2015.
In addition, depending on the investigated scenario, the DEM layer was computed by two different approaches. For the ongoing scenarios, DEM represents the present coastland elevation estimated for the year 2019. For the future scenario, i.e. in 2050, the DEM is estimated as in Eq. (1):
where Δt is the interval period between 2019 and 2050.
The thematic layers were classified by converting their values to an “importance” scale using a rating from 0 to 4 (e.g., Gornitz, 1991). The classification depends on local conditions, with high ratings corresponding to high impact of RSLR. The upper and lower bounds of the classes for the thematic layers were defined by adapting the limit values to the frequency distribution of the gridded dataset. The WD index is assumed to remain unchanged by 2050, as it is reasonable to believe that mitigation measures (e.g. beach nourishment, embankment reinforcing) will keep the boundaries of the water bodies roughly at present.
Table 1Range of scores and weightings assigned to each classified thematic layer.
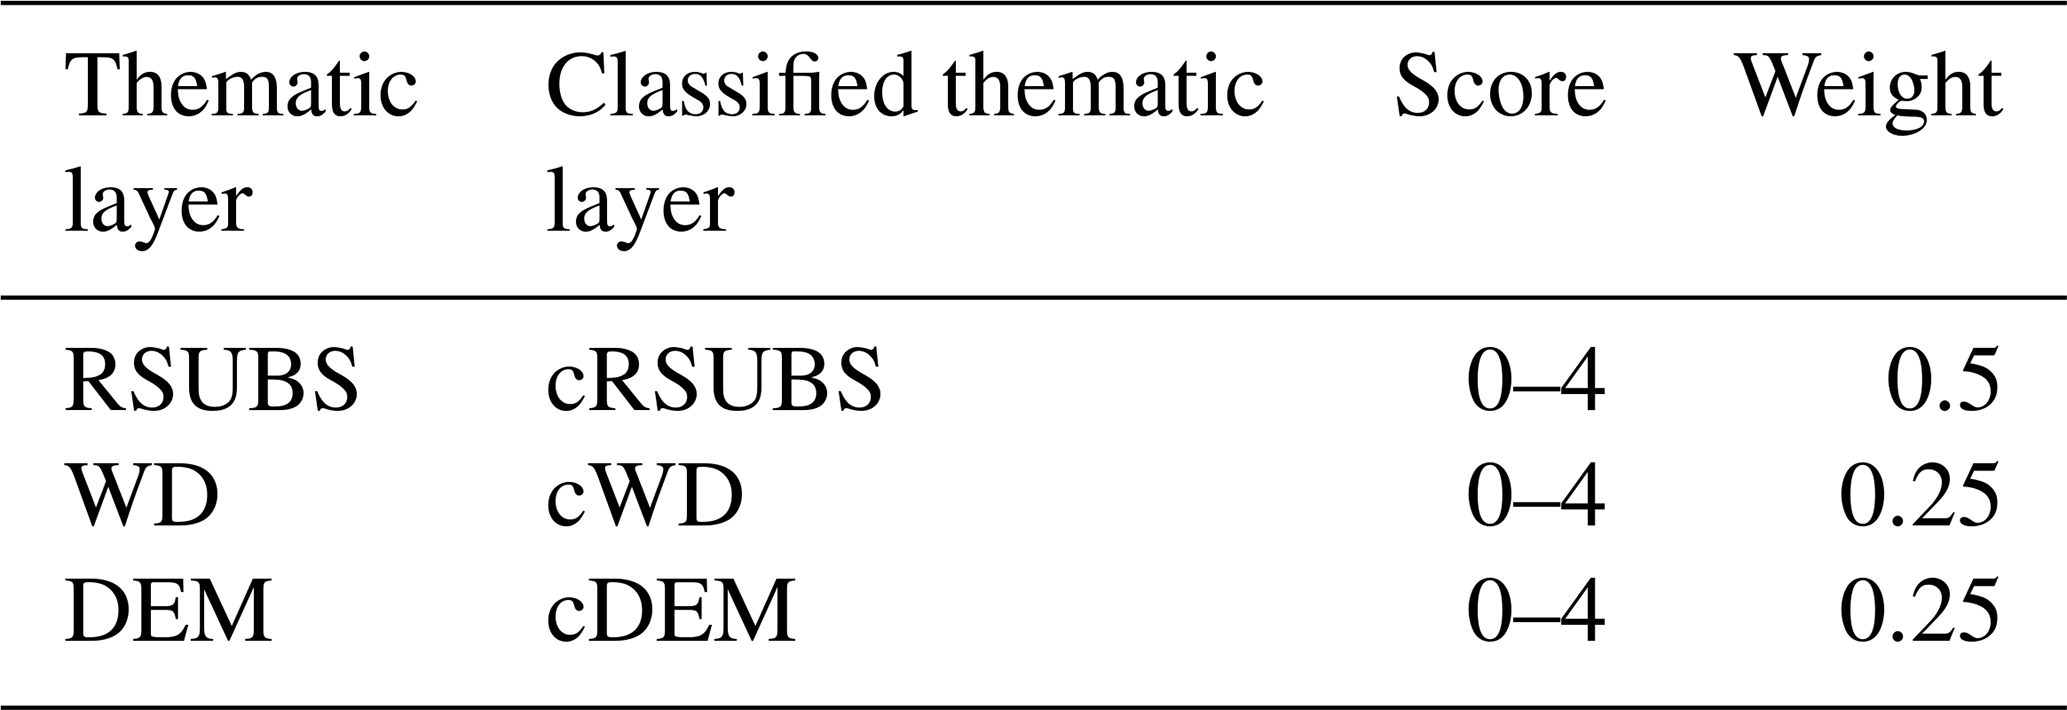
Finally, the Index of Coastal Vulnerability (CVI) to RSLR was computed with a weighted linear regression for both the ongoing and future scenarios as in Eq. (2):
where cRSUBS, cWD, cDEM are the rating for each cell i of the classified thematic layers and wSUBS,wWD, and wDEM are the assigned subjective weights as shown in Table 1. Note that the weight of RSUBS (wRSUBS)is double those associated to wW and wDEM, as high subsidence rates and projected SLR trends are the major driving forces affecting delta vulnerability.
Lastly, the CVI values obtained from Eq. (2) were reclassified into five classes (from negligible to extreme) by the Jenks optimization method (Jenks, 1967), which reduces variance within classes and maximizes variance between them.
The set-up of the SUBS, RSUBS, DEM and WD thematic layers was the first step of the data analysis. The maps developed on the 200 m regular grid are shown in Fig. 2.
The SUBS thematic layer clearly depicts the variability of the ground displacements although the SAR data are interpolated on the 200 m grid. In general, this pattern is primarily controlled by compaction of the Holocene deposits, which thickness increases from less than 1 m in the mainland to more than 20 m in the northern and southern coastal sectors (Tosi et al., 2010). The presence of buried geomorphological features, such as sandy paleo-channel and littoral ridge systems contributes in increasing the local variabilities patterns. To the author knowledge, induced land subsidence due to groundwater exploitation is limited to local sectors in the northern area.
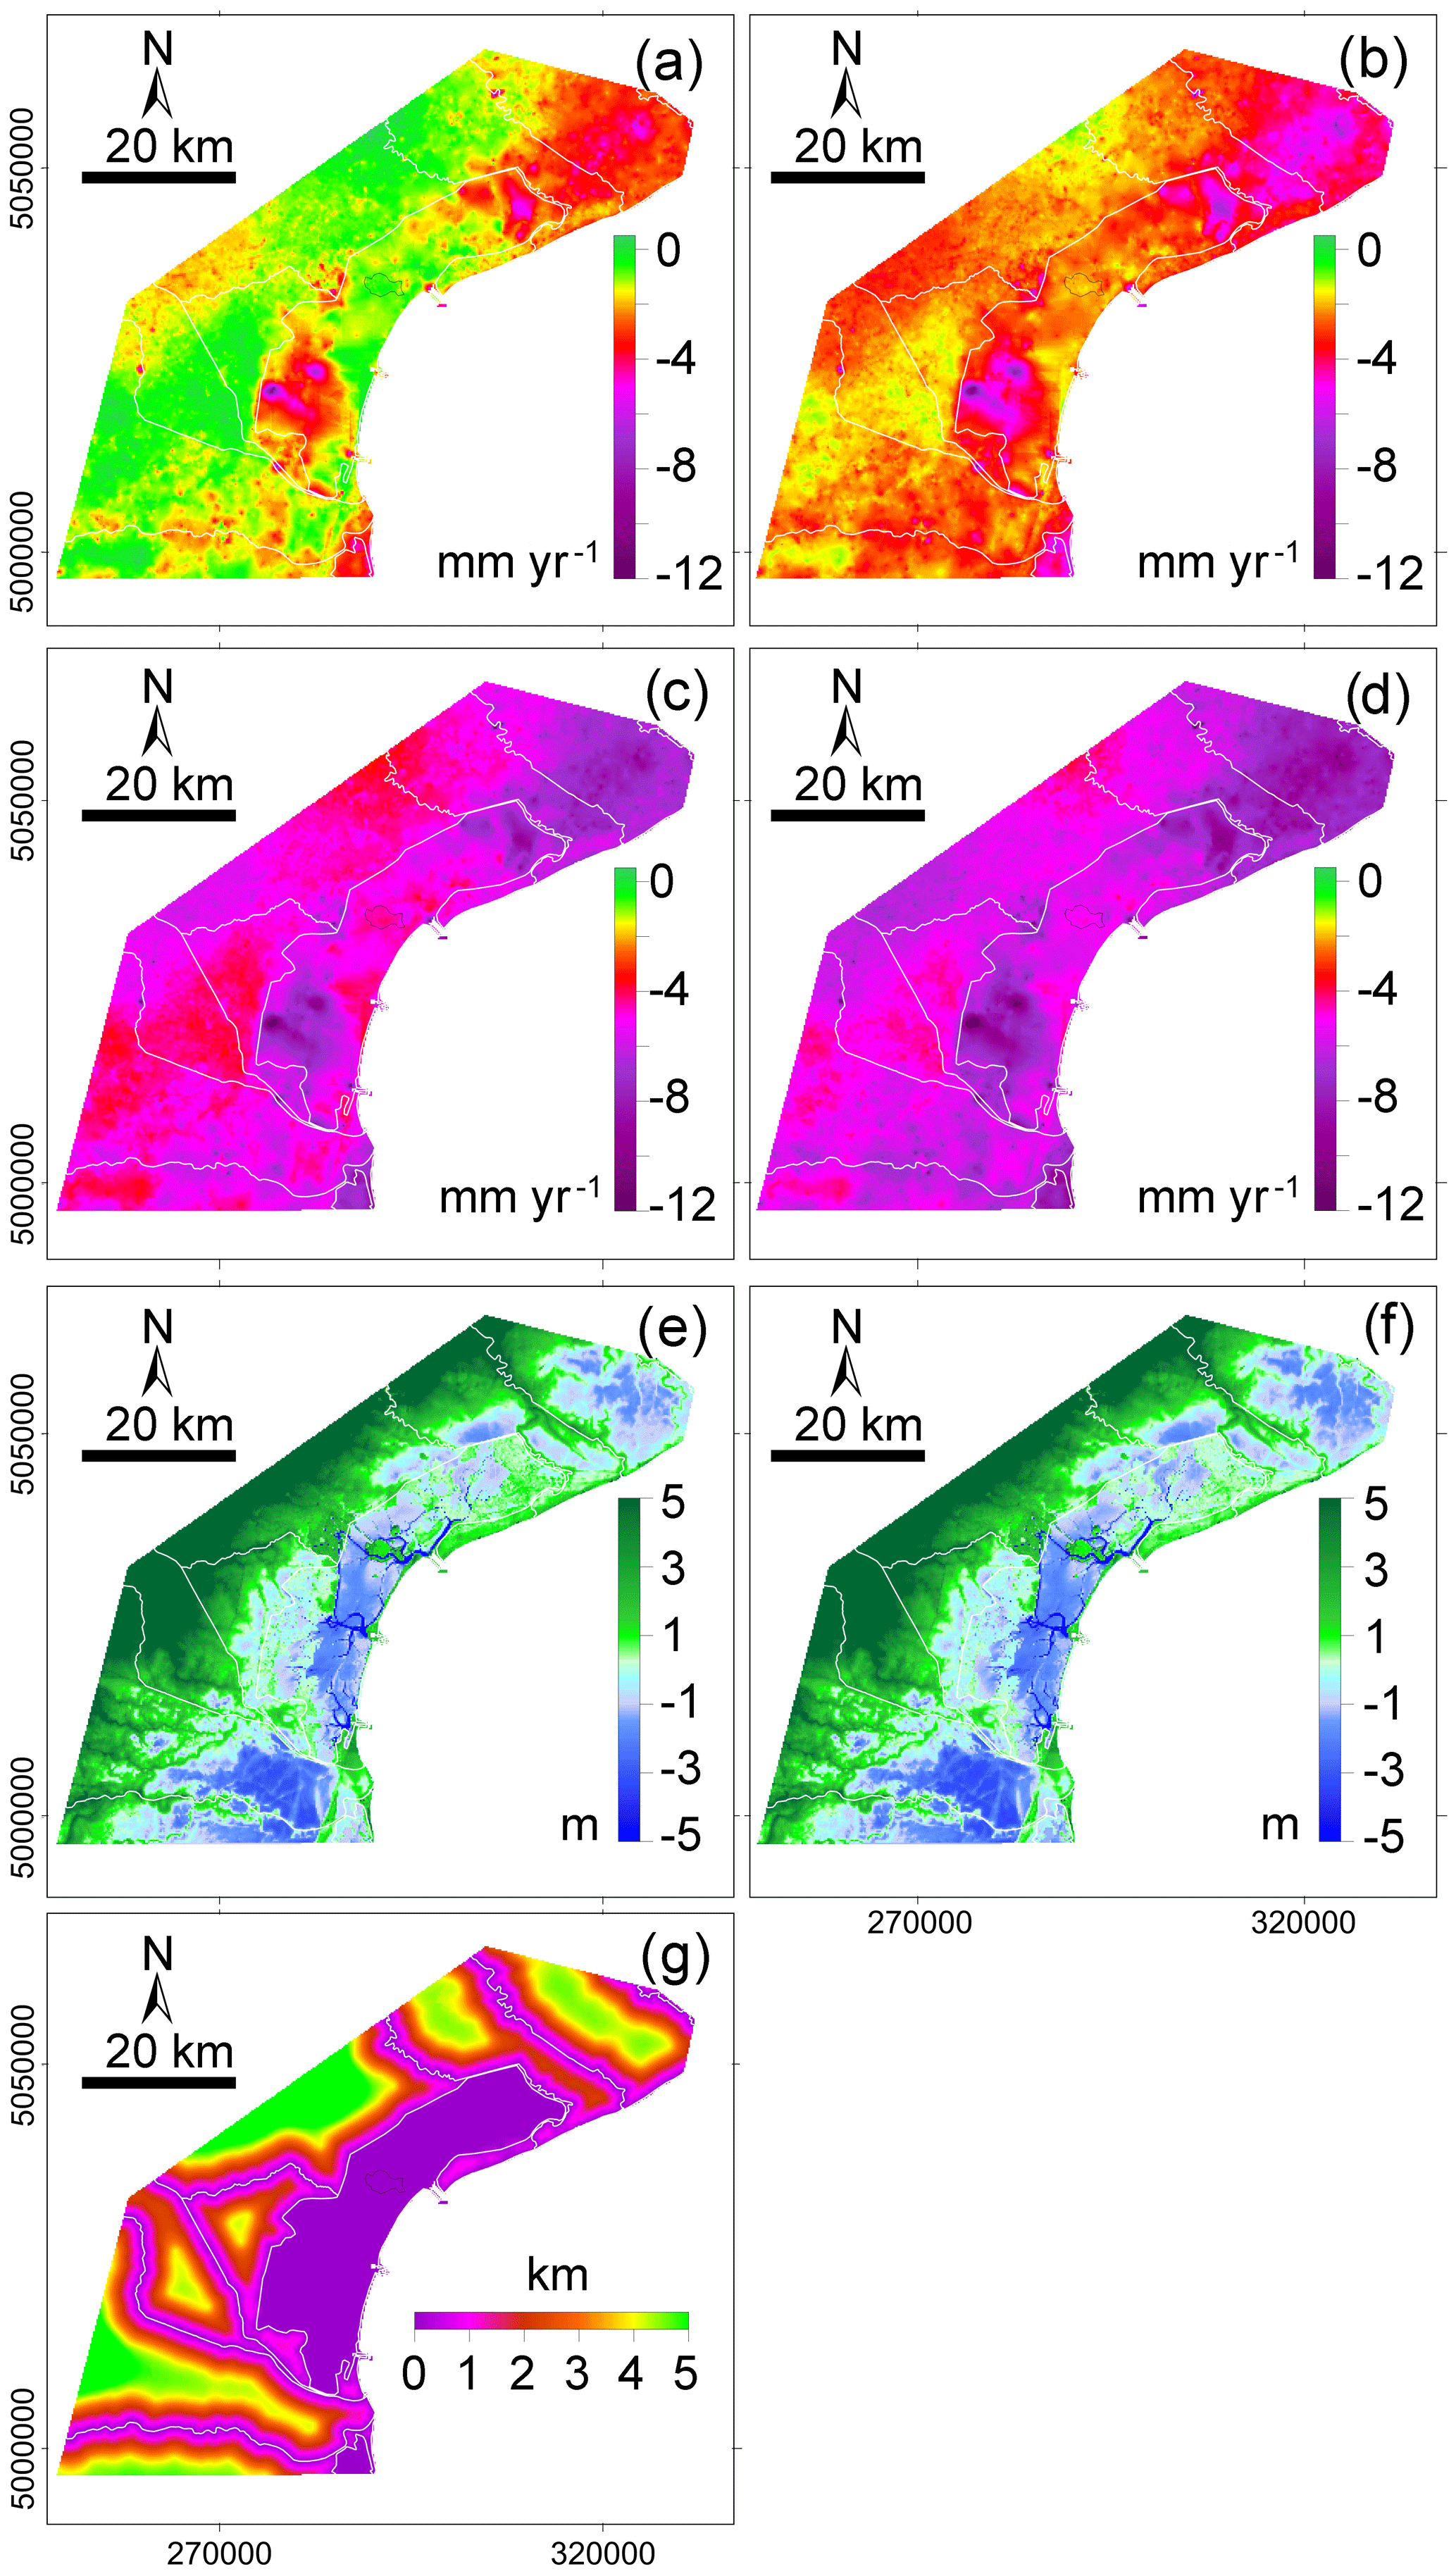
Figure 2Thematic layers: (a) SUBS, (b) RSUBS – ongoing long-time series scenario, (c) RSUBS – ongoing short-time series scenario, (d) RSUBS – future scenario, (e) DEM, (f) DEM – future scenario, (g) WD.
The thematic layer has been classified based on the statistical distribution of the RSUBS, WD, and DEM values (Table 2).
Table 2Thematic layer classification: upper and lower bounds of the classes and related scores.
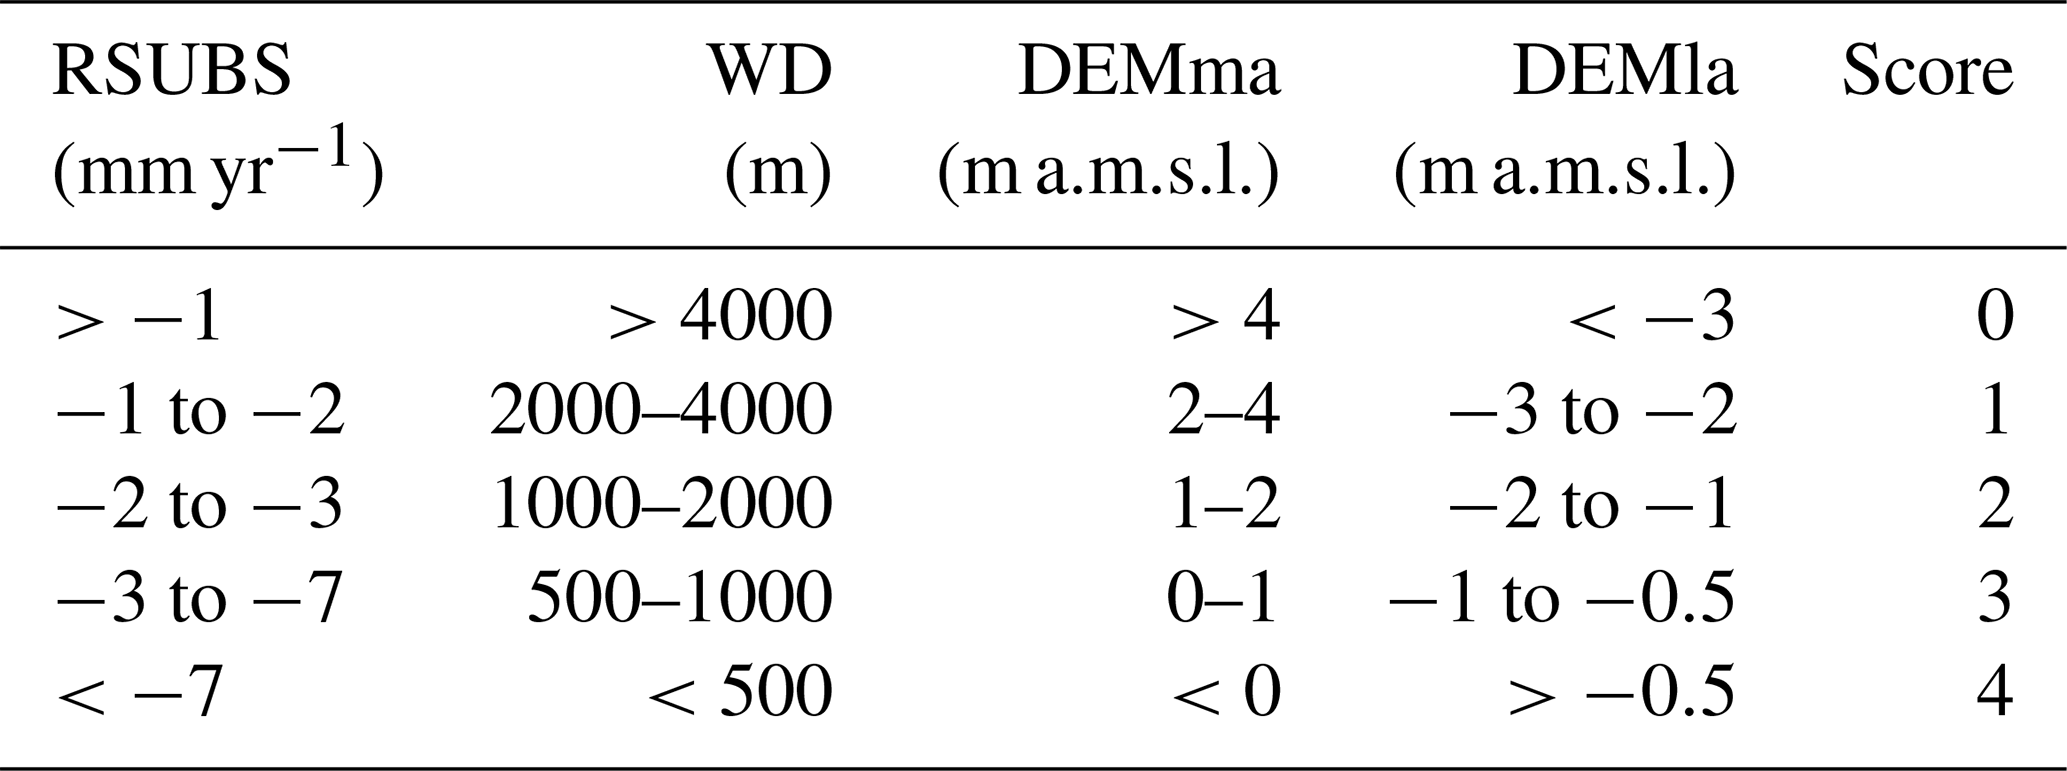
The values 0 and 4 mean a low and a high contribution to vulnerability, respectively. Considering the peculiarity of the Venice area, whose territory lies at an elevation below or slightly above the mean sea-level, also a few mm yr−1 of relative sea-level rise seriously damage the coastal system. Therefore, the class with null value has been limited to RSLR less than 1 mm yr−1. In addition, since RSLR differently affects the ecosystem of transitional environments, the DEM thematic layer has been classified separately for the mainland (littoral strips included) and lagoon areas (islands included), hereinafter referred as DEMma and DEMla, respectively. Specifically, in the lagoon areas, RSLR threats the morphologies with a surface elevation within the tidal range (e.g., salt marshes) and above sea level (e.g. islands and historical centers) more than the lagoon bottom deeper than −1 m a.m.s.l. (e.g., channels). Conversely, in the mainland, the most threaten sectors are those with the lowest elevation with respect to the sea level.
The adopted classification is the same for the three scenarios, since the threat-classes are preserved even if subsidence and SLR change.
The classified thematic layers, with scores from 0 to 4 (from low to high contribution to vulnerability), are shown in Fig. 3. The colour-coding highlights the rating in accordance with the classification shown in Table 2.
The Index of Coastal Vulnerability (CVI) to RSLR was computed with a weighted linear regression for both the ongoing and future scenarios (see Eq. 2) and the values reclassified into five classes, i.e. negligible, marginal, moderate, critical, and extreme.
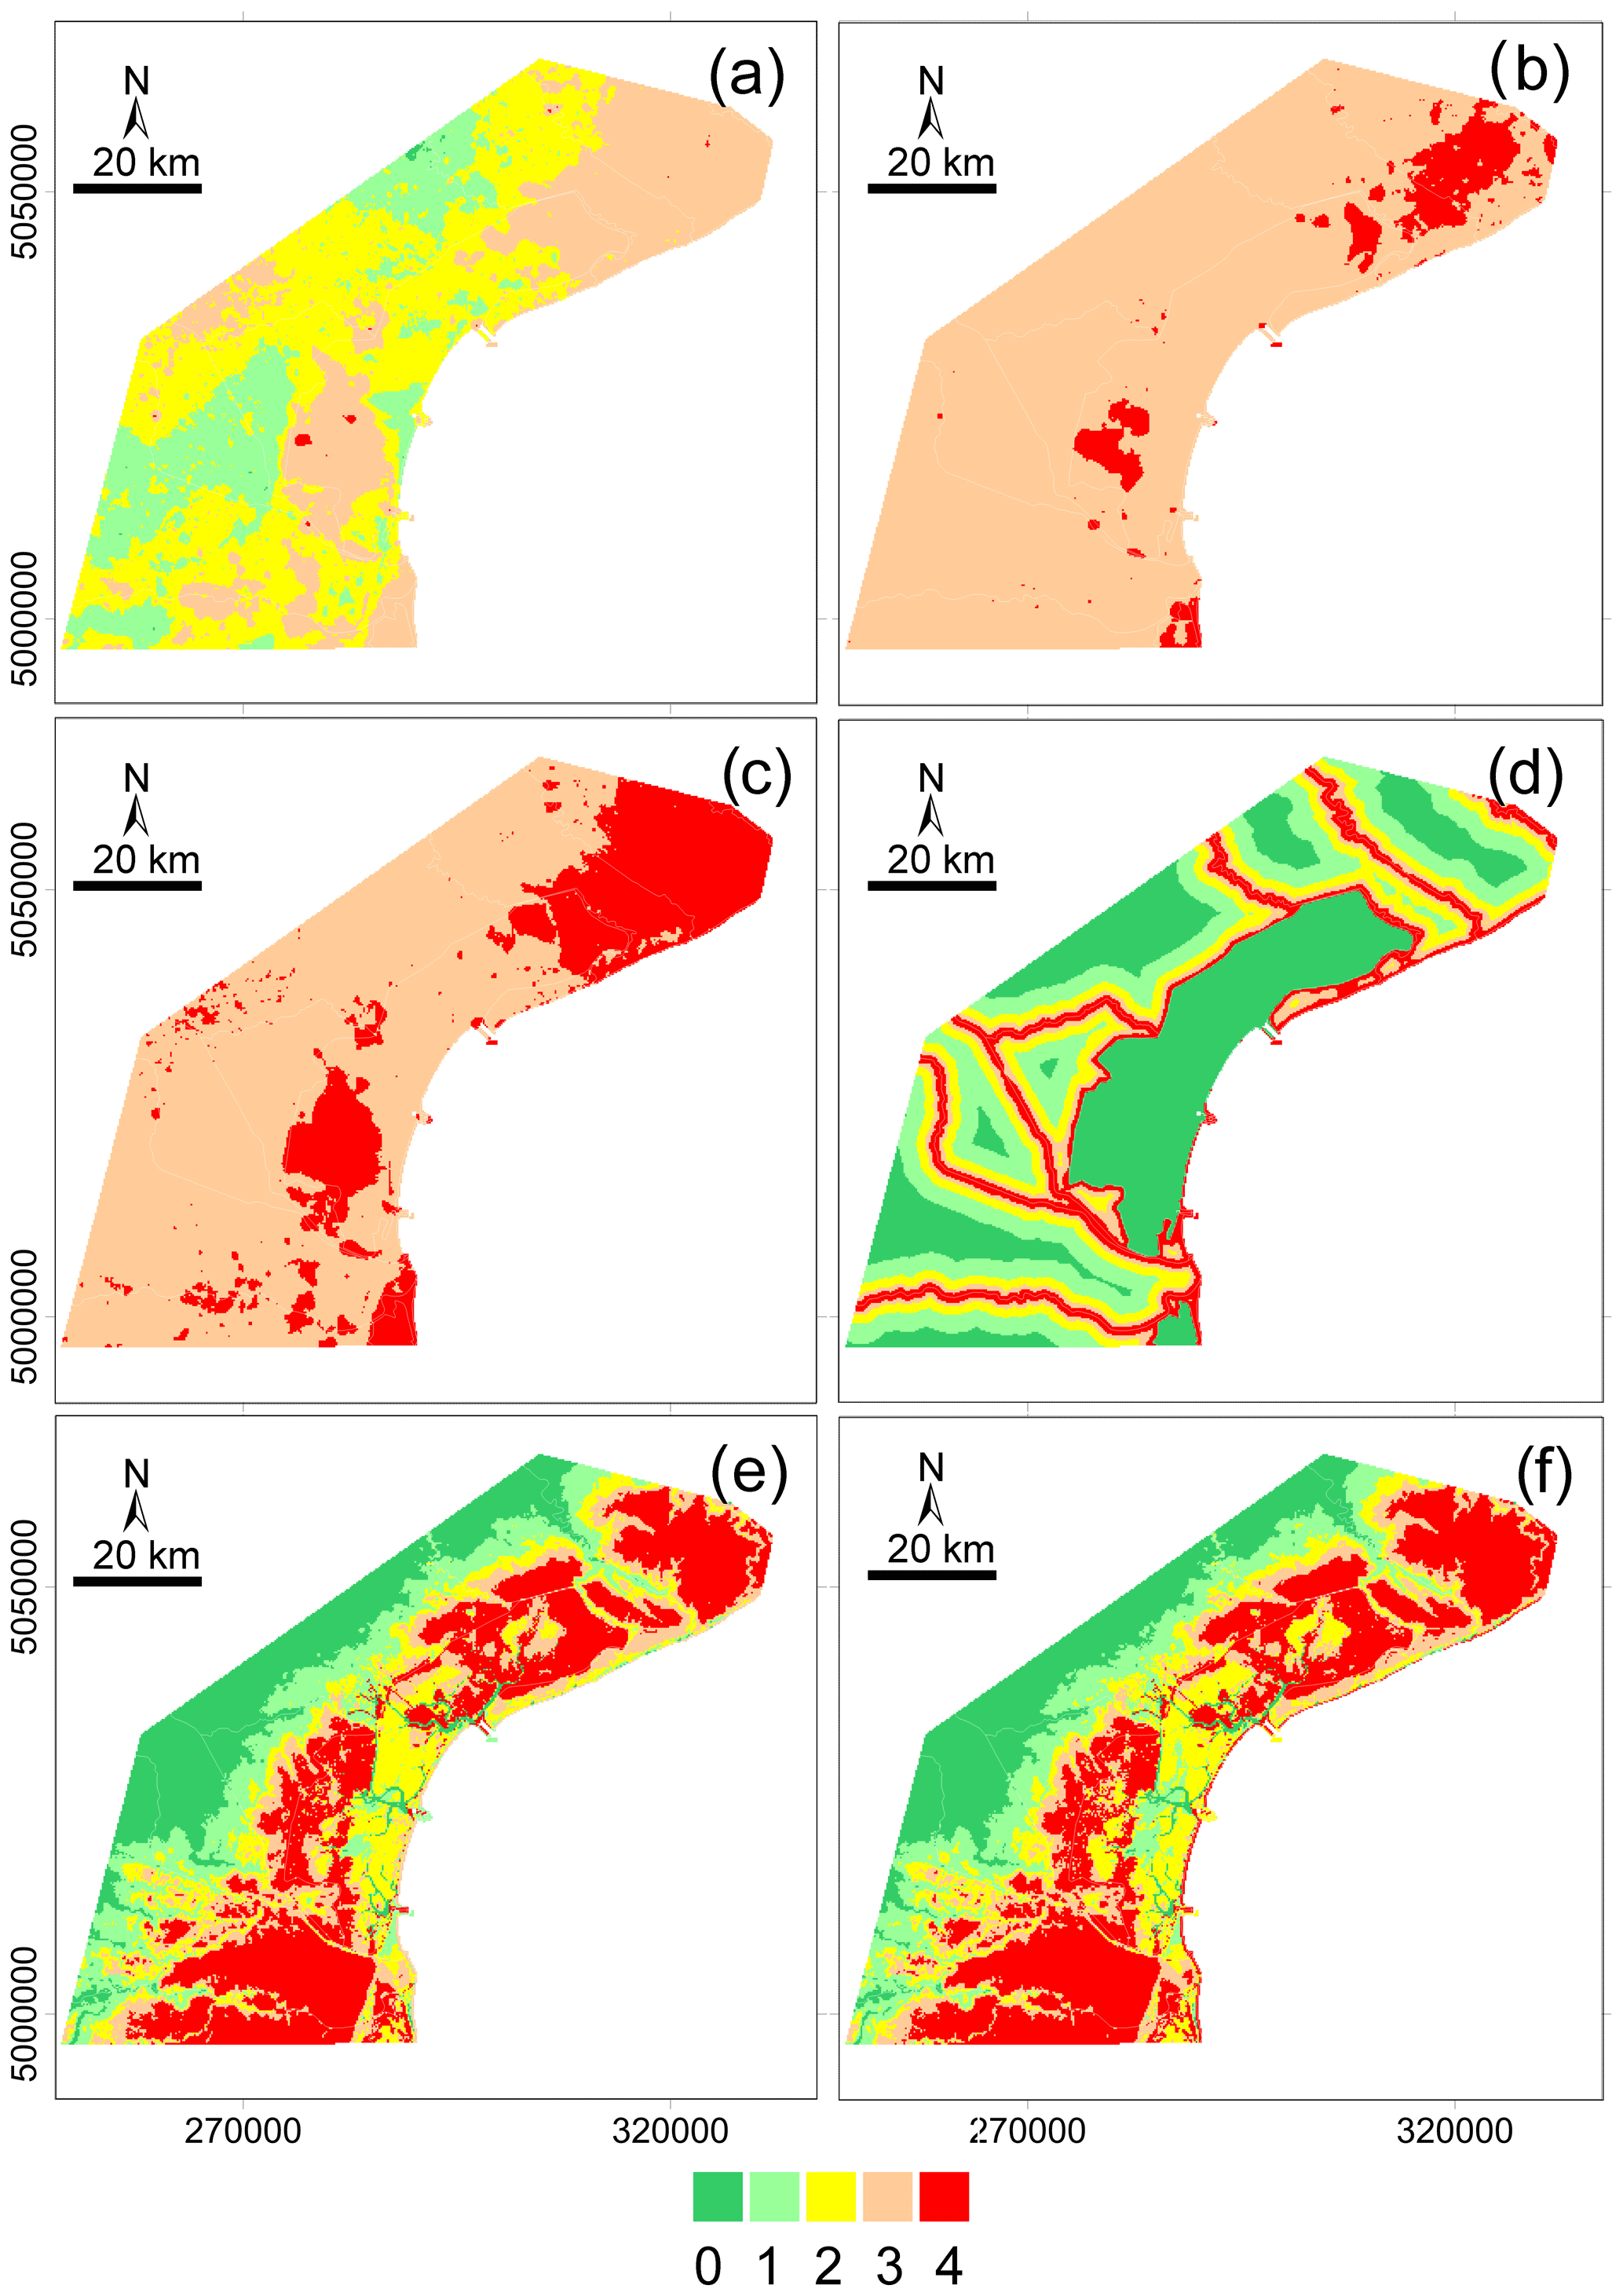
Figure 3Classified thematic layers influencing vulnerability to RSLR: cRSUBS for the ongoing long-time series scenario (a), ongoing short-time series scenario (b), future scenario (c); cWD (d); cDEM computed for both the ongoing long-time series and short-time series (e), and for the future scenario (f).
The maps showing the vulnerability to RSLR of the Venice coastland for the ongoing long-time series scenario, ongoing short-time series scenario and future scenario in 2050 are presented in Fig. 4.
The use of high spatial resolution land subsidence maps obtained by Satellite SAR interferometry makes it possible to take a step forward in the analysis of the vulnerability to RSLR with respect to previous works that generally considered land subsidence quite homogeneous or with a region trend.
The vulnerability analysis of Venice's coastland to RSLR presented here uses thematic layers at 200 m spatial resolution (Figs. 2 and 3).
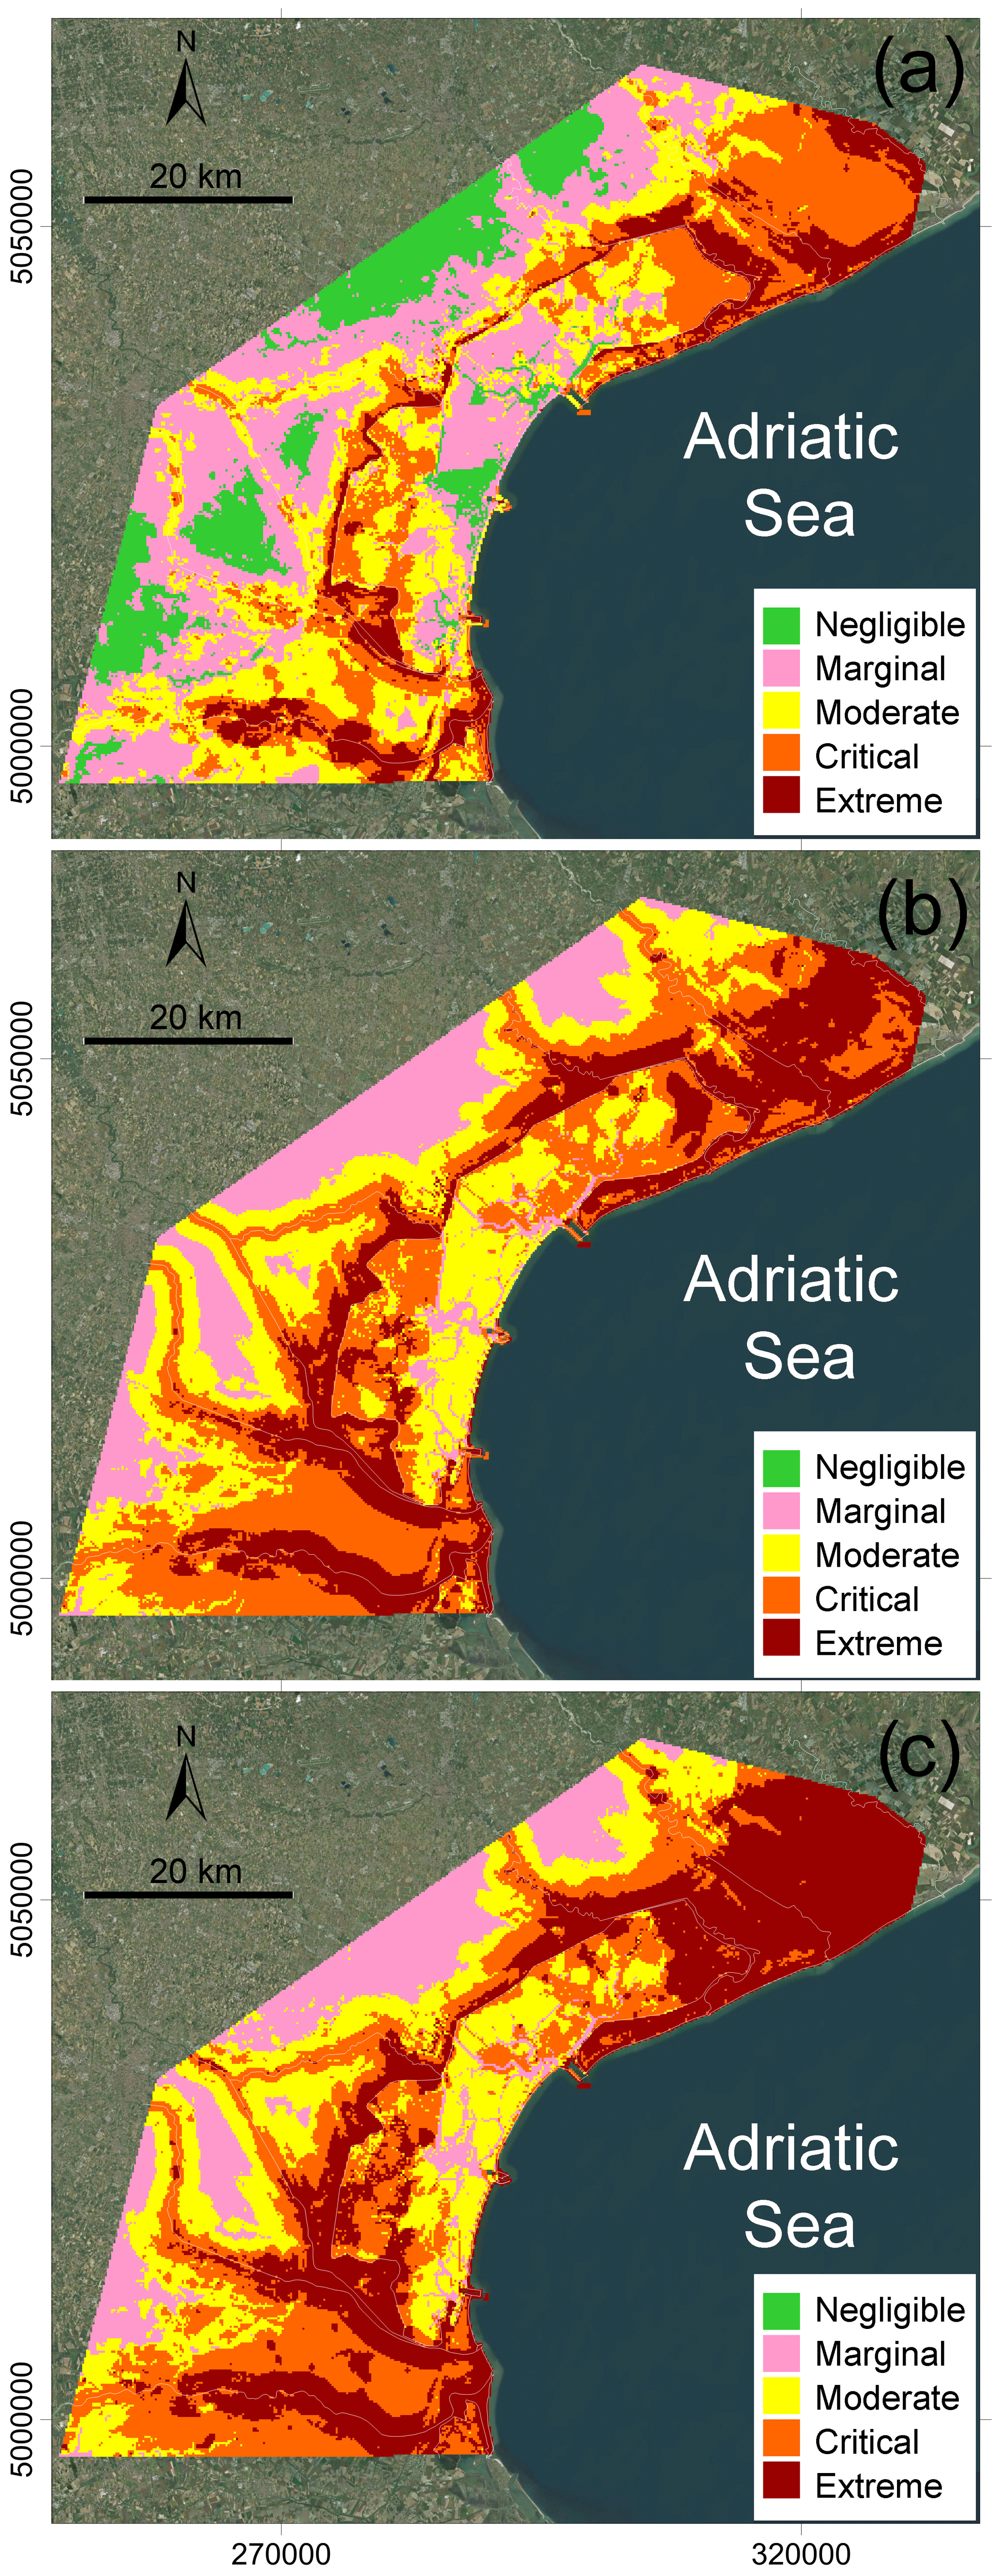
Figure 4Vulnerability to RSLR of the Venice coastal area: (a) ongoing long-time series scenario; (b) ongoing short-time series scenario; (c) future scenario in 2050. Base map source: Esri, DigitalGlobe, GeoEye, Earthstar Geographics, CNES/Airbus DS, USDA, USGS, Aerogrid, IGN, and the GIS User Community.
Regarding the outcome of the vulnerability analysis (Fig. 4), the percentages of the Venice coastland in each class of the CVI under the ongoing long-time series, ongoing short-time series and future scenarios are summarized in Table 3.
Table 3Percentages of the Po delta area in each class of the CVI under the three scenarios.
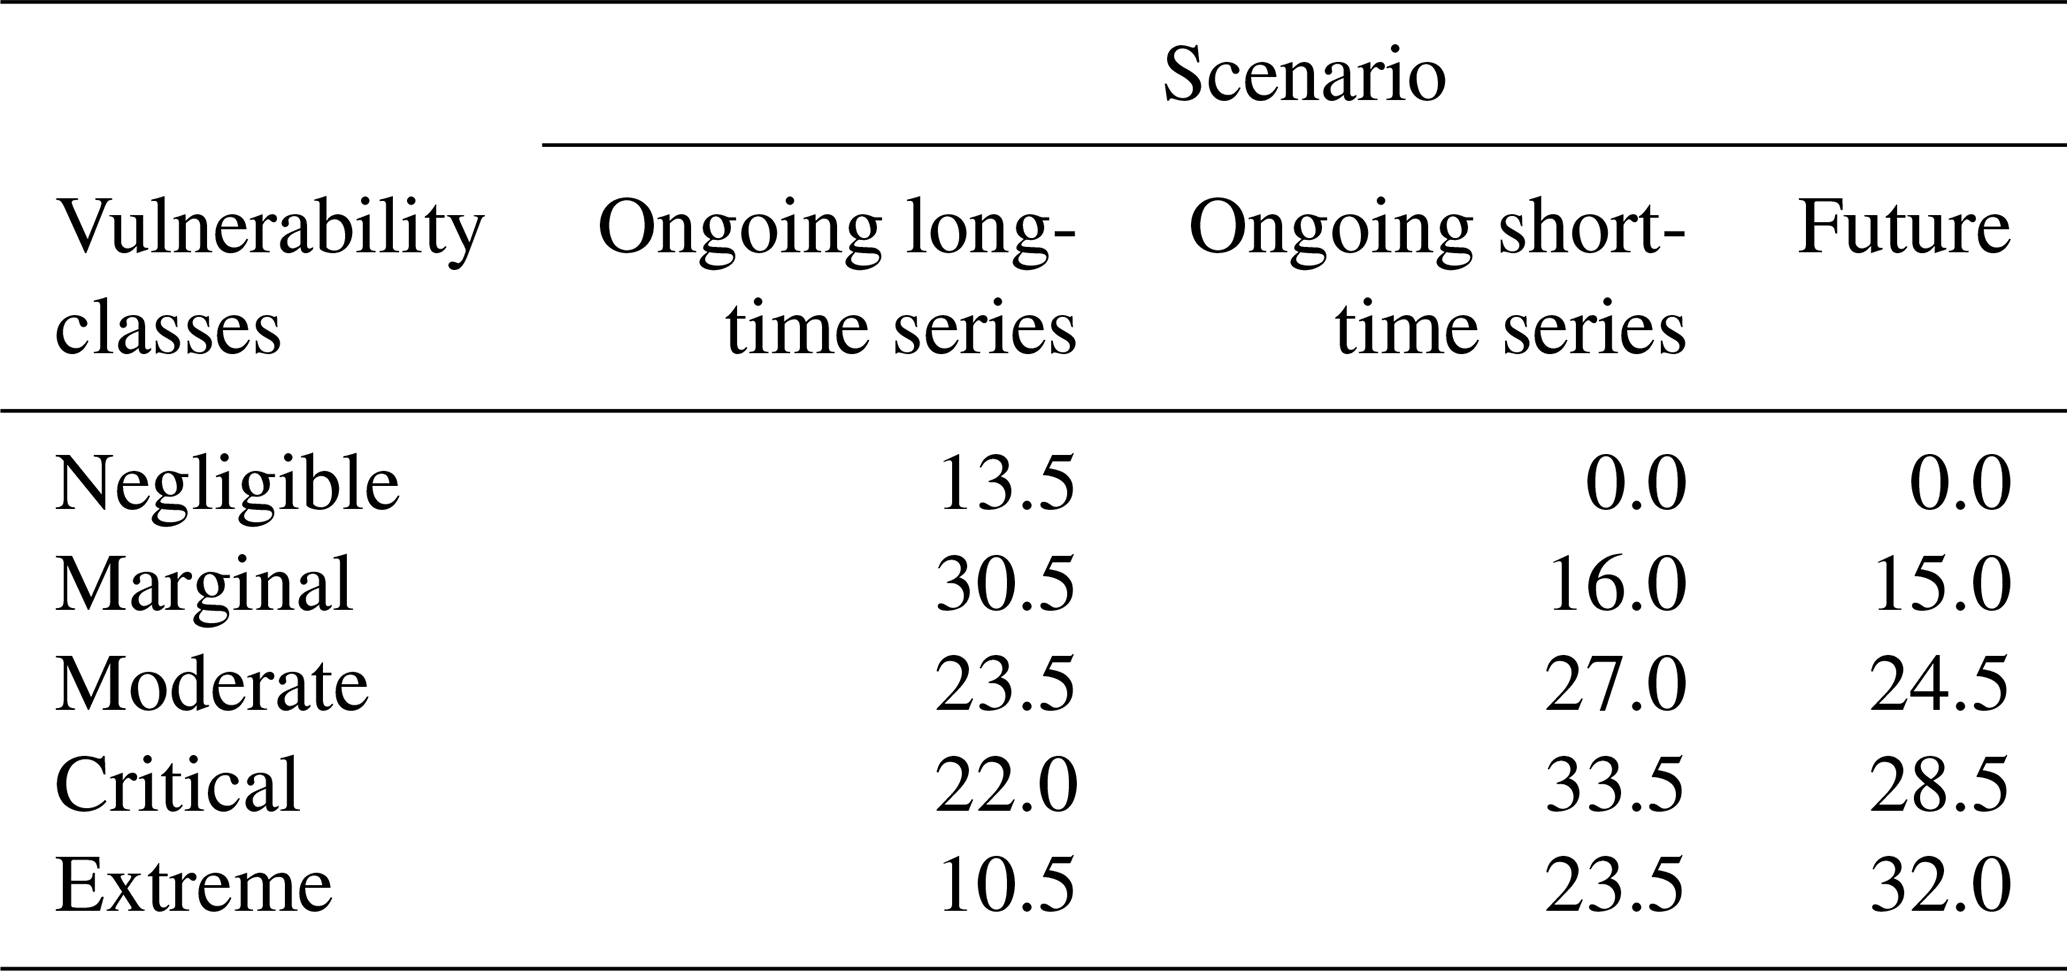
Under the ongoing long-time series scenario, the areas with negligible vulnerability to RSL cover only 13.5 %. Areas with marginal, moderate and critical vulnerability are more extended, amounting to 30.5 %, 23.5 % and 22 %, respectively. About 10 % of the coastland is in an extreme vulnerability condition. Using the ongoing short-time series and future scenarios the areas with negligible class vanish and 27 %, 33 %, 23.5 % are the percentages of areas with moderate, critical and extreme vulnerability, respectively.
By 2050, under the future scenario, 60 % of the coastland will be in a critical and extreme vulnerability condition.
At the coastland scale, the high variability of vulnerability to RSLR reflects the variability of land subsidence, which superposes that due to the hydro-morphology setting.
Land subsidence plays a key role resulting in the variability of the vulnerability to RSLR. Land subsidence rates vary from less than 1 to about 5 mm yr−1, with local peaks reaching 10 mm yr−1. Thus also under future scenario in some sectors of the Venice coastland land subsidence and sea-level rise of the Adriatic Sea contribute equally by 2050.
It is important to highlight that the specific indices used here do not exhaustively cover all of the various factors influencing the Venice coastland in view of the expected RSLR and various assumptions based on the scientific knowledge of the study area have been made to simplify the analysis. Assumptions, along with classification and weighting criteria inevitably lead to some degree of subjective judgments. The choice of the SLR scenarios to be used in the analysis is a critical issue. Regarding the present state, notice that the yearly average value of sea level changes is quite variable and is characterized by pseudo-cyclicity and oscillations (e.g., Carbognin et al., 2010). Time series shorter than 50–60 years often yield fuzzy and contradictory predictions. The 1.3 mm yr−1 average SLR over the 1875–2018 time interval, i.e. the ongoing long-time series scenario, is certainly significant and robust for the Adriatic Sea. However, the 3.8 mm yr−1 resulting from the 1992–2018 period, i.e. the ongoing short-time series scenario, shows a fairly uniform trend that could be more representative for the present state. Regarding the future scenario, the uncertainty characterizes the quantification of both the expected SLR and land subsidence evolution. To this end, the expected scenario here considered is limited to 2050, being an evolution model of land subsidence unavailable for the study area and the large difference of the SLR projections by 2100. In any case, it is possible to assume that land subsidence will continue in accordance with the present trend because the groundwater regulation adopted in Venice and the long-term secondary consolidation of the Holocene deposits will remain almost unchanged over a relatively short period. Regarding the global sea-level rise by 2050, a rate of 5 mm yr−1 computed from the IPCC projections is adopted (IPCC, 2014).
In relation to the shoreline erosion and the sinking of the embankments, it was assumed that over the next 30 years, beaches nourishment and land reclamation will be able to keep pace with the RSLR.
The vulnerability to RSLR exhibits substantial variability among individual areas reflecting the heterogeneity of land subsidence and the hydro-morphology setting. The key results of this study are the following:
Land subsidence rates vary from less than 1 to more than 5 mm yr−1. Thus, it means that also under future scenario land subsidence in some sectors of the Venice coastland contributes equally with the sea-level rise of the Adriatic Sea in the vulnerability analysis.
Under the ongoing long-time series scenario, 30.5 %, 23.5 % and 22 % of the coastland area is classified with marginal, moderate and critical vulnerability, respectively.
Under the future scenario, i.e. by 2050, the areas with critical and extreme vulnerability are expected to cover 60 % of the Venice coastland.
Although this study represents a step forward in the assessment of the vulnerability to RSLR of the Venice coastland, the authors are aware that further studies will have to face the uncertainties not addressed in this analysis.
The majority of the data presented here are from an ongoing and yet incomplete project. The datasets generated during the current study are available from the corresponding author on reasonable request. Data courtesy: (1) Sentinel-1 data from ESA and EU Copernicus Programme are free available through Copernicus Open Access Hub (https://scihub.copernicus.eu); (2) Bathymetric data are from Consorzio di Bonifica Delta del Po and Venice Water Authority.
LT and CDL conceived the idea, designed the study concept and developed the analysis; TS processed SAR data; LT, CDL, PT wrote the manuscript with support by TS and SD.
The authors declare that they have no conflict of interest.
This article is part of the special issue “TISOLS: the Tenth International Symposium On Land Subsidence – living with subsidence”. It is a result of the Tenth International Symposium on Land Subsidence, Delft, the Netherlands, 17–21 May 2021.
This work has been developed in the framework of the VENEZIA-2021 Research Programme, Topic 3.1, funded by the “Provveditorato Interregionale Opere Pubbliche per il Veneto, Trentino Alto Adige e Friuli Venezia Giulia” through the “Concessionario Consorzio Venezia Nuova” and coordinated by CORILA, Venice. This article is also a contribution to the International Geoscience Programme Project 663 “Impact, Mechanism, Monitoring of Land Subsidence in Coastal Cities”.
Carbognin, L., Teatini, P., Tomasin, A., and Tosi, L: Global change and relative sea level rise at Venice: what impact in term of flooding, Clim. Dynam., 35, 1055–1063, https://doi.org/10.1007/s00382-009-0617-5, 2010.
Church, J. A., Clark, P. U., Cazenave, A., Gregory, J. M., Jevrejeva, S., Levermann, A., Merrifield, M. A., Milne, G. A., Nerem, R. S., Nunn, P. D., Payne, A. J., Pfeffer, W. T., Stammer, D., and Unnikrishnan, A. S.: Sea-level Change, Contribution of Working Group I to the Fifth Assessment Report of the Intergovernmental Panel on Climate Change, edited by: Stocker, T. F., Qin, D., Plattner, G.-K., Tignor, M., Allen, S. K., Boschung, J., Nauels, A., Xia, Y., Bex, V., and Midgley, P. M., Climate Change 2013: the Physical Science Basis, Cambridge University Press, Cambridge, United Kingdom and New York, USA, 1137–1216, 2013.
Erkens, G., Bucx, T., Dam, R., de Lange, G., and Lambert, J.: Sinking coastal cities, Proc. IAHS, 372, 189–198, https://doi.org/10.5194/piahs-372-189-2015, 2015.
Gasparetto-Stori, G., Strozzi, T., Teatini, P., Tosi, L., Vianello, A., and Wegmuller, U.: Dem of the Veneto plain by ERS2-ENVISAT cross interferometry, edited by: Scappini, S. and Zapparoli, S., 7th EUREGEO, European Congress on Regional Geoscientific Cartography and Information Systems, Centro Stampa Regione Emilia-Romagna Publ, Vol. I, 345–350, 2012.
Gornitz, V. M.: Global coastal hazards from future sea-level rise, Global and Planetary Change Section, Palaeogeogr. Palaeocl., 89, 379–398, https://doi.org/10.1016/0031-0182(91)90173-O, 1991.
IPCC: Summary for Policymakers, in: Climate Change 2013 – The Physical Science Basis: Working Group I Contribution to the Fifth Assessment Report of the Intergovernmental Panel on Climate Change Cambridge: Cambridge University Press., https://doi.org/10.1017/CBO9781107415324.004, 1–30, 2014.
Jankowski, K. L., Törnqvist, T. E., and Fernandes, A. M.: Vulnerability of Louisiana's coastal wetlands to present-day rates of relative sea-level rise, Nat. Commun., 8, 14792, https://doi.org/10.1038/ncomms14792, 2017.
Jenks, G. F.: The data model concept in statistical mapping, International Yearbook of Cartography, 7, 186–190, 1967.
Strozzi, T., Teatini, P., Tosi, L., Wegmüller, U., and Werner, C.: Land subsidence of natural transitional environments by satellite radar interferometry on artificial reflectors, J. Geophys. Res.-Earth, 118, 1177–1191, https://doi.org/10.1002/jgrf.20082, 2013.
Teatini, P., Tosi, L., and Strozzi, T.: Quantitative evidence that compaction of Holocene sediments drives the present land subsidence of the Po Delta, Italy, J. Geophys. Res., 116, B08407, https://doi.org/10.1029/2010JB008122, 2011.
Tosi, L., Teatini, P., Strozzi, T., Carbognin, L., Brancolini, G., and Rizzetto, F.: Ground surface dynamics in the northern Adriatic coastland over the last two decades, Rend. Fis. Acc. Lincei, 21, 115–129, https://doi.org/10.1007/s12210-010-0084-2, 2010.
Tosi, L., Da Lio, C., Strozzi, T., and Teatini, P.: Combining L- and X-band SAR interferometry to assess ground displacements in heterogeneous coastal environments: the Po River Delta and Venice Lagoon, Italy, Remote Sens., 8, 308, https://doi.org/10.3390/rs8040308, 2016.
Wegmüller, U., Werner, C., Strozzi, T., and Wiesmann, A.: Multitemporal interferometric point target analysis, Ser. Remote Sens., 3, 136–144, 2004.
Wegmüller, U., Santoro, M., Werner, C., Strozzi, T., Wiesmann, A., and Lengert, W.: DEM generation using ERS-ENVISAT interferometry, J. Appl. Geophys., 69, 51–58, https://doi.org/10.1016/j.jappgeo.2009.04.002, 2009.